Copyright
©The Author(s) 2020.
World J Clin Cases. Jul 26, 2020; 8(14): 3006-3020
Published online Jul 26, 2020. doi: 10.12998/wjcc.v8.i14.3006
Published online Jul 26, 2020. doi: 10.12998/wjcc.v8.i14.3006
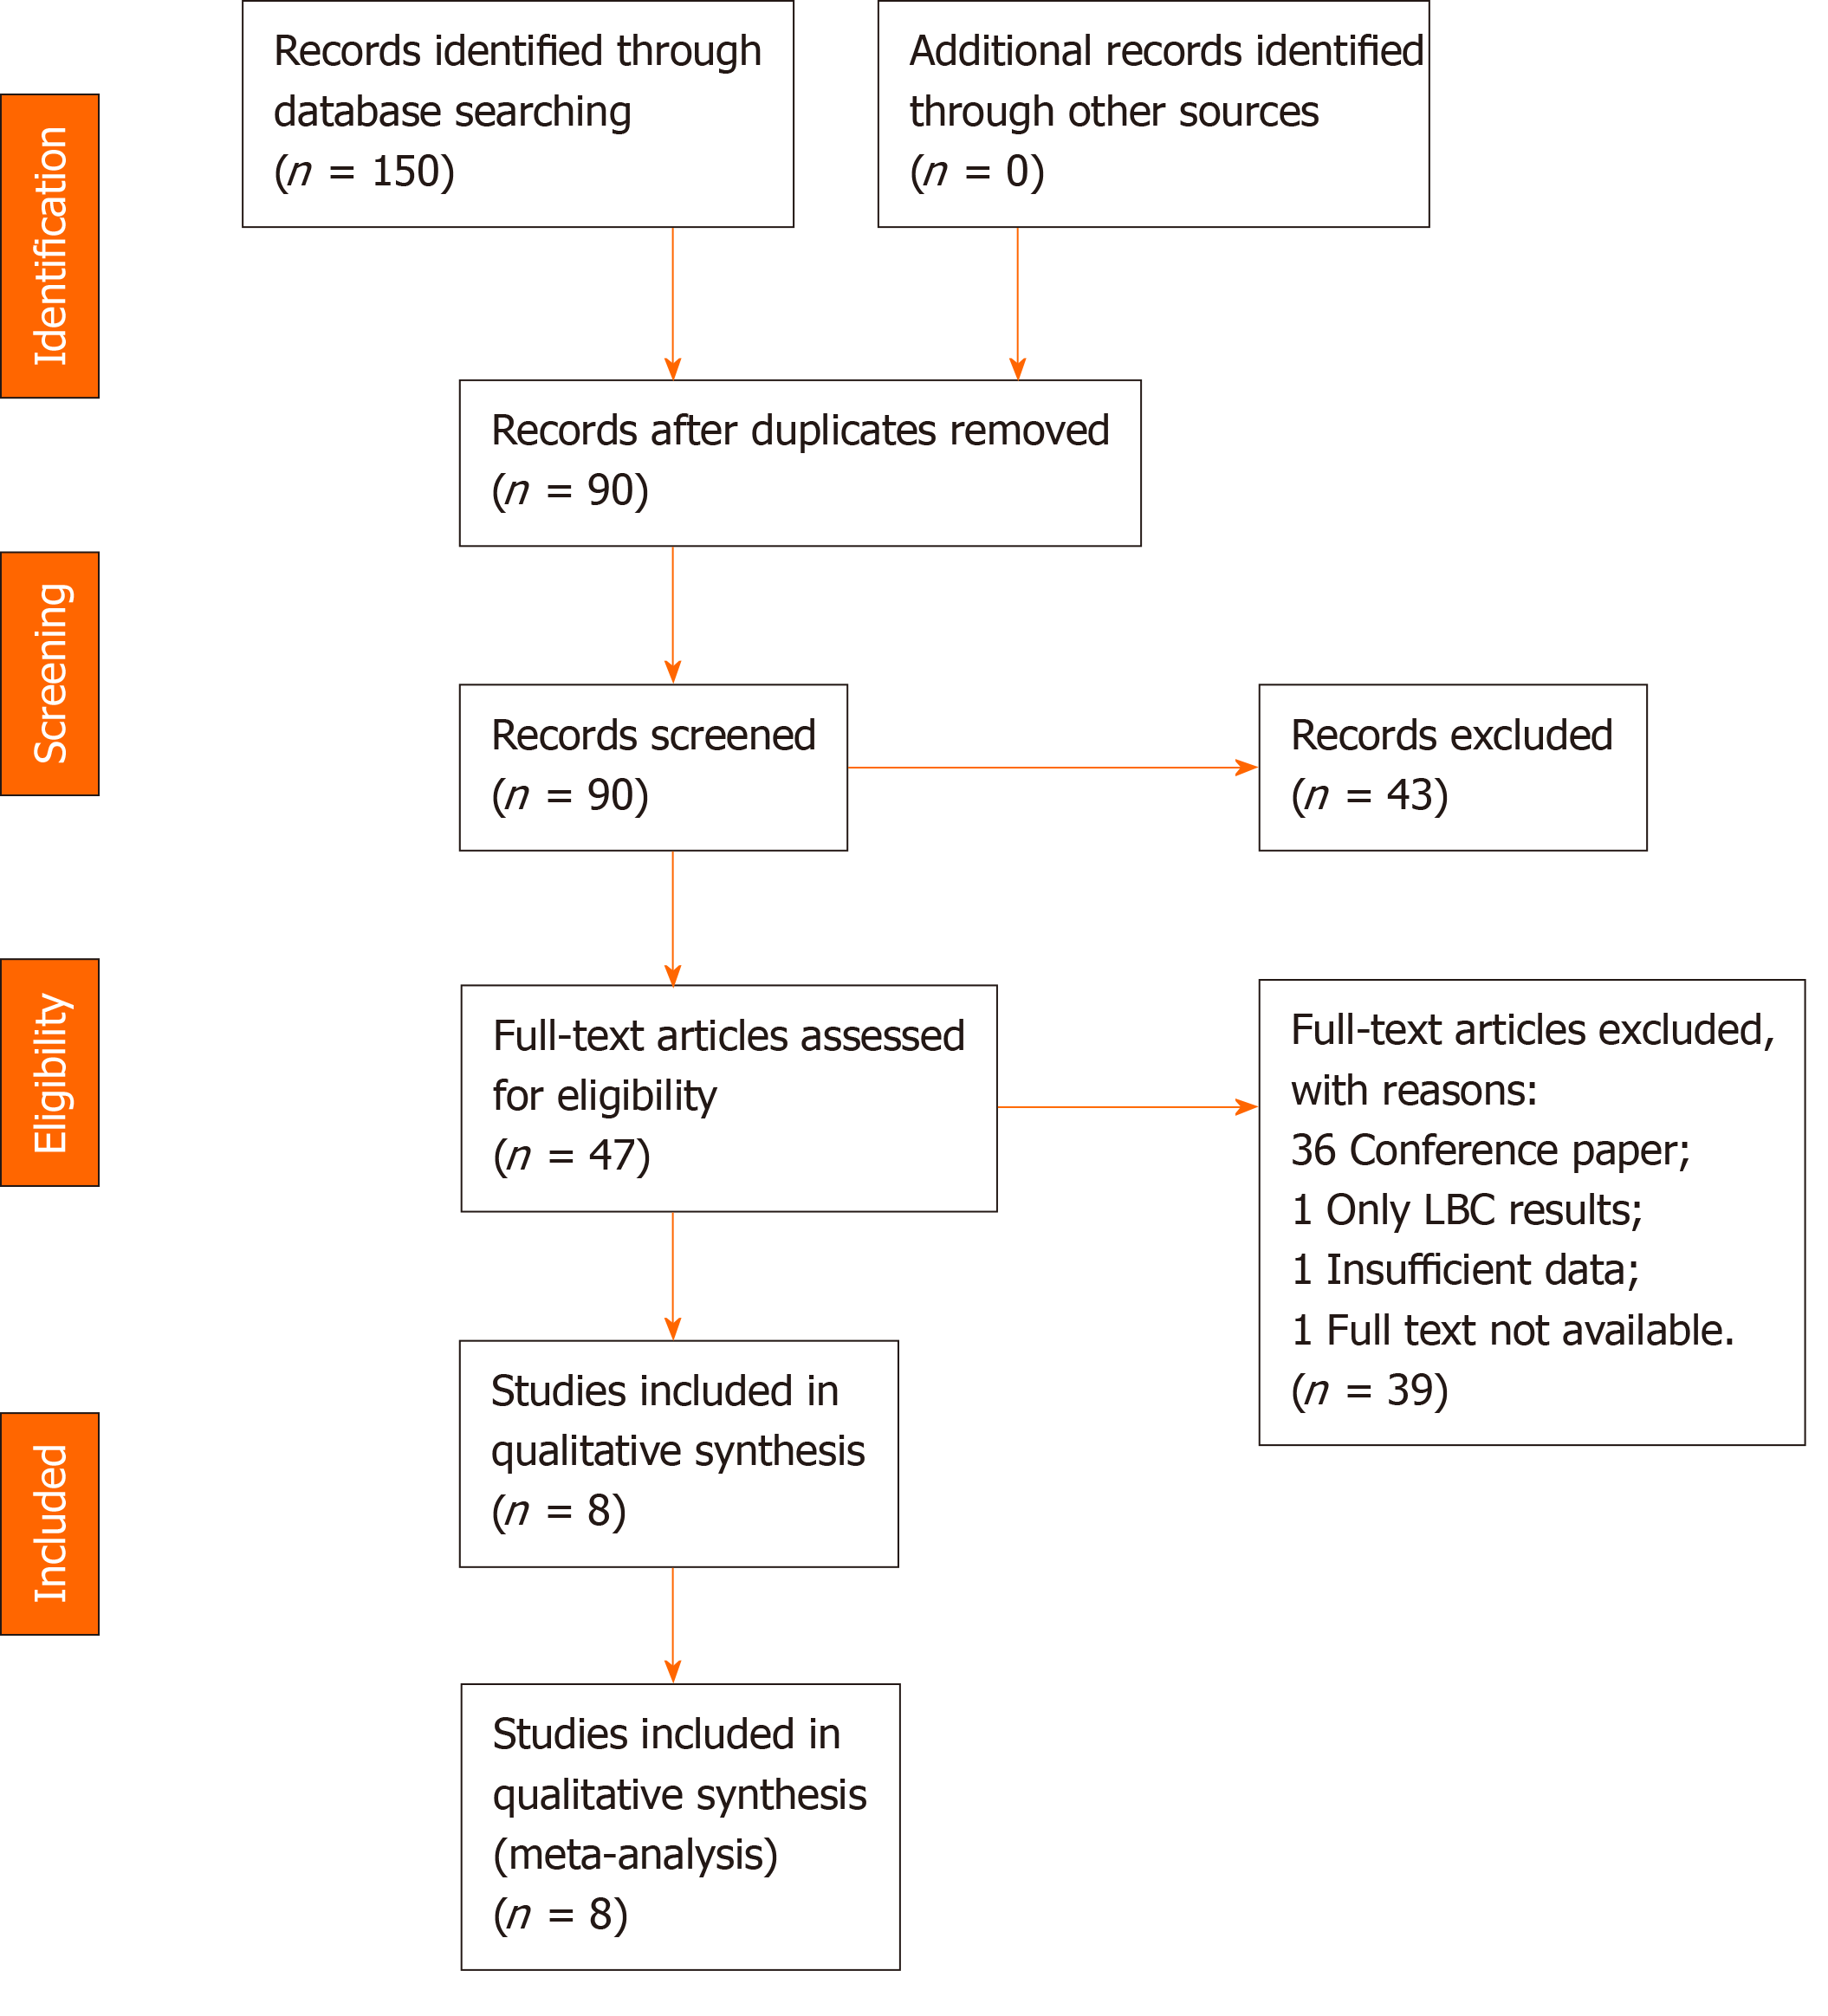
Figure 1 Study identification, inclusion, and exclusion for meta-analysis.
LBC: Liquid-based cytology.
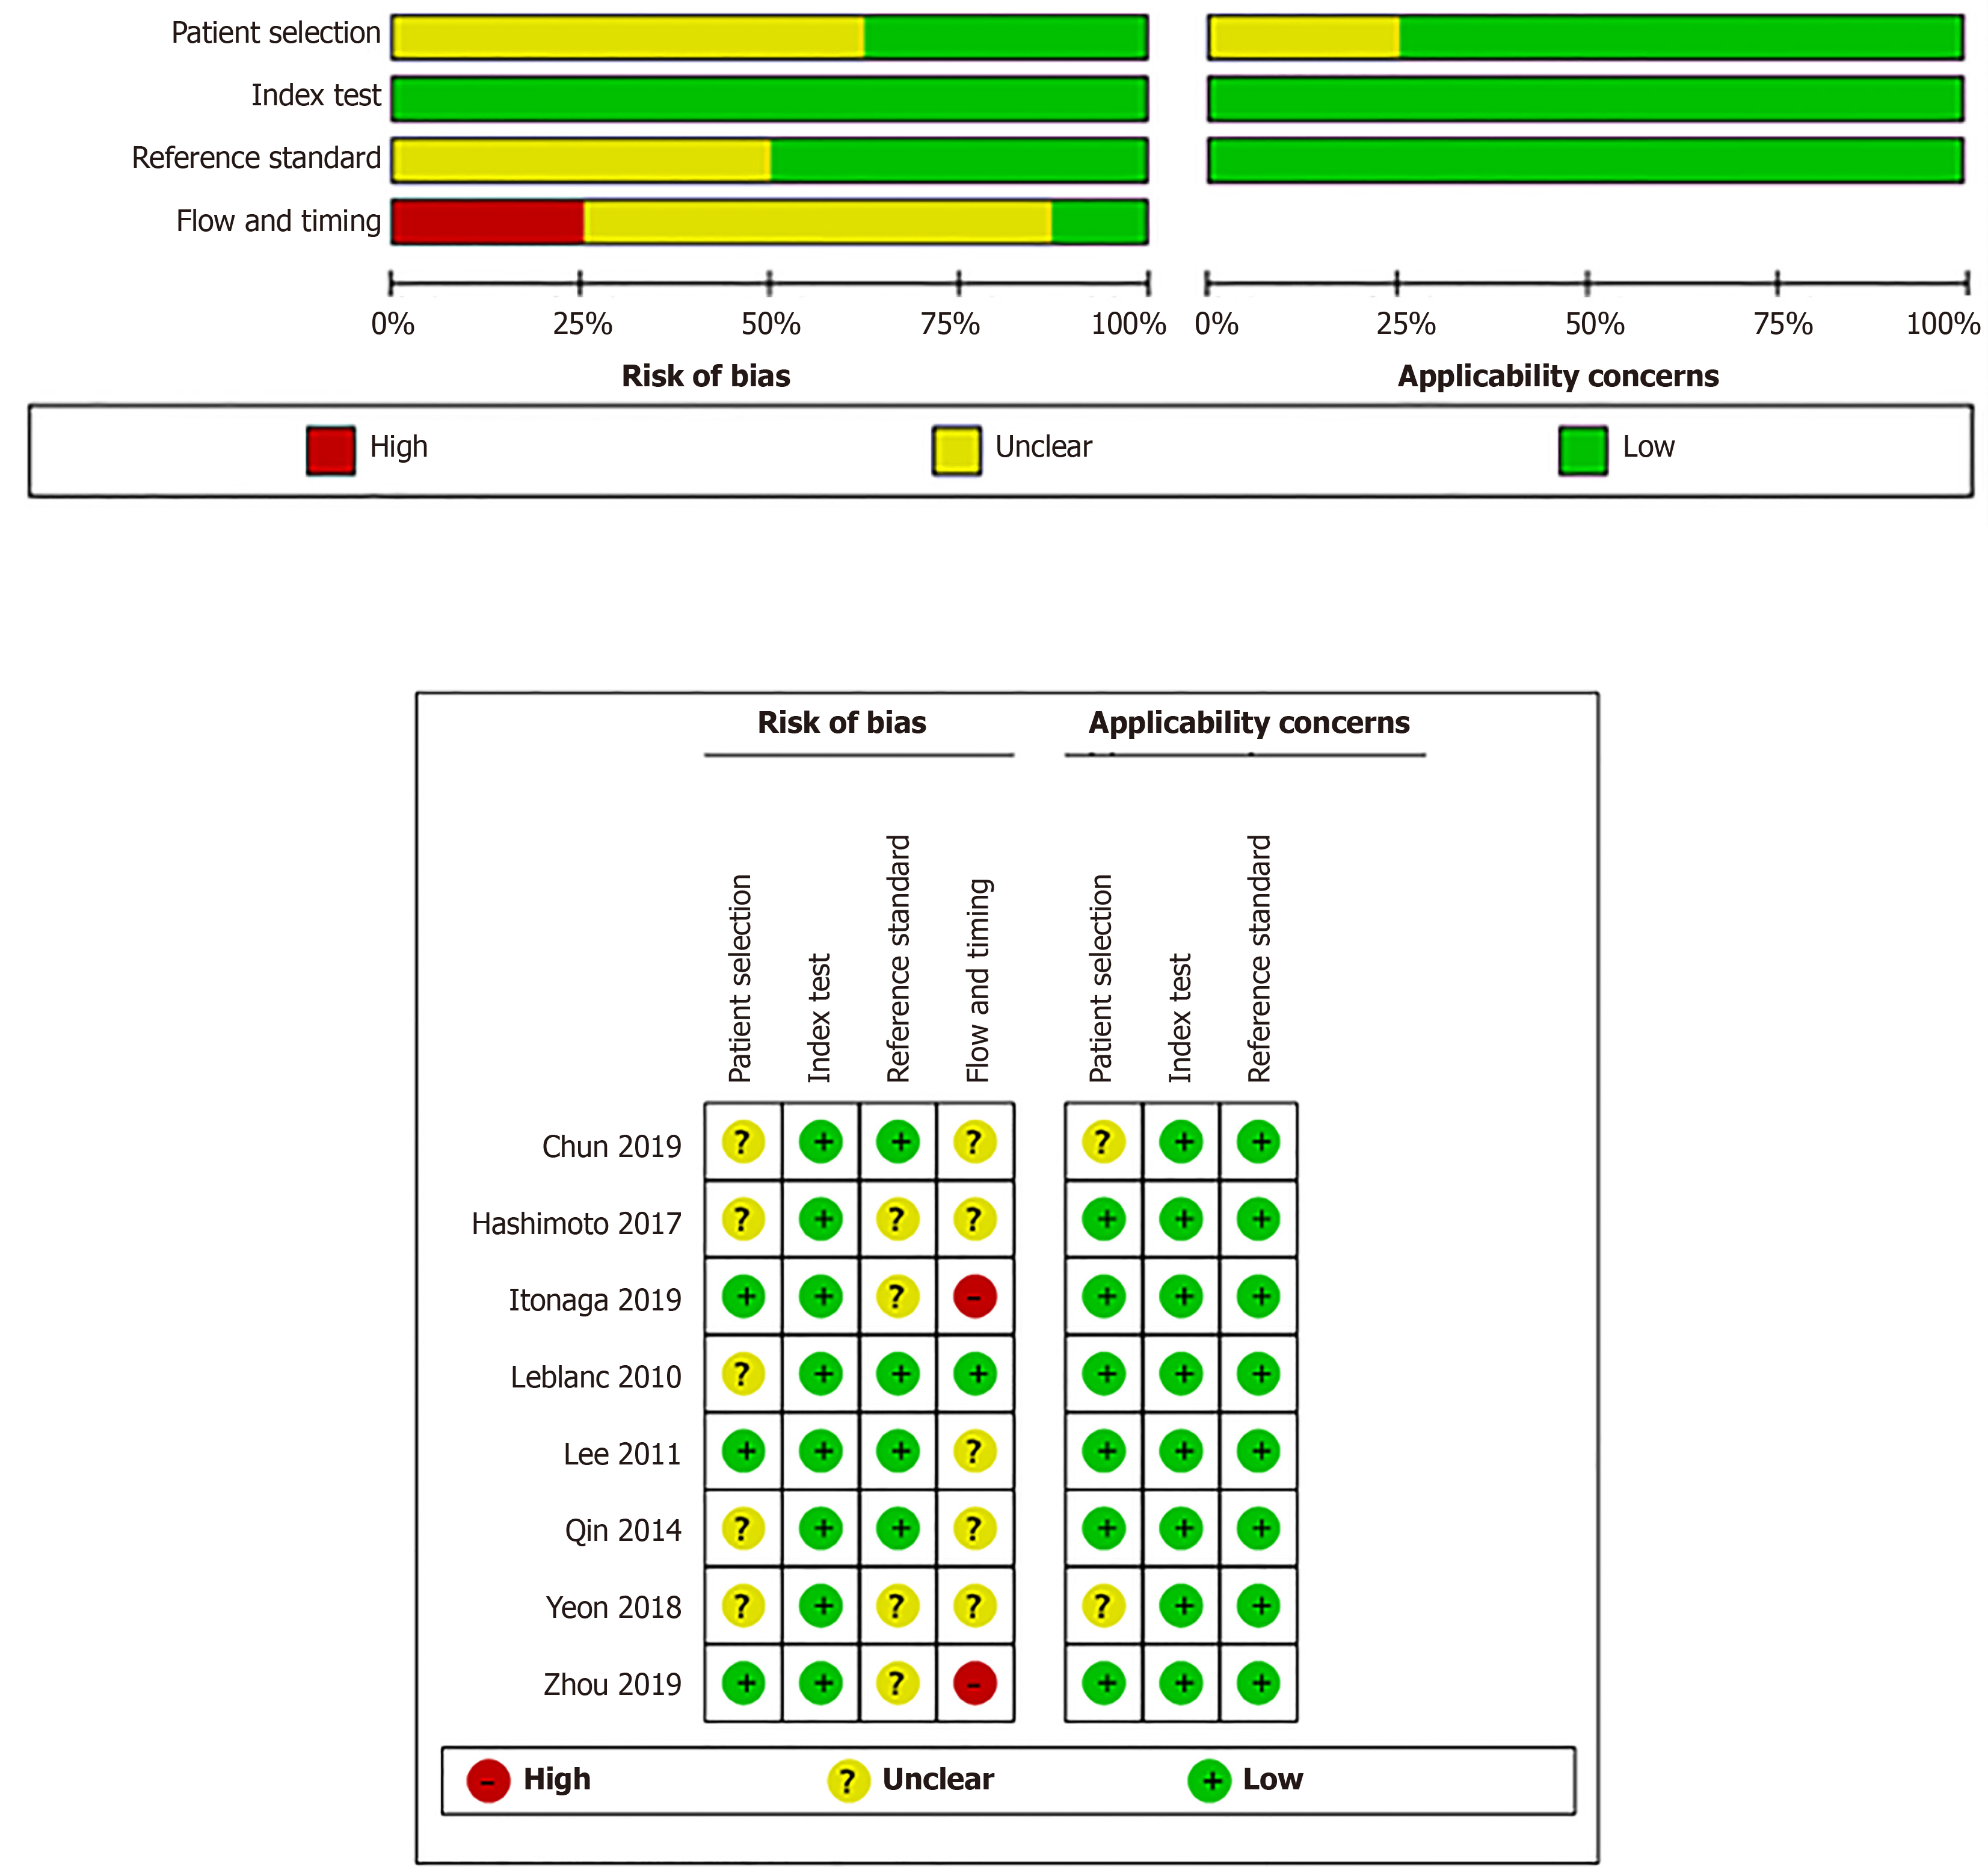
Figure 2 Quality assessment of the included studies.
Figure 3 Forrest plot of inadequate smears (dichotomous).
M-H: Mantel-Haenszel random effects model; LBC: Liquid-based cytology; SC: Smear cytology.
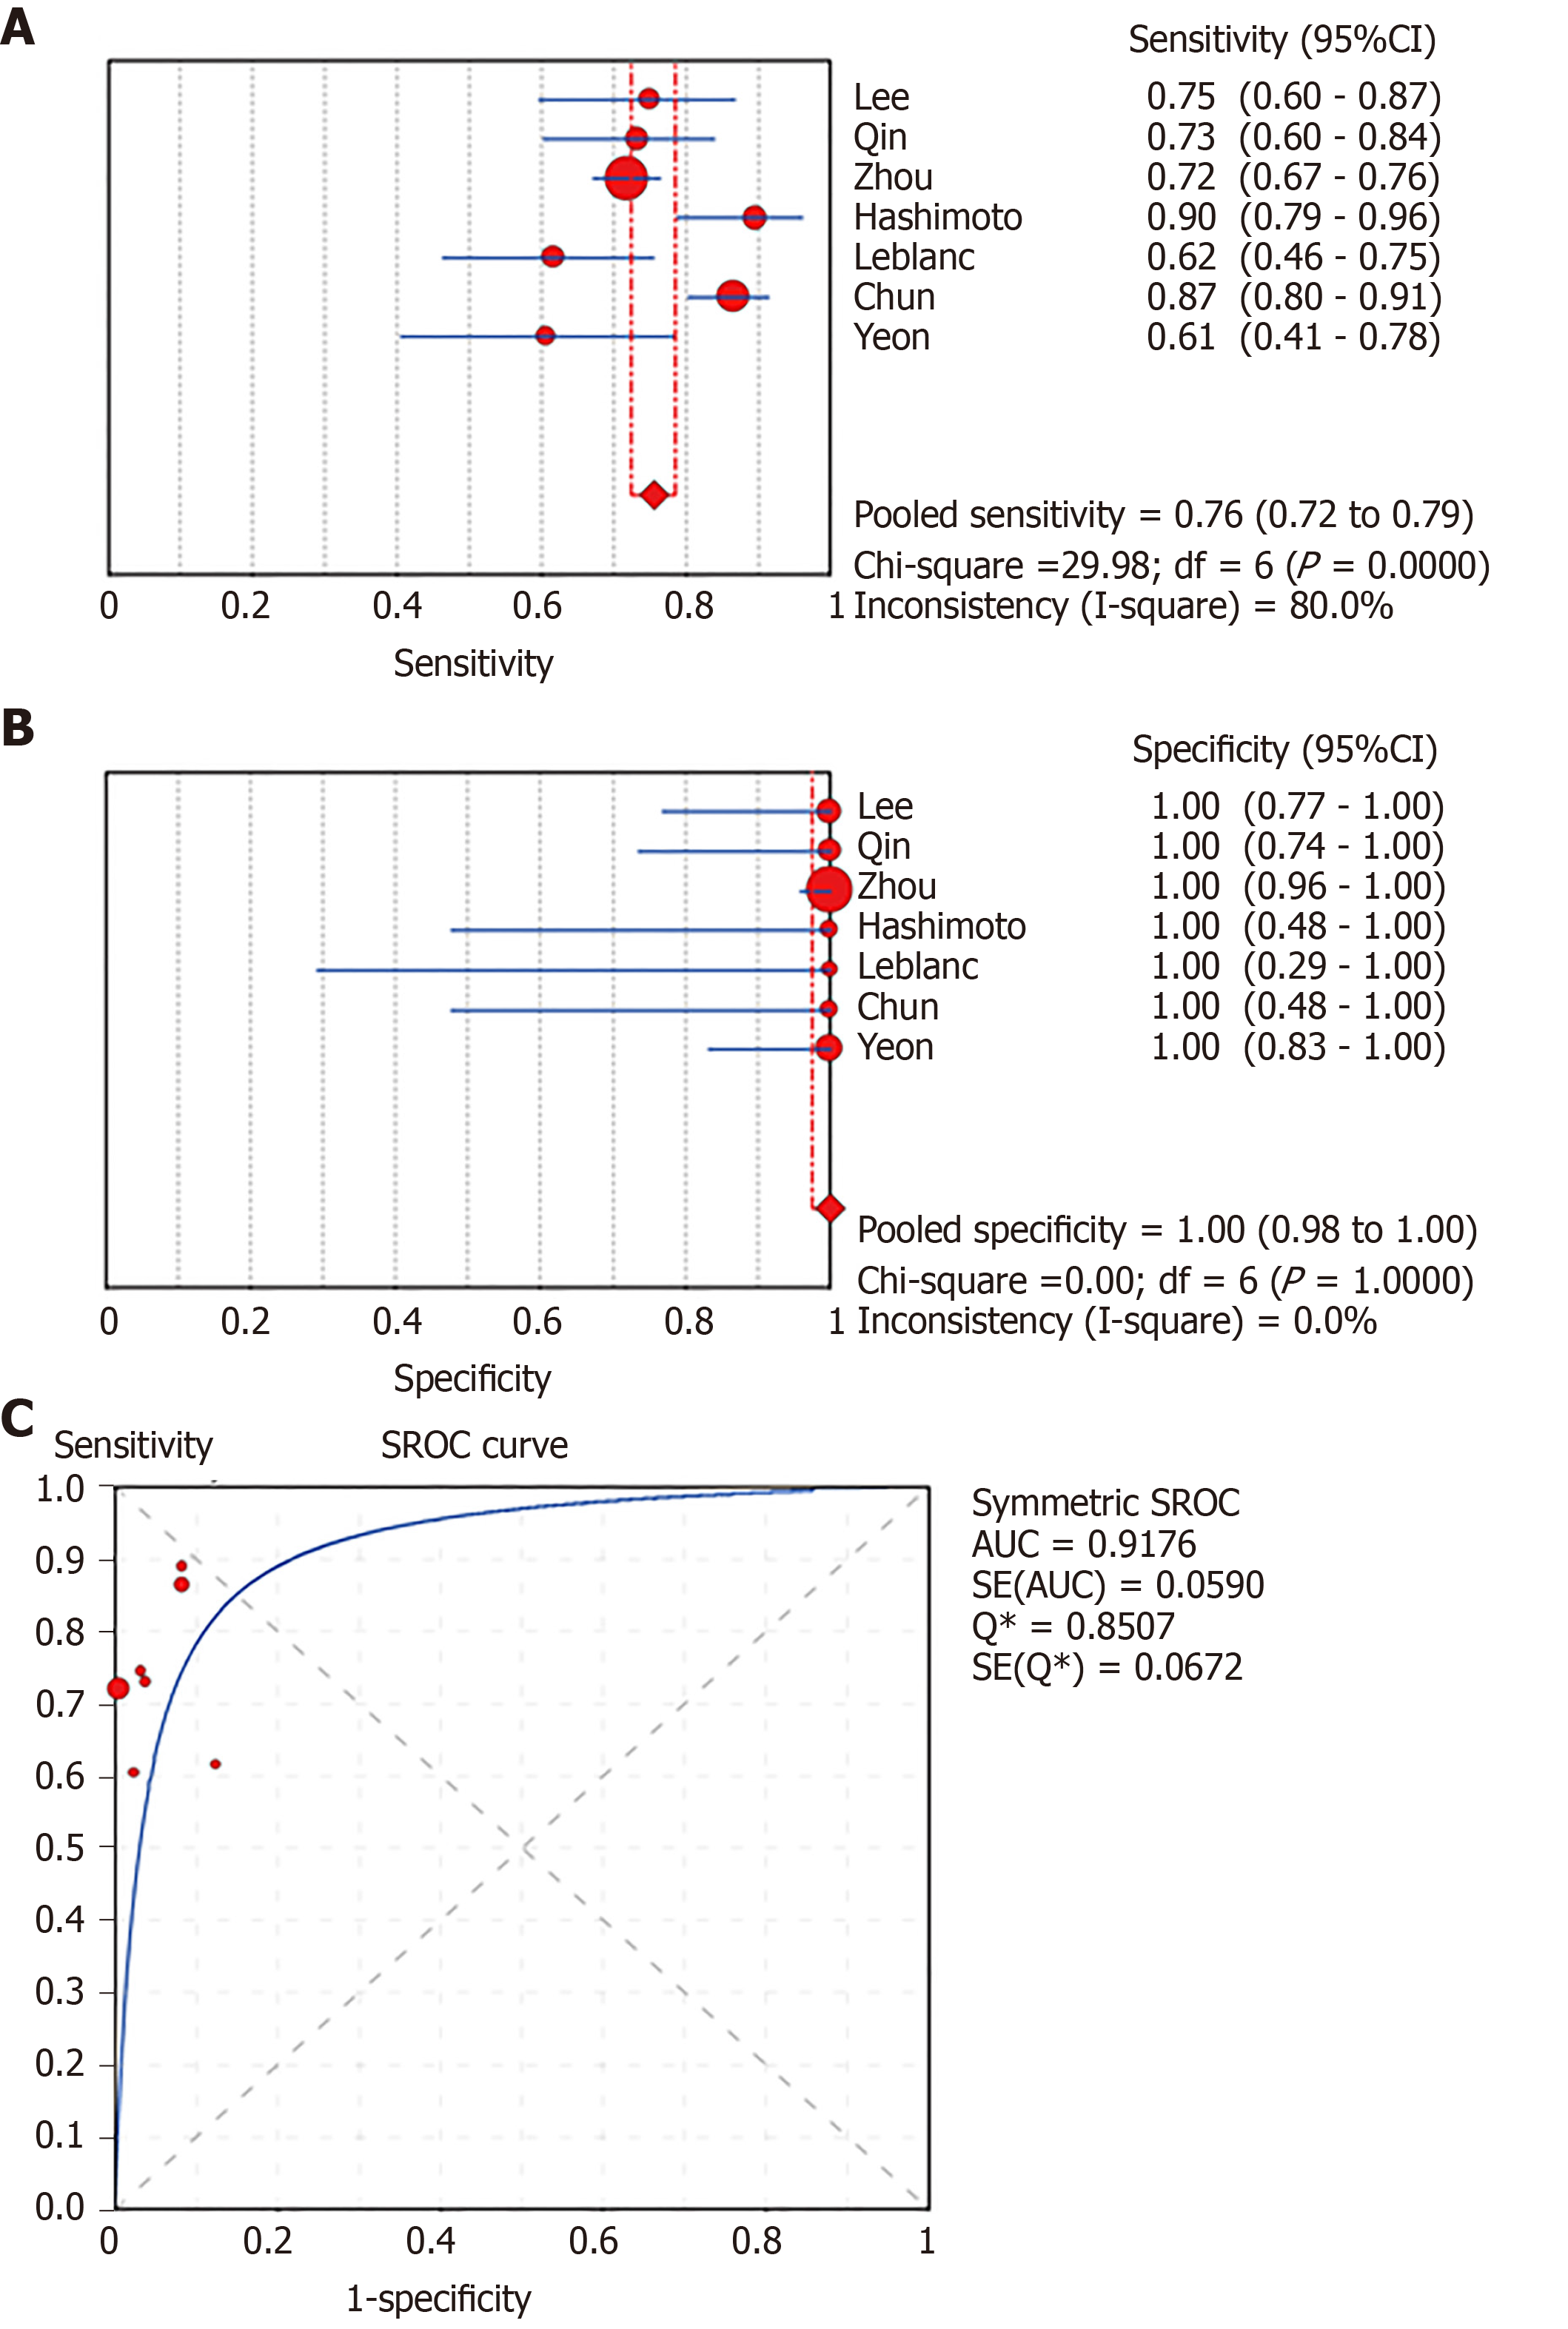
Figure 4 Forest plots of pooled sensitivity and specificity and summary receiver operating characteristic (SROC) curve of liquid-based cytology.
A: Sensitivity; B: Specificity; C: SROC curve.
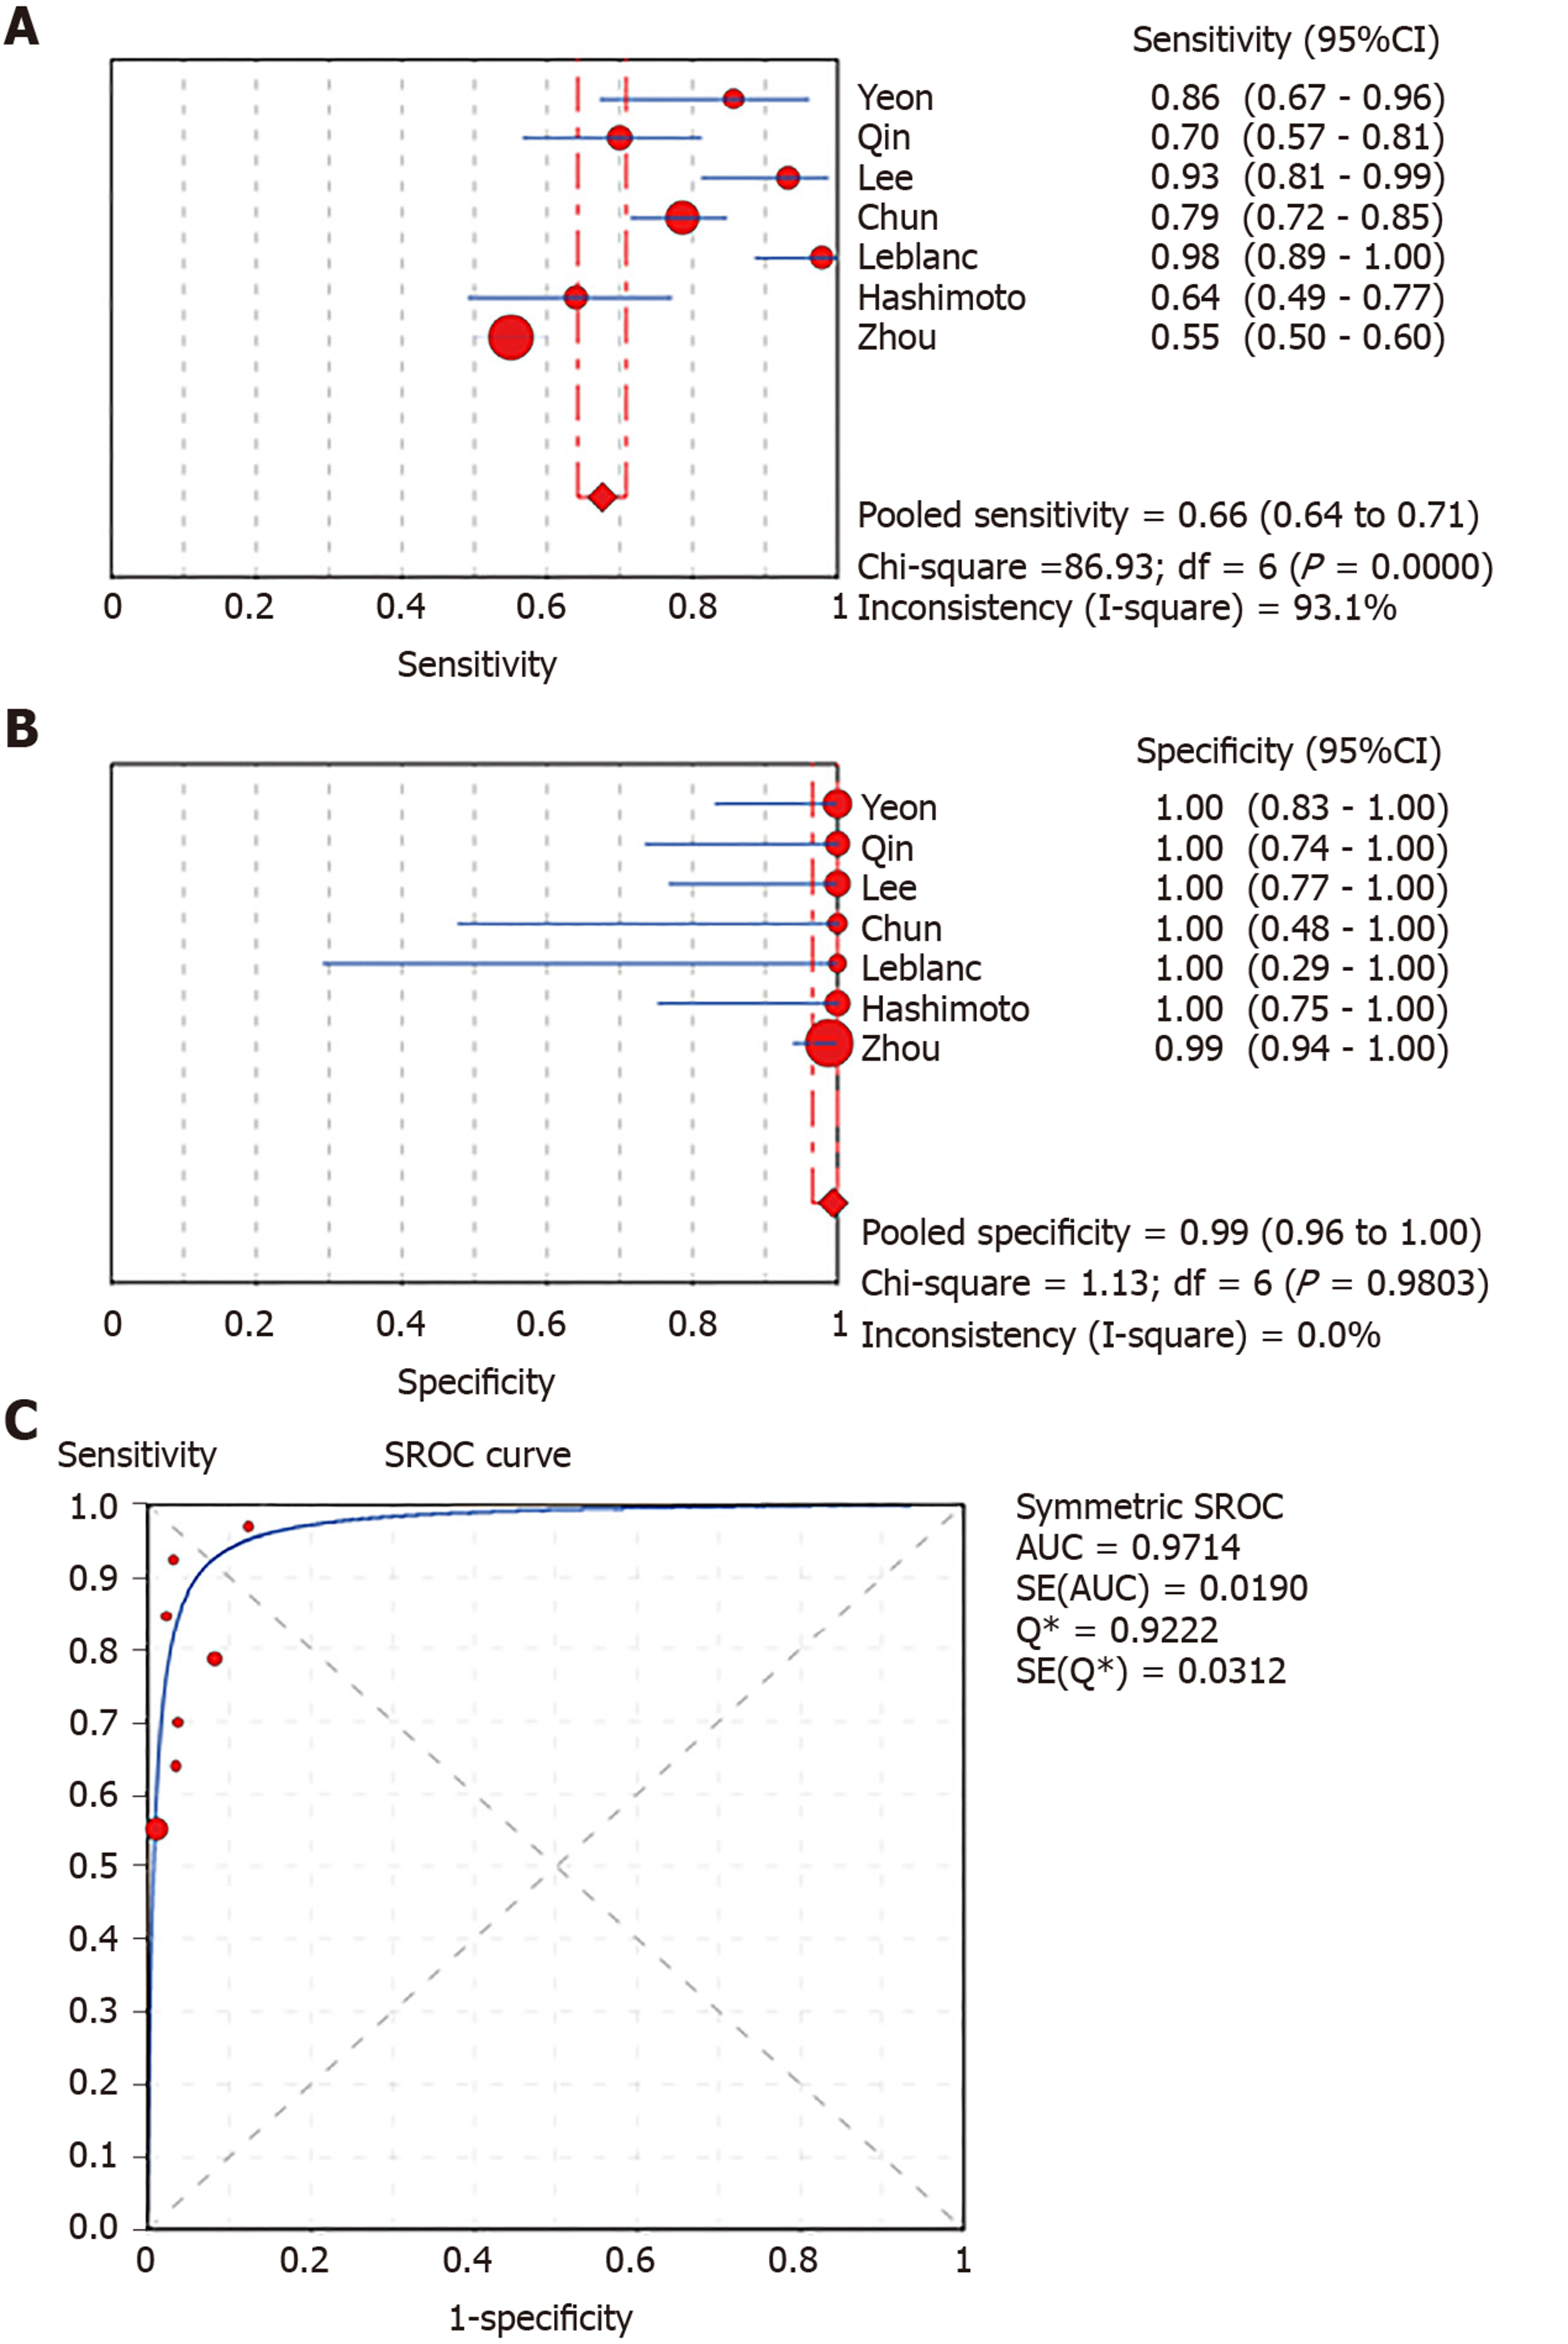
Figure 5 Forest plots of pooled sensitivity and specificity and summary receiver operating characteristic (SROC) curve of smear cytology.
A: Sensitivity; B: Specificity; C: SROC curve.
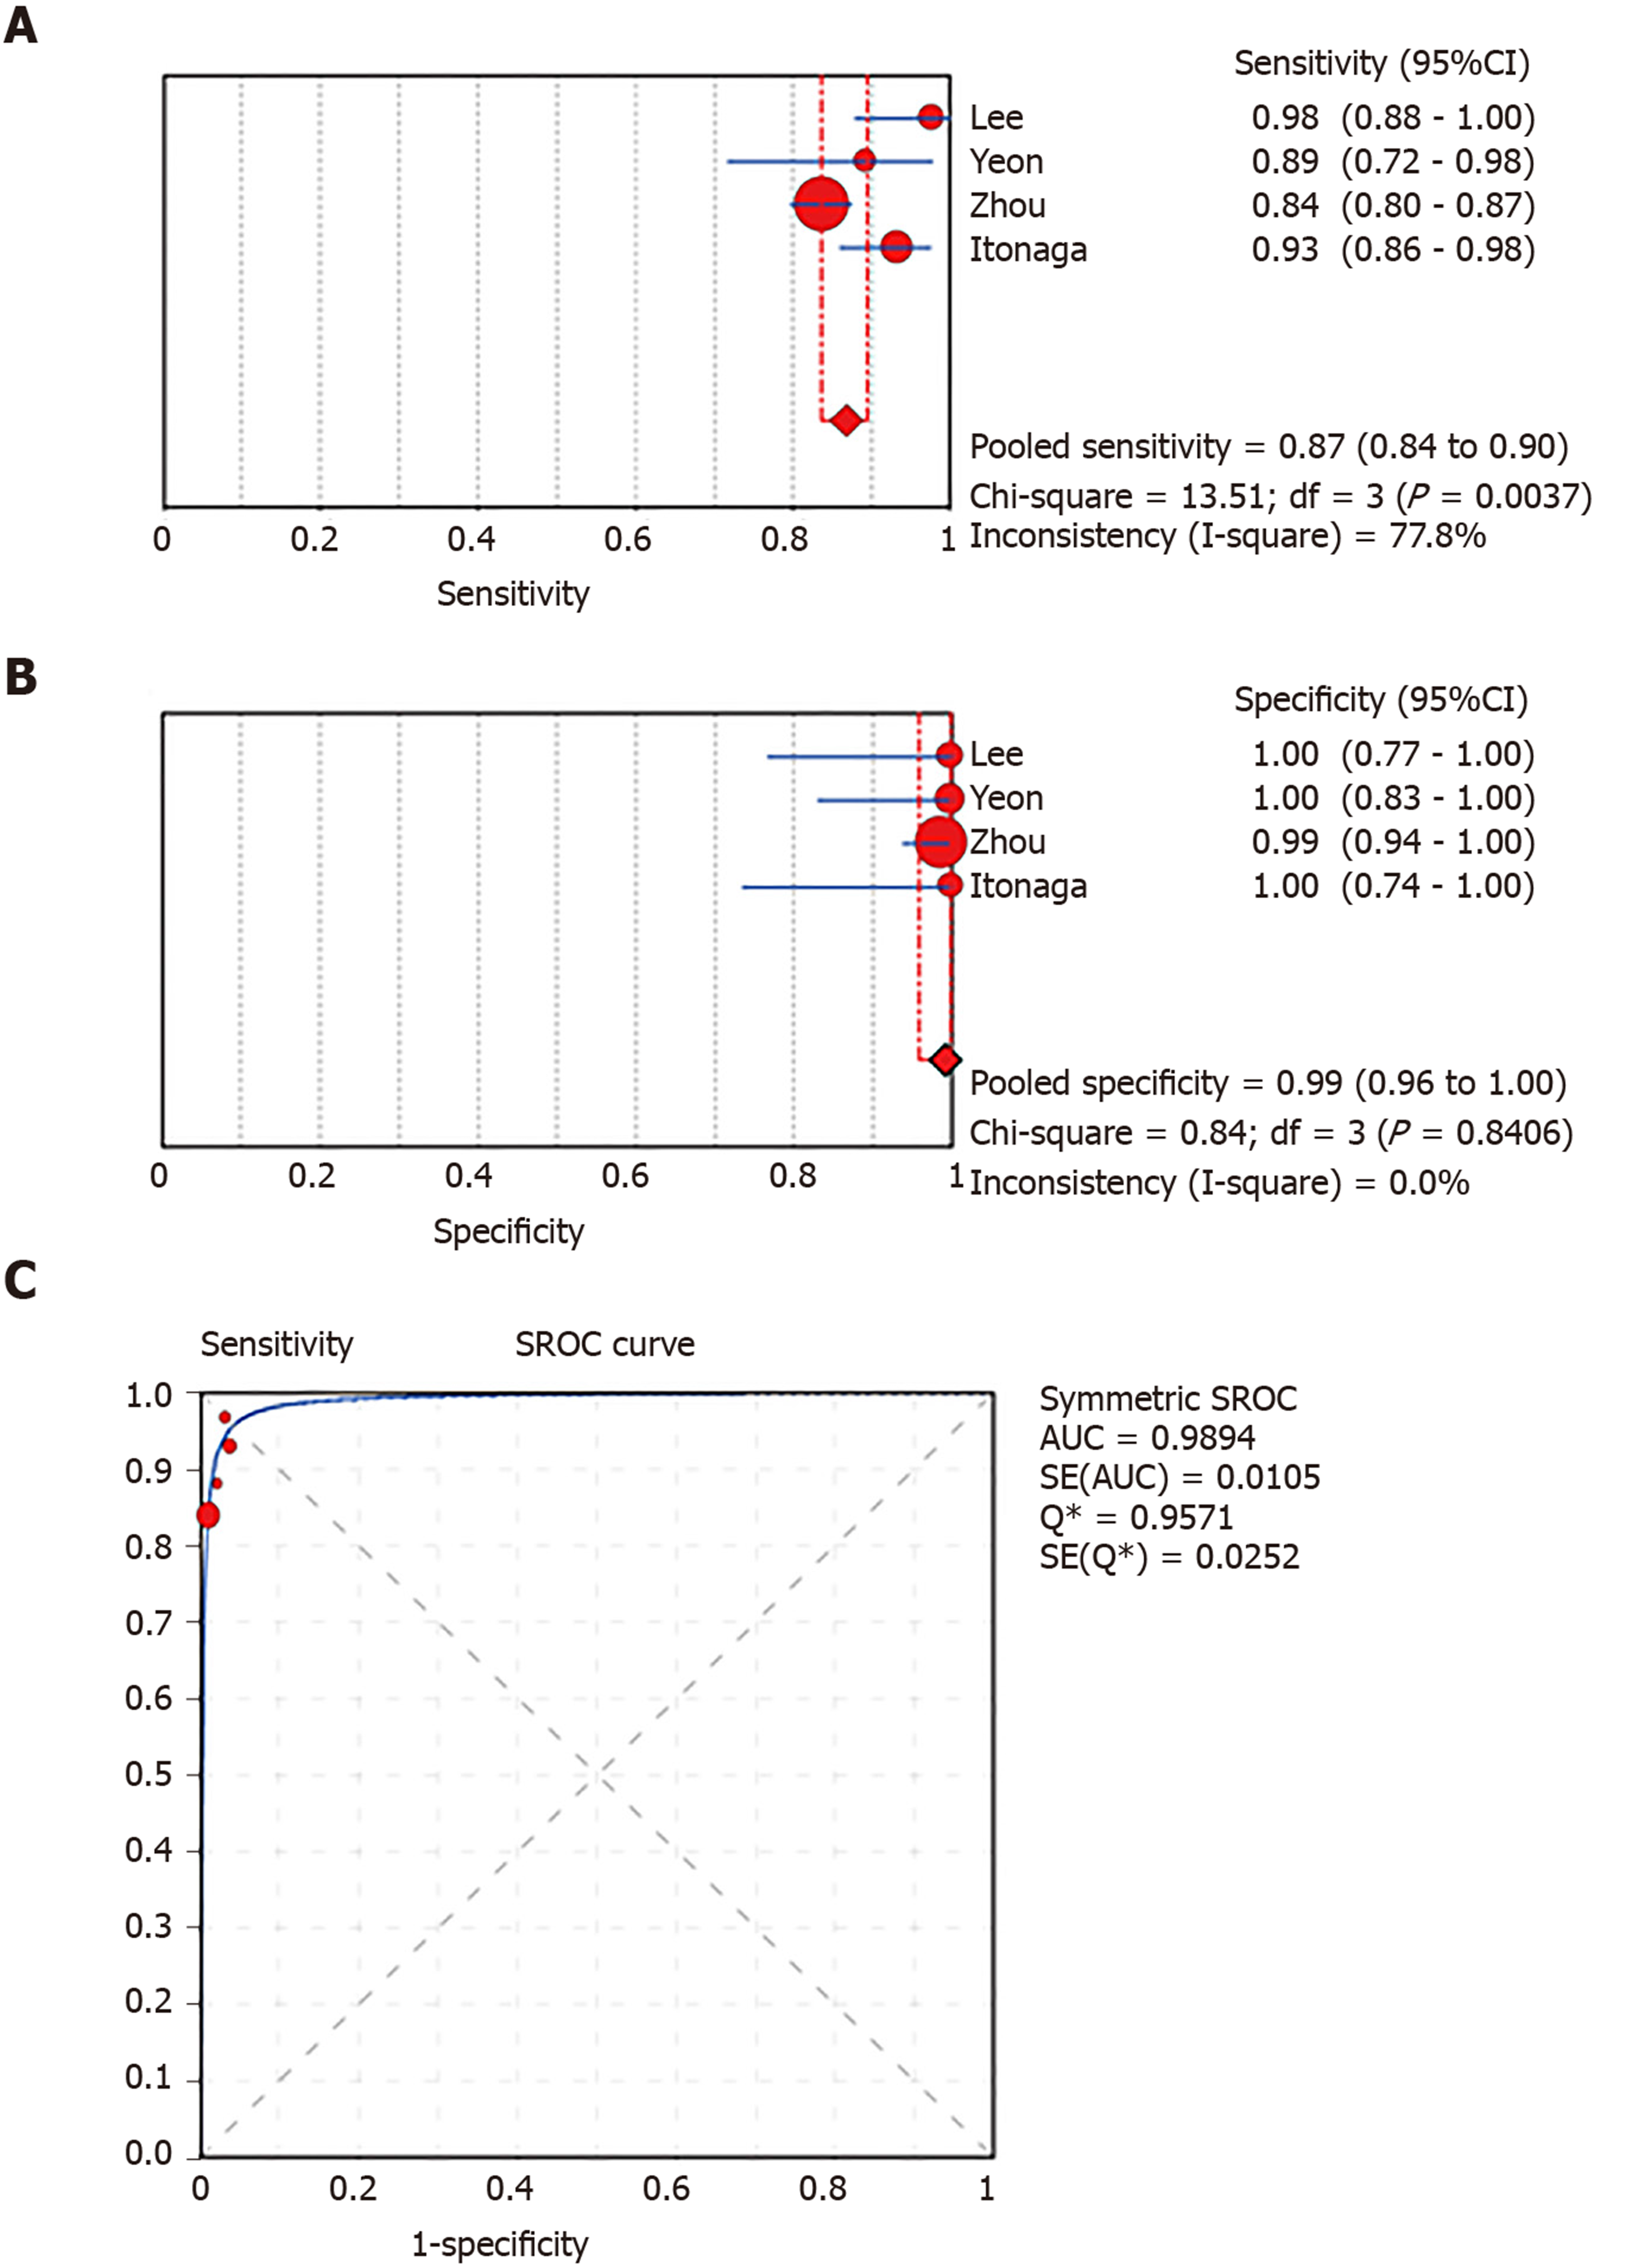
Figure 6 Forest plots of pooled sensitivity and specificity and summary receiver operating characteristic (SROC) curve of combined liquid-based cytology and smear cytology.
A: Sensitivity; B: Specificity; C: SROC curve.
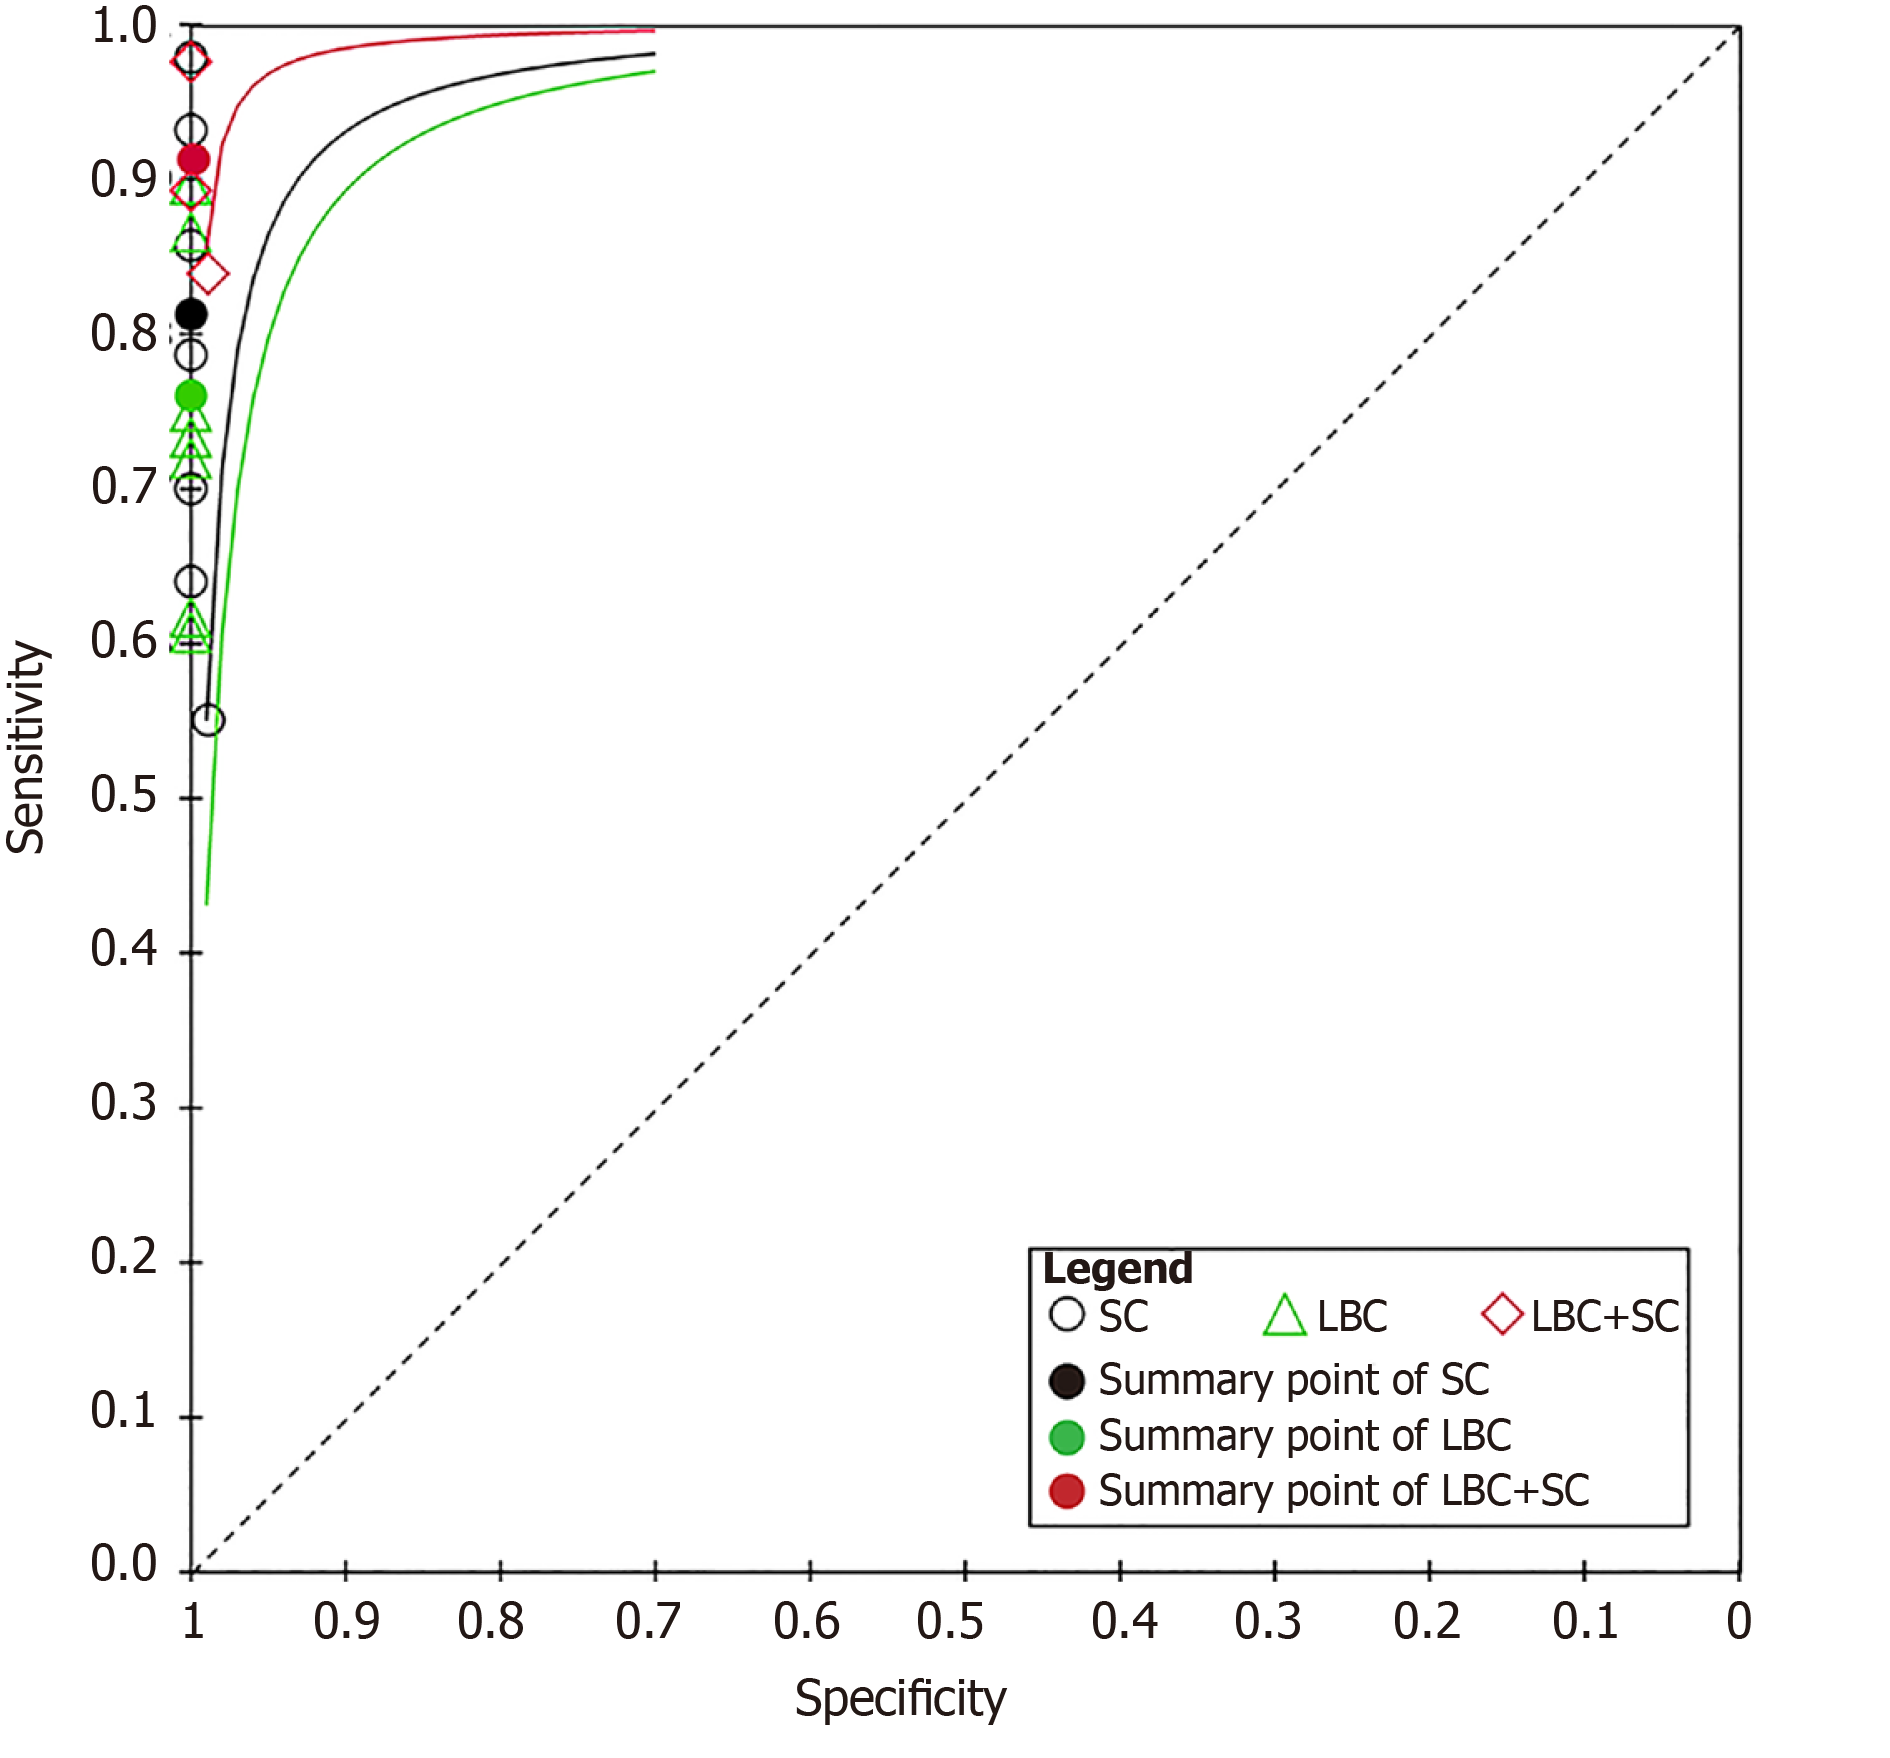
Figure 7 Corresponding summary receiver operating characteristic curves of the studies using smear cytology, liquid-based cytology, and combined liquid-based cytology and smear cytology.
LBC: Liquid-based cytology; SC: Smear cytology.
- Citation: Pan HH, Zhou XX, Zhao F, Chen HY, Zhang Y. Diagnostic value of liquid-based cytology and smear cytology in pancreatic endoscopic ultrasound-guided fine needle aspiration: A meta-analysis. World J Clin Cases 2020; 8(14): 3006-3020
- URL: https://www.wjgnet.com/2307-8960/full/v8/i14/3006.htm
- DOI: https://dx.doi.org/10.12998/wjcc.v8.i14.3006


