Copyright
©The Author(s) 2020.
World J Clin Cases. Jun 26, 2020; 8(12): 2574-2584
Published online Jun 26, 2020. doi: 10.12998/wjcc.v8.i12.2574
Published online Jun 26, 2020. doi: 10.12998/wjcc.v8.i12.2574
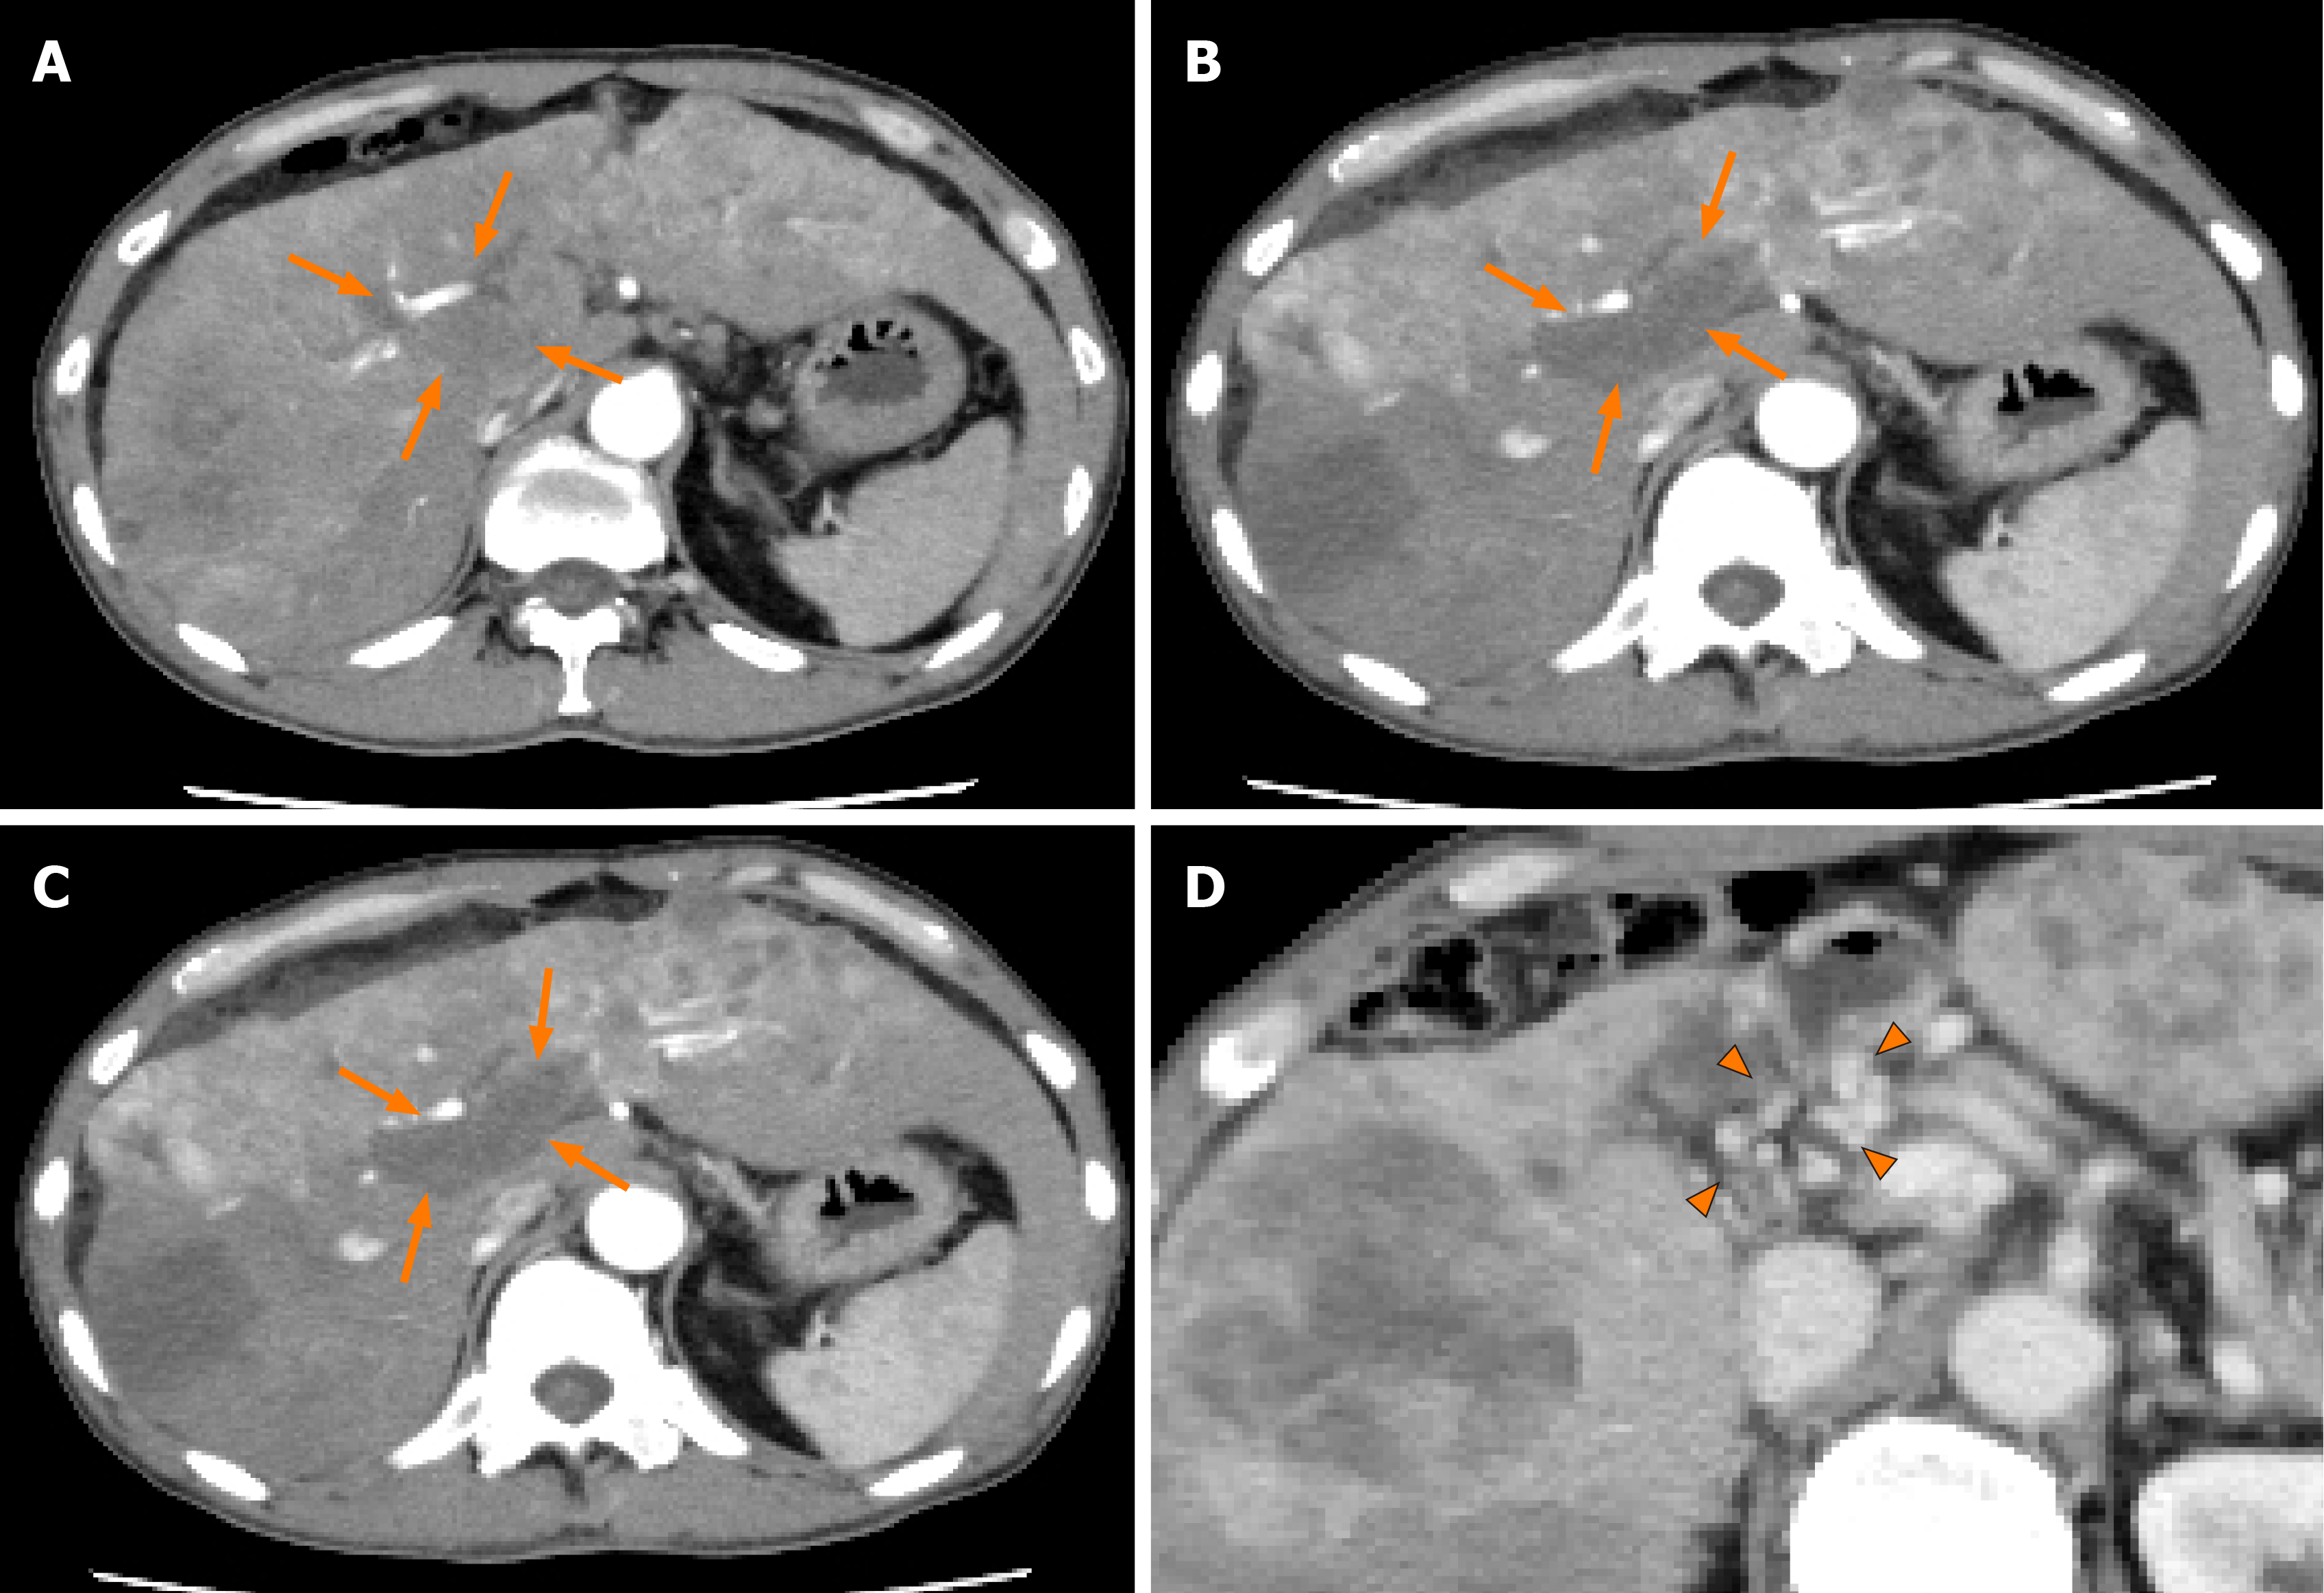
Figure 1 Dynamic contrast-enhanced computed tomography findings of the tumor thrombus in the main portal vein in case 1.
A: Arterial-phase computed tomography (CT) image prior to the start of lenvatinib administration showing marked vascularity of the hepatocellular carcinomas (HCCs), and a tumor thrombus in the main portal vein (arrows); B: Arterial-phase CT image at 2 wk after the start of lenvatinib administration showing a marked decrease of the vascularity of both the HCCs and the tumor thrombus in the main portal vein (arrows); C: Arterial-phase CT image at 8 wk after the start of lenvatinib administration showing a continuous decrease of the vascularity of both the HCCs and the tumor thrombus in the main portal vein, and decrease of the size of the tumor thrombus in the main portal vein (arrows); and D: Portal-phase CT image at 14 wk after the start of lenvatinib administration showing collateral veins around the main portal vein (arrowheads).
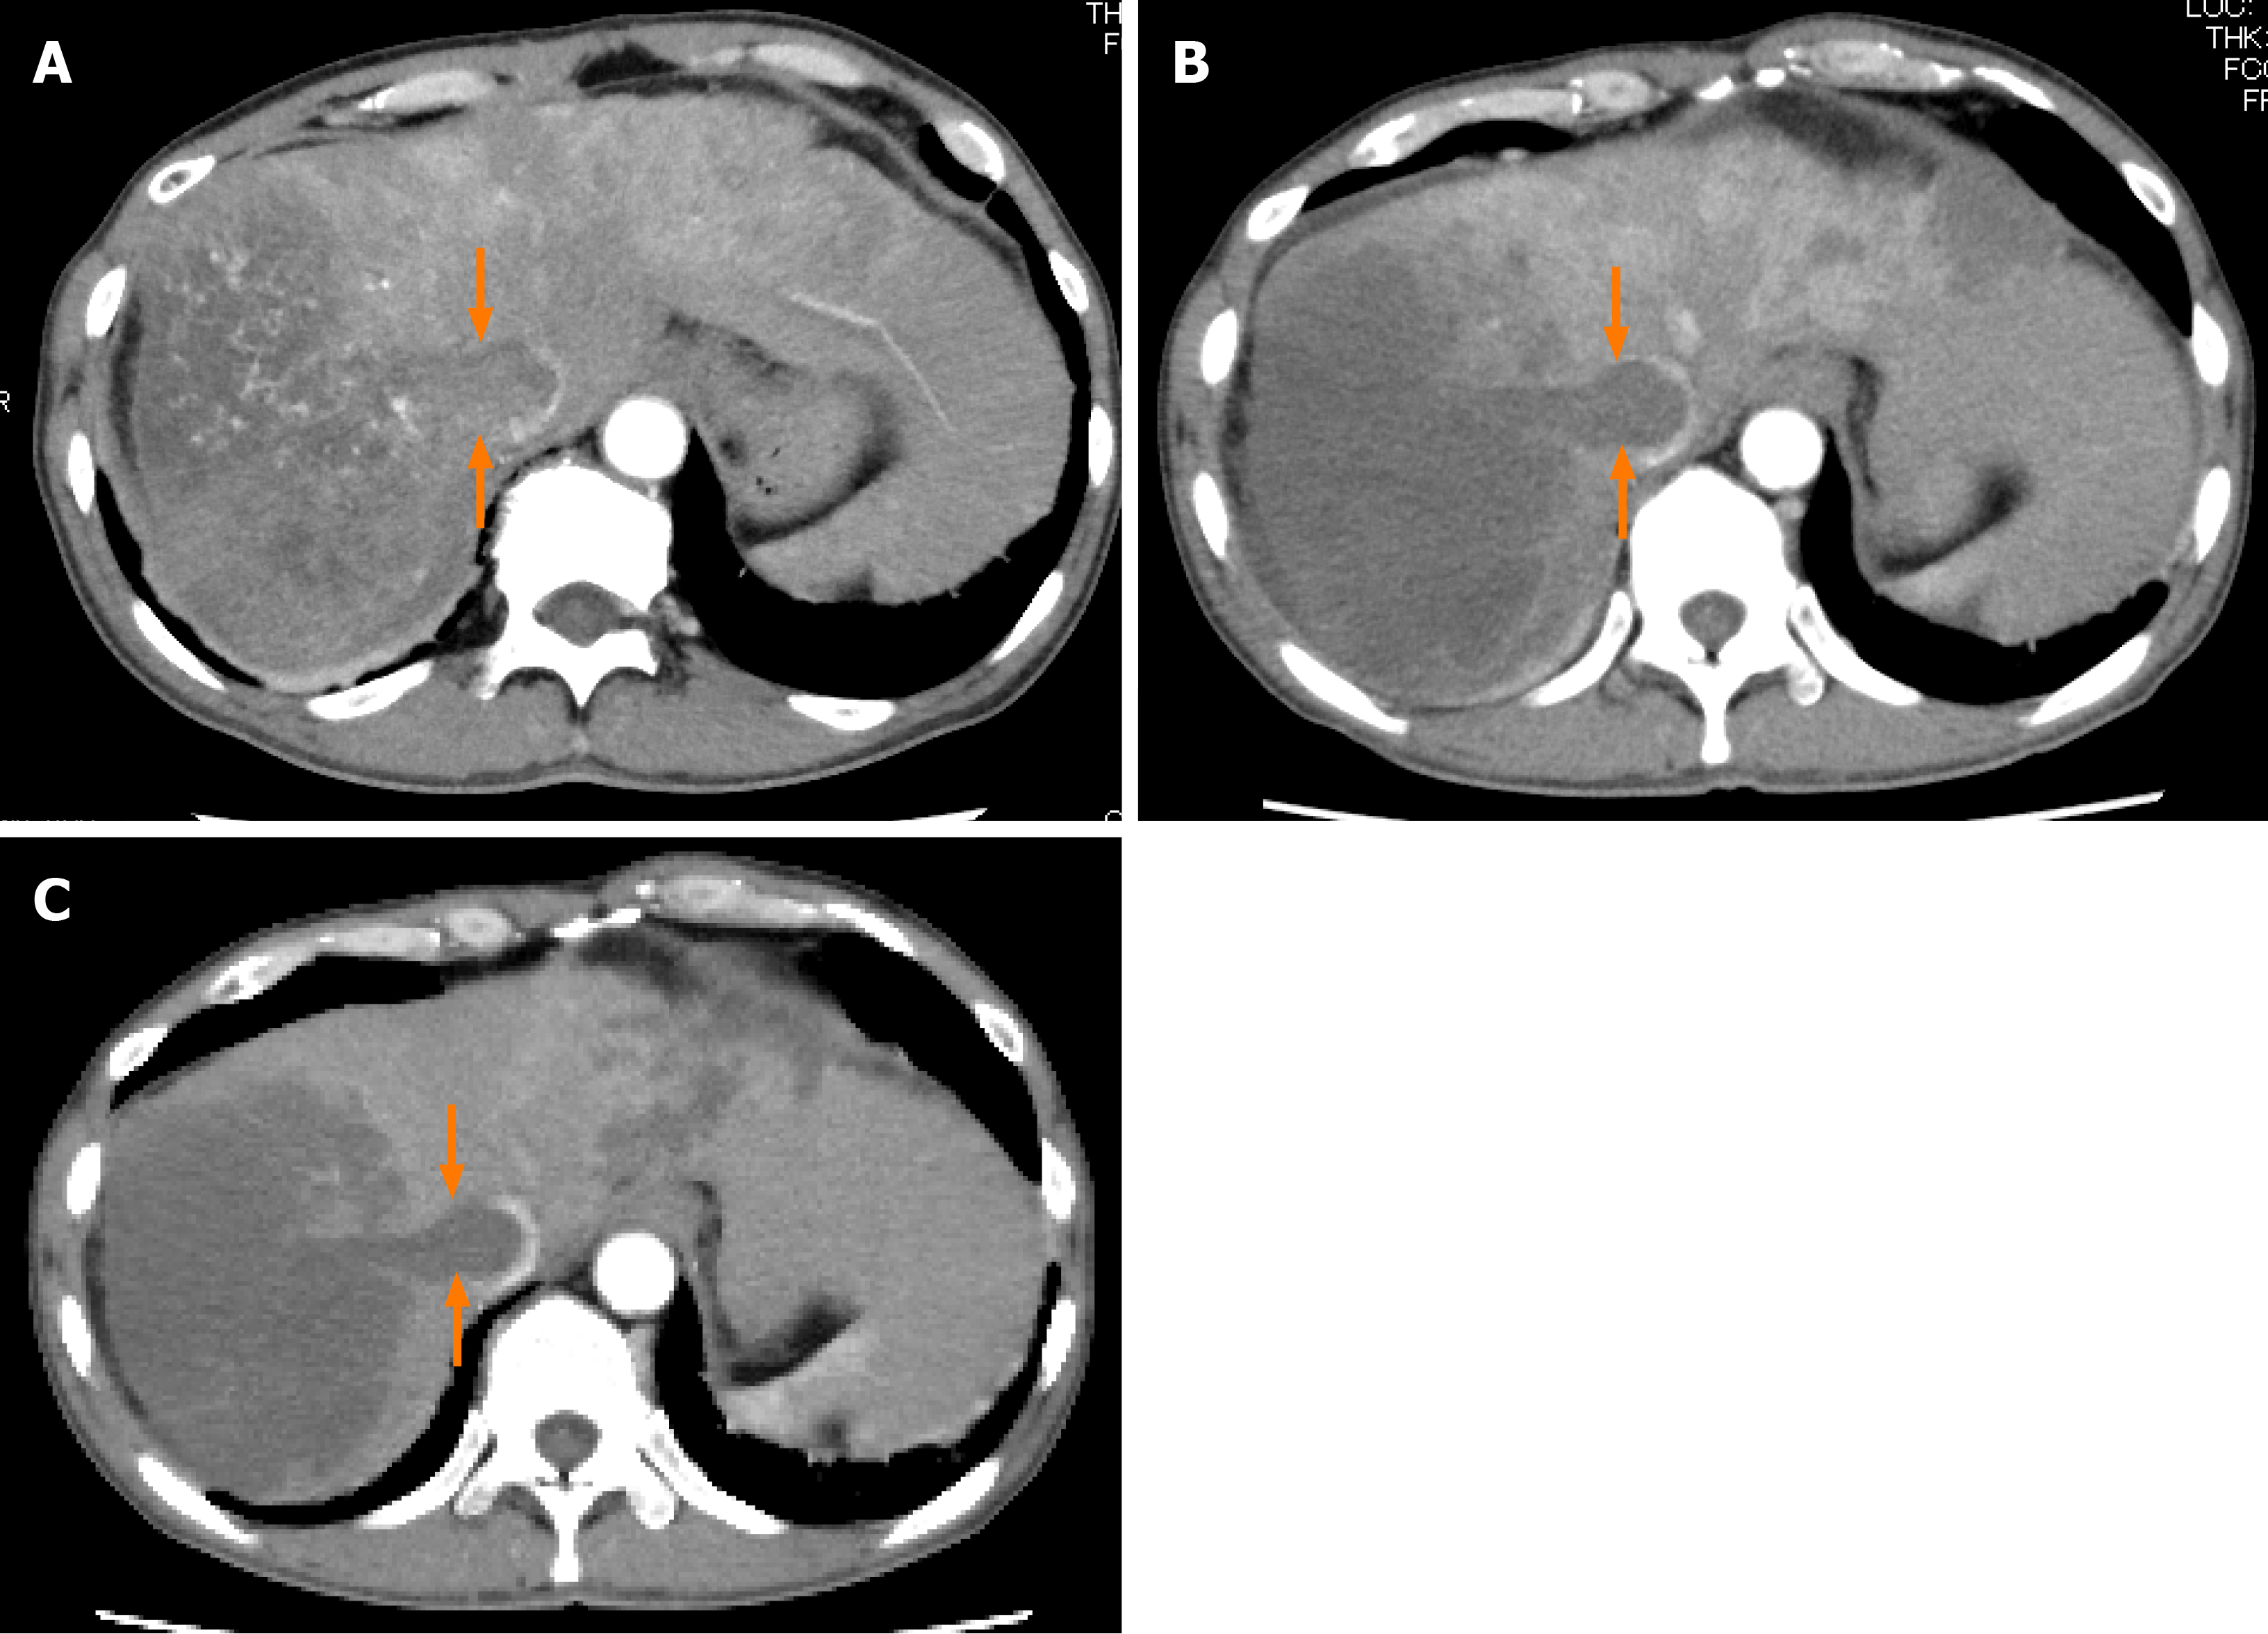
Figure 2 Dynamic contrast-enhanced computed tomography findings of a tumor thrombus in the inferior vena cava in case 1.
A: Arterial-phase computed tomography (CT) image prior to the start of lenvatinib administration showing marked vascularity of the tumor thrombus in the inferior vena cava (arrows); B: Arterial-phase CT image at 2 wk after the start of lenvatinib administration showing the tumor thrombus in the inferior vena cava (arrows); and C: Arterial-phase CT image at 8 wk after the start of lenvatinib administration showing the tumor thrombus in the inferior vena cava (arrows).
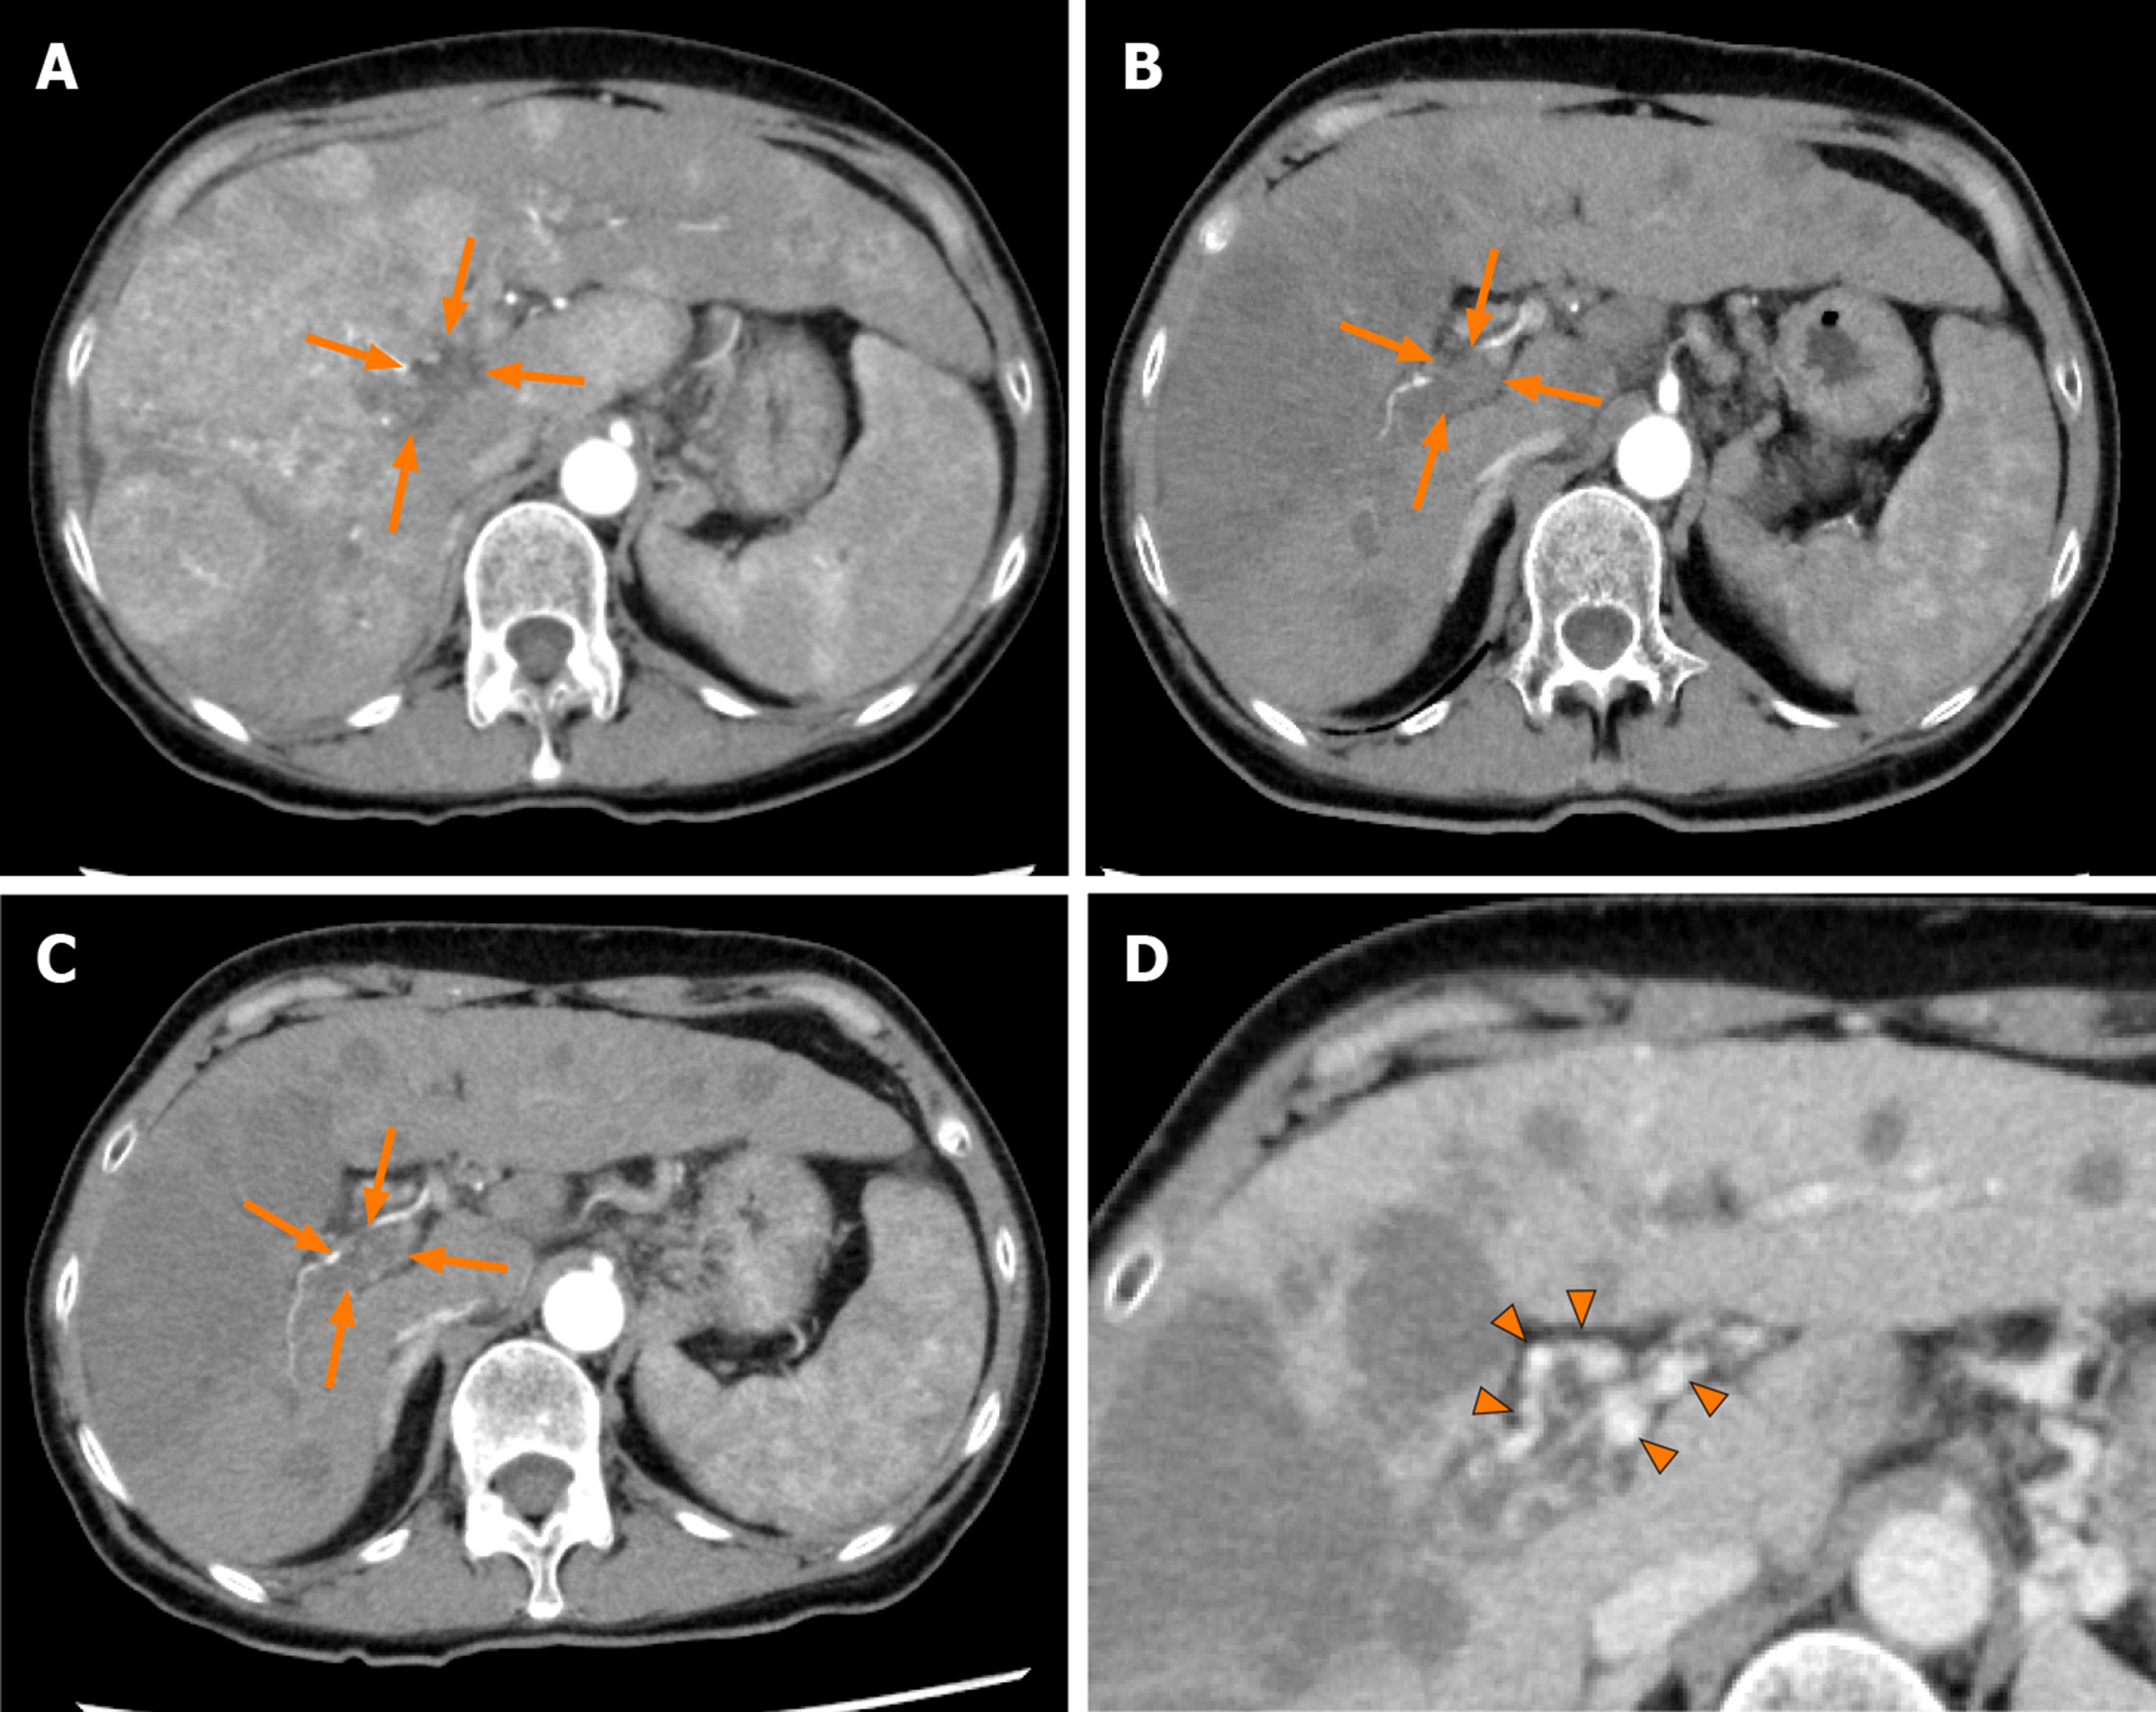
Figure 3 Dynamic contrast-enhanced computed tomography findings of the tumor thrombus in the main portal vein in case 2.
A: Arterial-phase computed tomography (CT) image prior to the start of lenvatinib administration showing marked vascularity of the hepatocellular carcinomas, and a tumor thrombus in the main portal vein (arrows); B: Arterial-phase CT image at 4 wk after the start of lenvatinib administration showing a marked decrease of the vascularity of the hepatocellular carcinomas and decrease of the size of the tumor thrombus in the main portal vein (arrows); C: Arterial-phase CT image at 9 wk after the start of lenvatinib administration showing a continuous decrease of the vascularity of both the hepatocellular carcinomas and the size of the tumor thrombus in the main portal vein (arrows); and D: Portal-phase CT image at 9 wk after the start of lenvatinib administration showing collateral veins around the main portal vein (arrowheads).
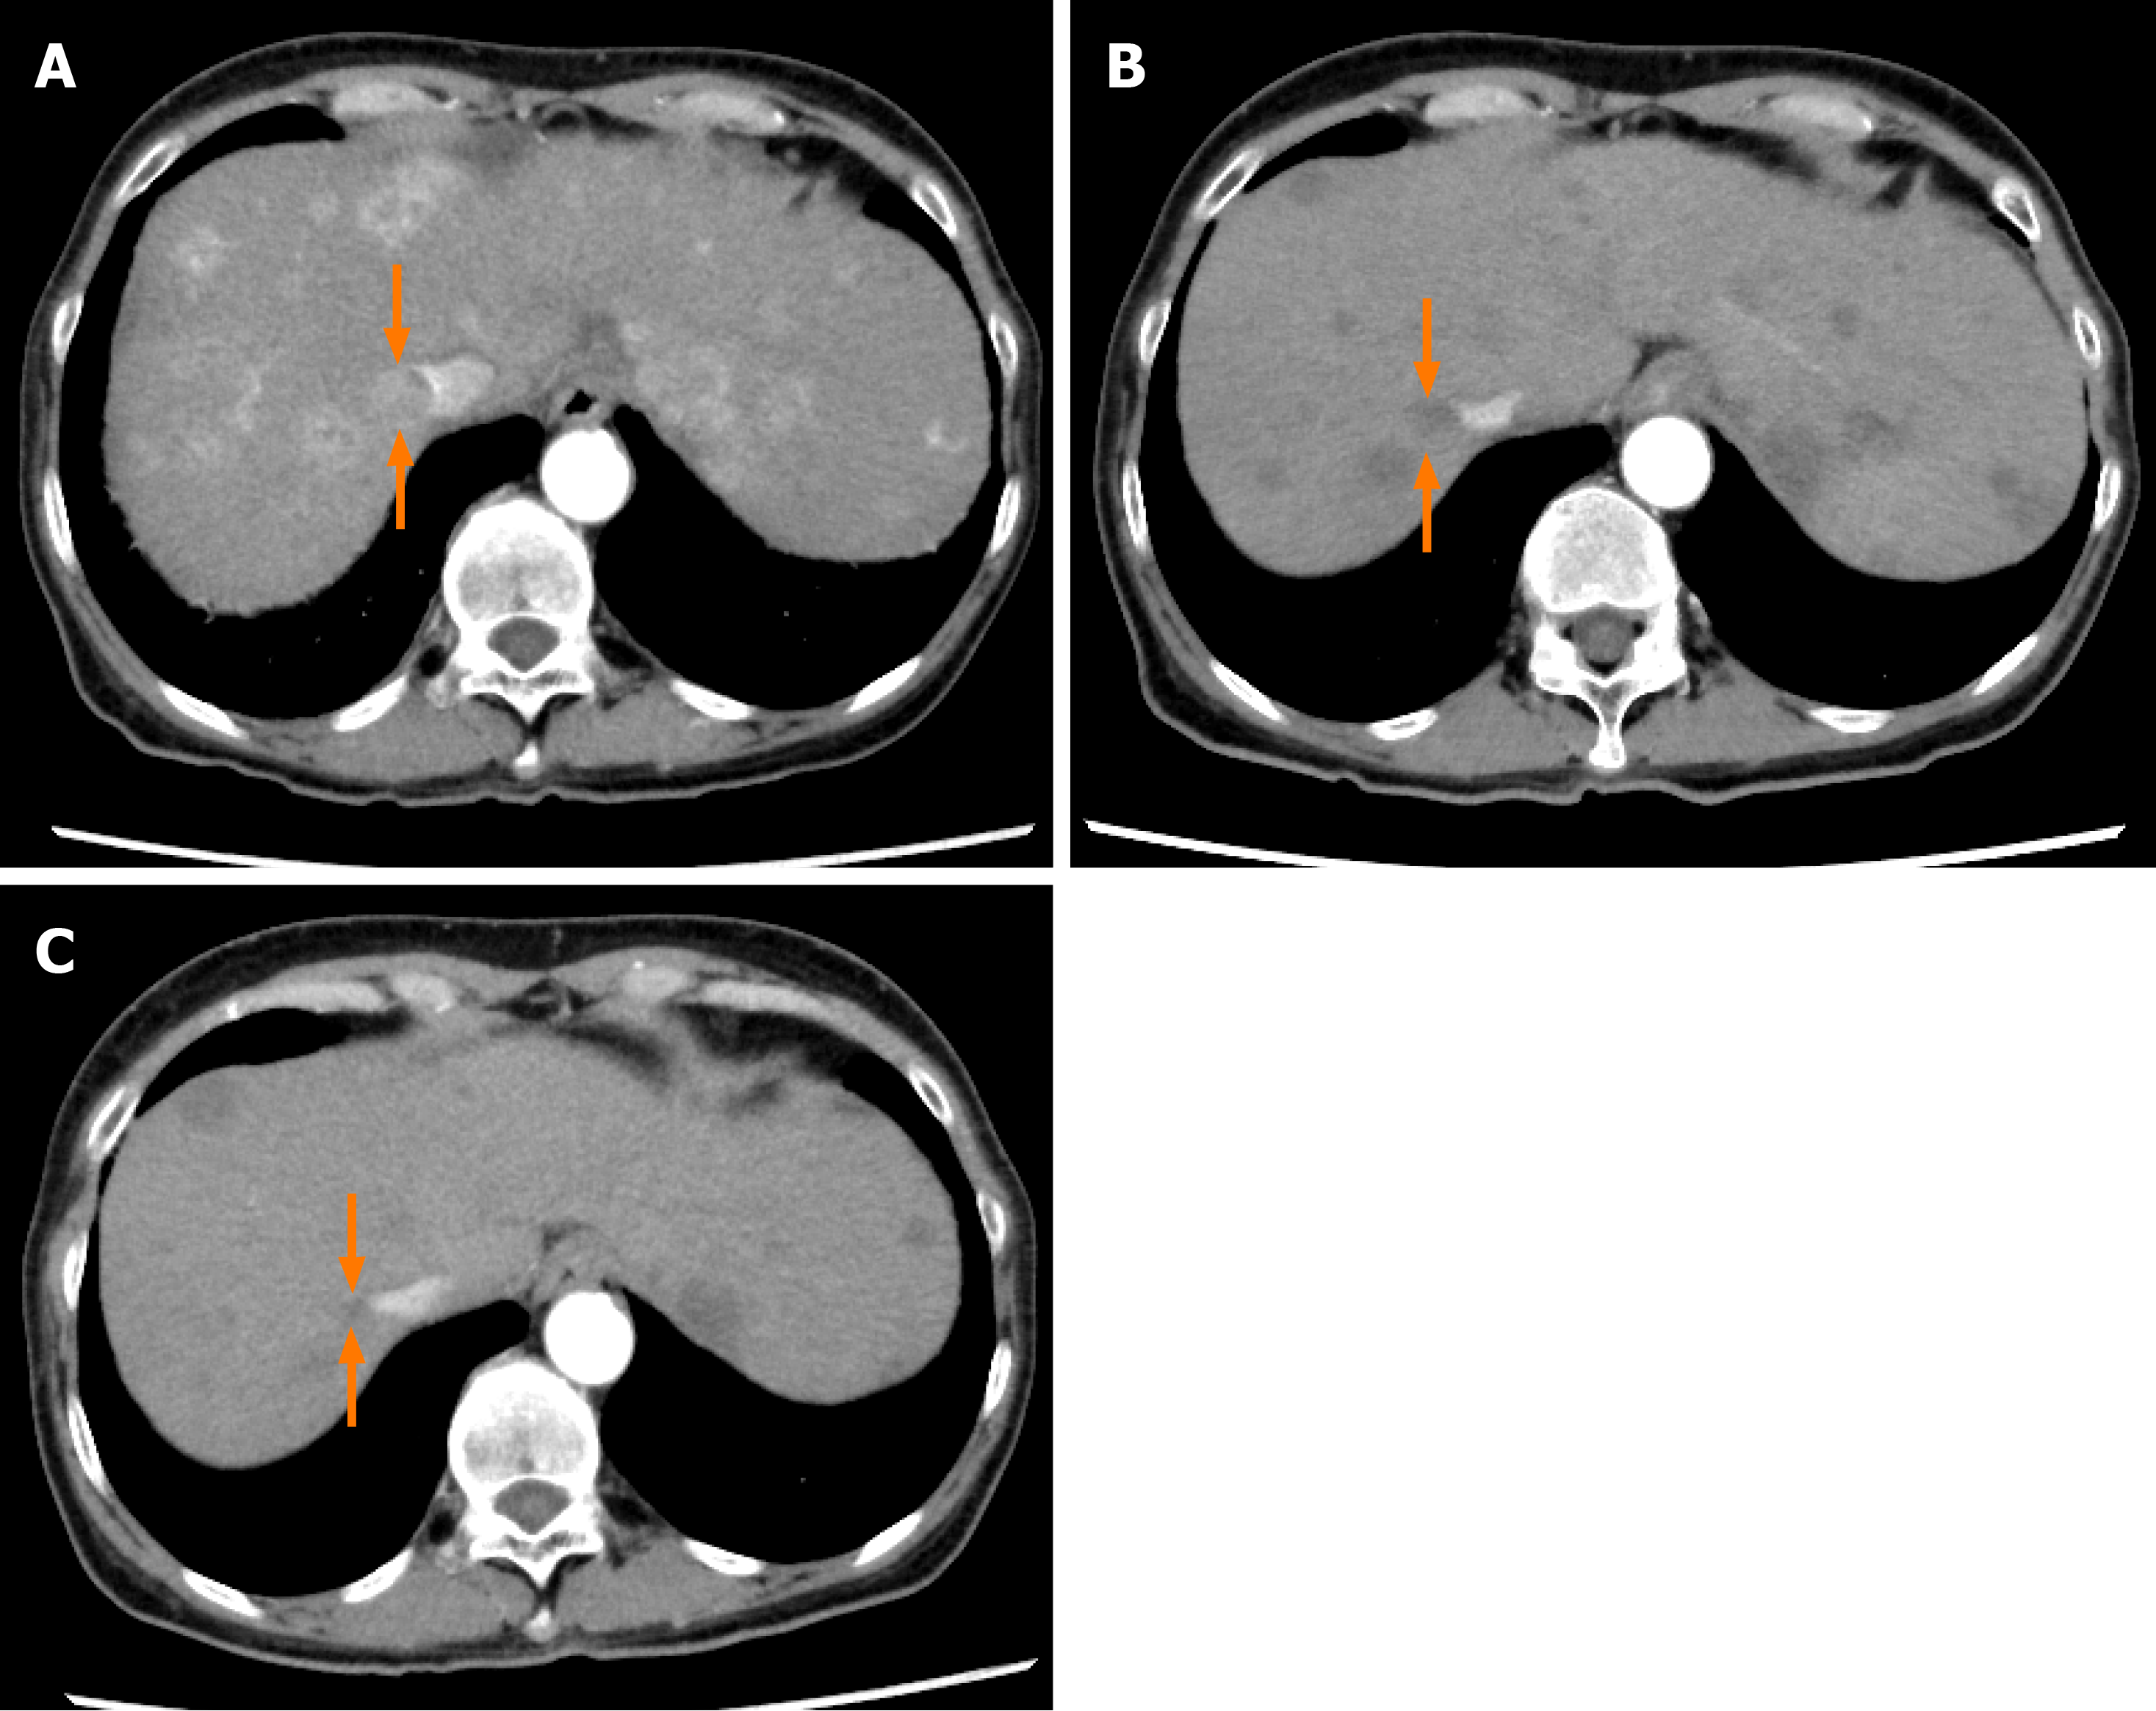
Figure 4 Dynamic contrast-enhanced computed tomography findings of a tumor thrombus in the inferior vena cava in case 2.
A: Arterial-phase computed tomography (CT) image prior to the start of lenvatinib administration showing a tumor thrombus in the inferior vena cava (arrows); B: Arterial-phase CT image at 4 wk after the start of lenvatinib administration showing a marked decrease in both the vascularity and the size of the tumor thrombus in the inferior vena cava (arrows); and C: Arterial-phase CT image at 9 wk after the start of lenvatinib administration showing a continuous decrease in both the vascularity and the size of the tumor thrombus in the inferior vena cava (arrows).
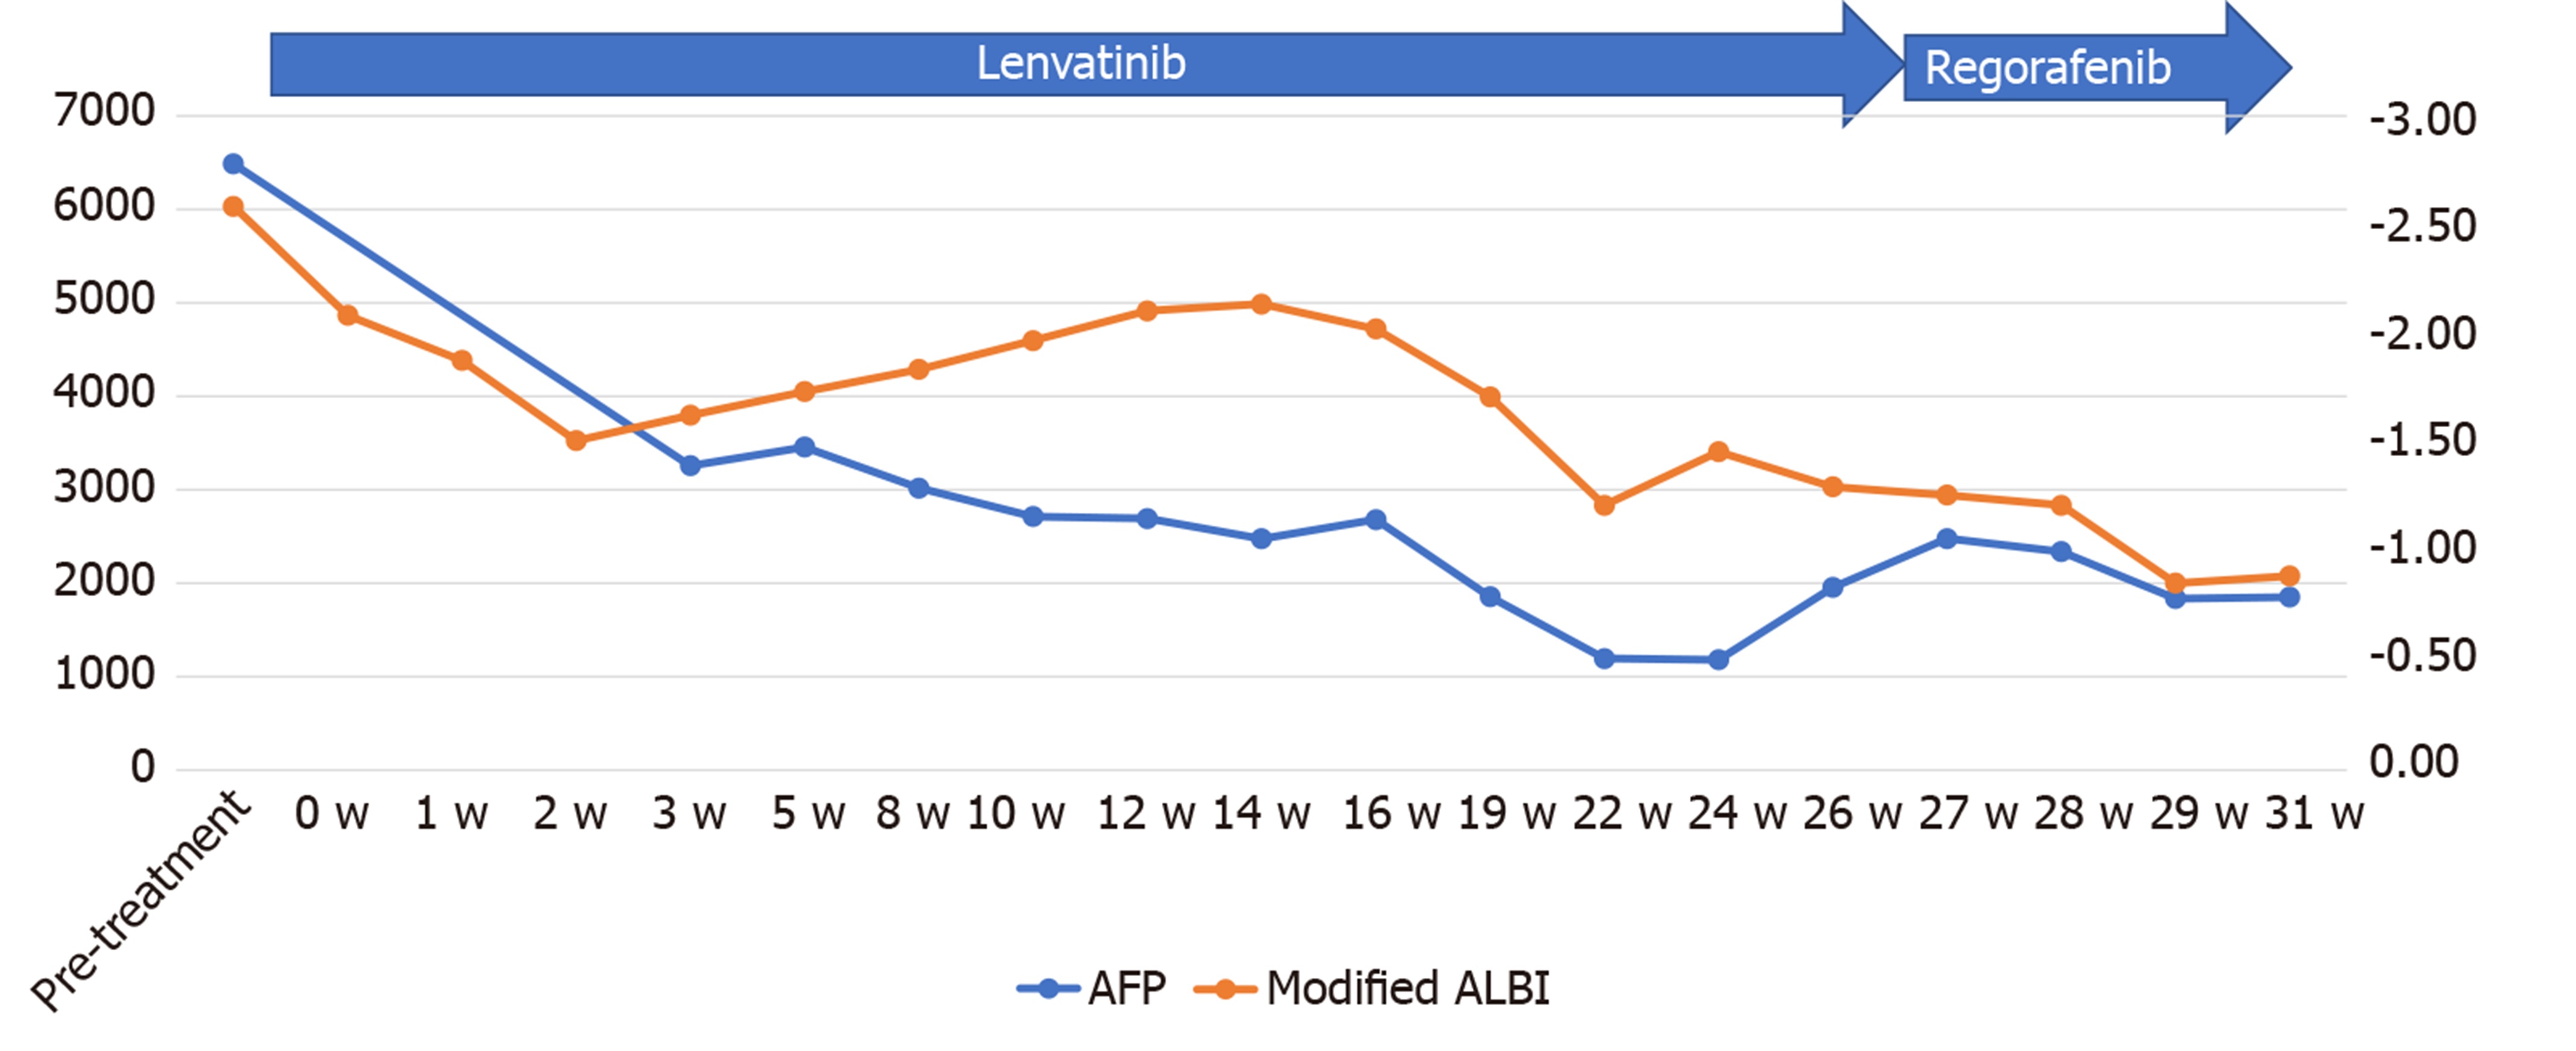
Figure 5 Time course of the serum alpha-fetoprotein and modified albumin–bilirubin score during chemotherapy in case 1.
The serum alpha-fetoprotein level began to decrease soon after the start of lenvatinib administration and continued to decrease until 24 wk after the start of administration, after which it began to rise again, which possibly reflected the therapeutic response, according to the modified Response Evaluation Criteria in Solid Tumors, of progressive disease, at 6 mo after the start of lenvatinib administration. The modified albumin–bilirubin score improved, after initial worsening for up to 2 wk after the start of lenvatinib administration but showed peak worsening again at 14 wk after the start of lenvatinib administration. AFP: Alpha-fetoprotein; ALBI: Albumin–bilirubin.
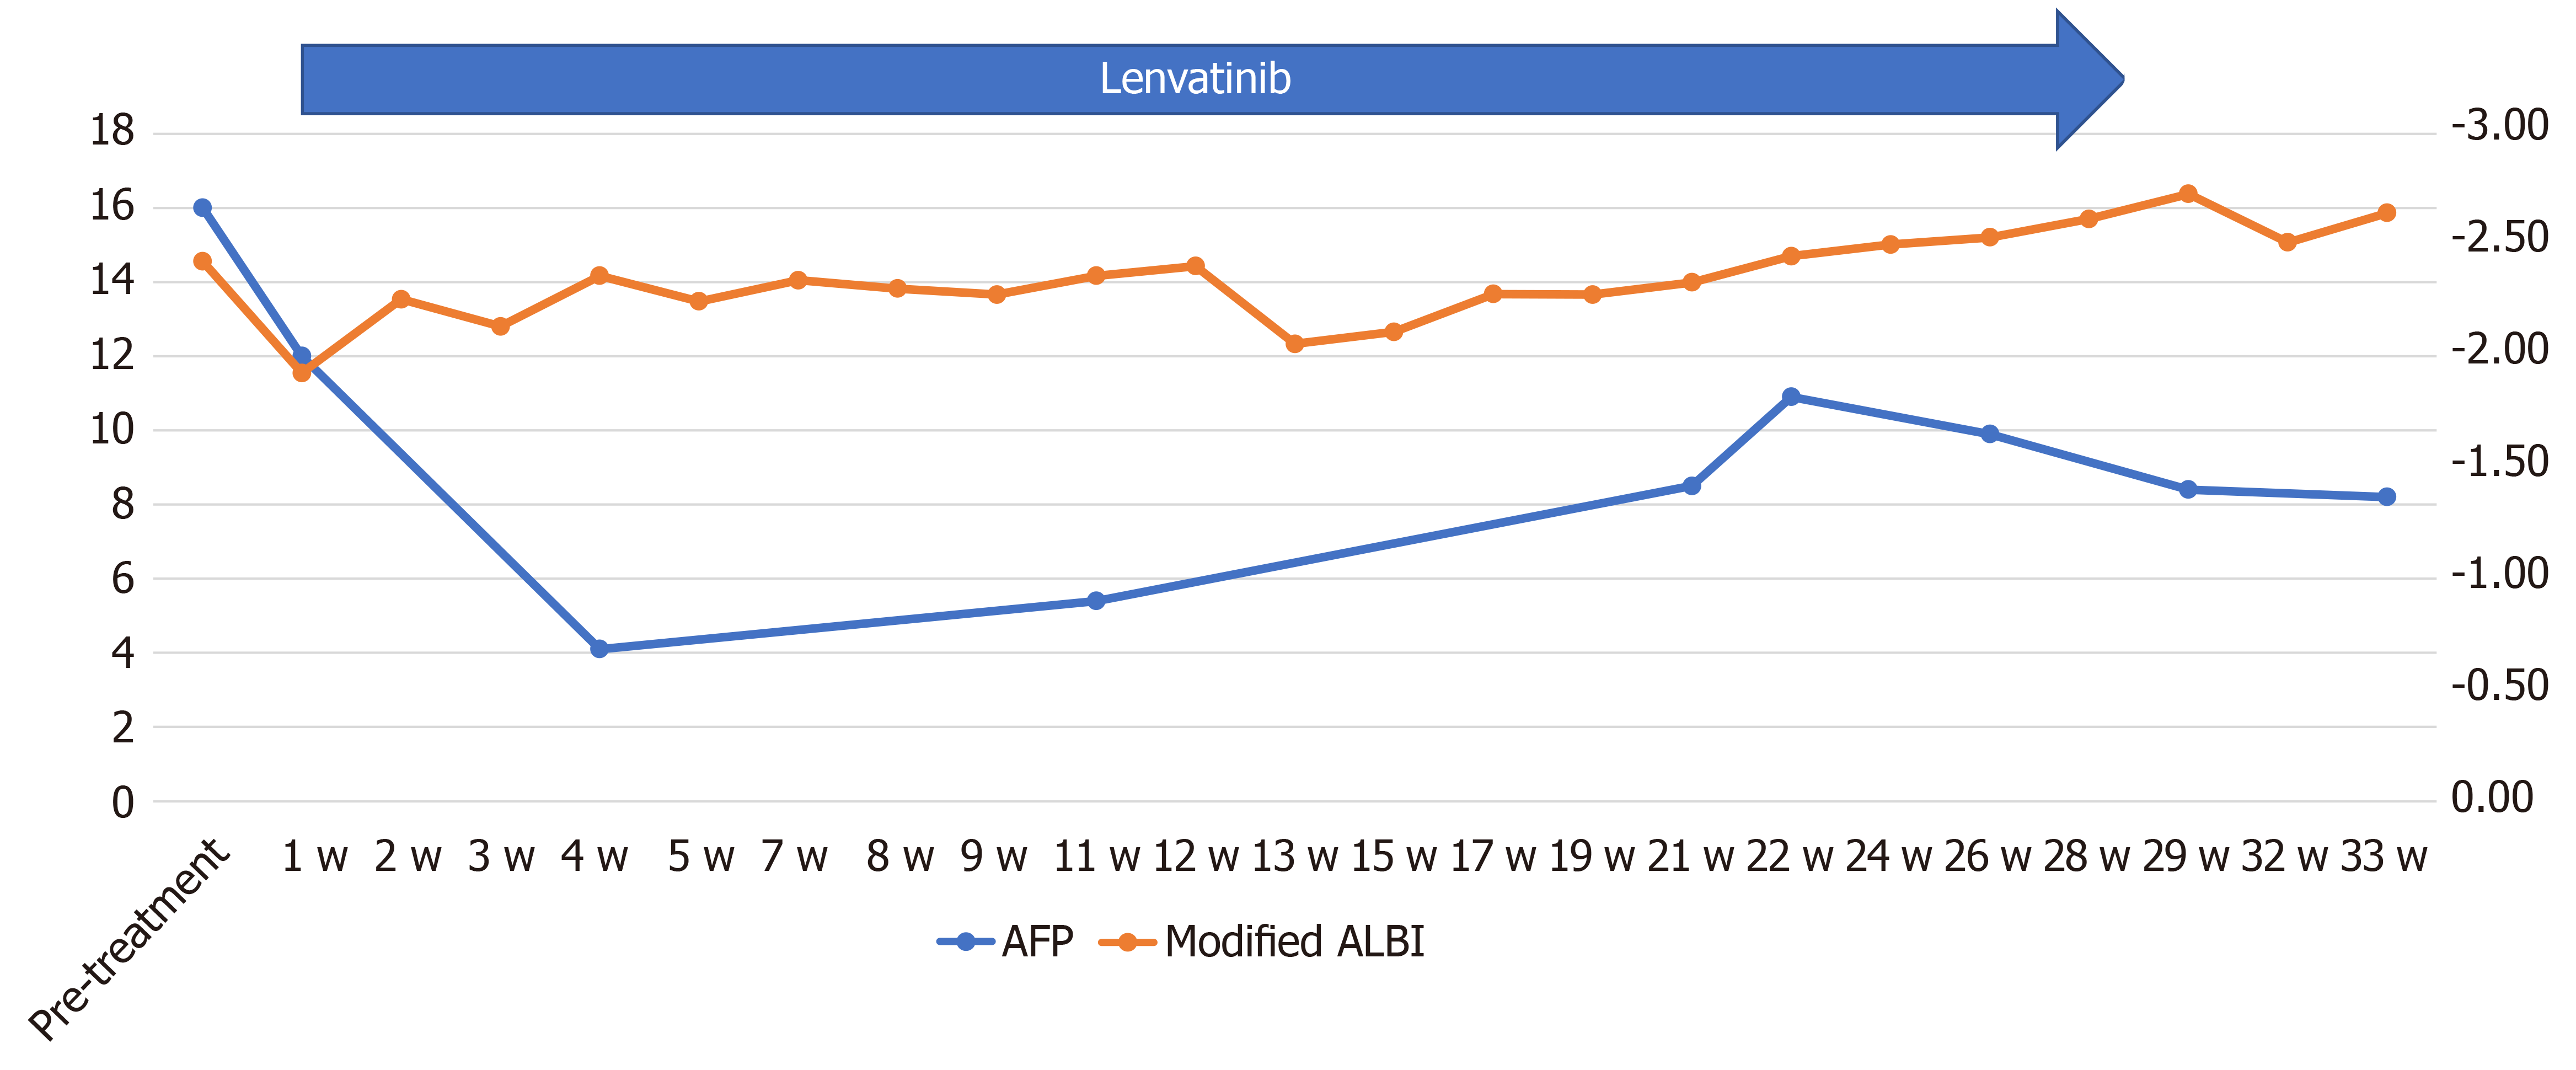
Figure 6 Time course of the serum alpha-fetoprotein and modified albumin–bilirubin score during chemotherapy in case 2.
The serum alpha-fetoprotein level decreased to normal at 2 wk after the start of administration, with no apparent subsequent rise. The modified albumin–bilirubin score improved, after initial worsening for up to 2 wk after the start of lenvatinib administration but recovered to improve at 5 wk after the treatment. AFP: Alpha-fetoprotein; ALBI: Albumin–bilirubin.
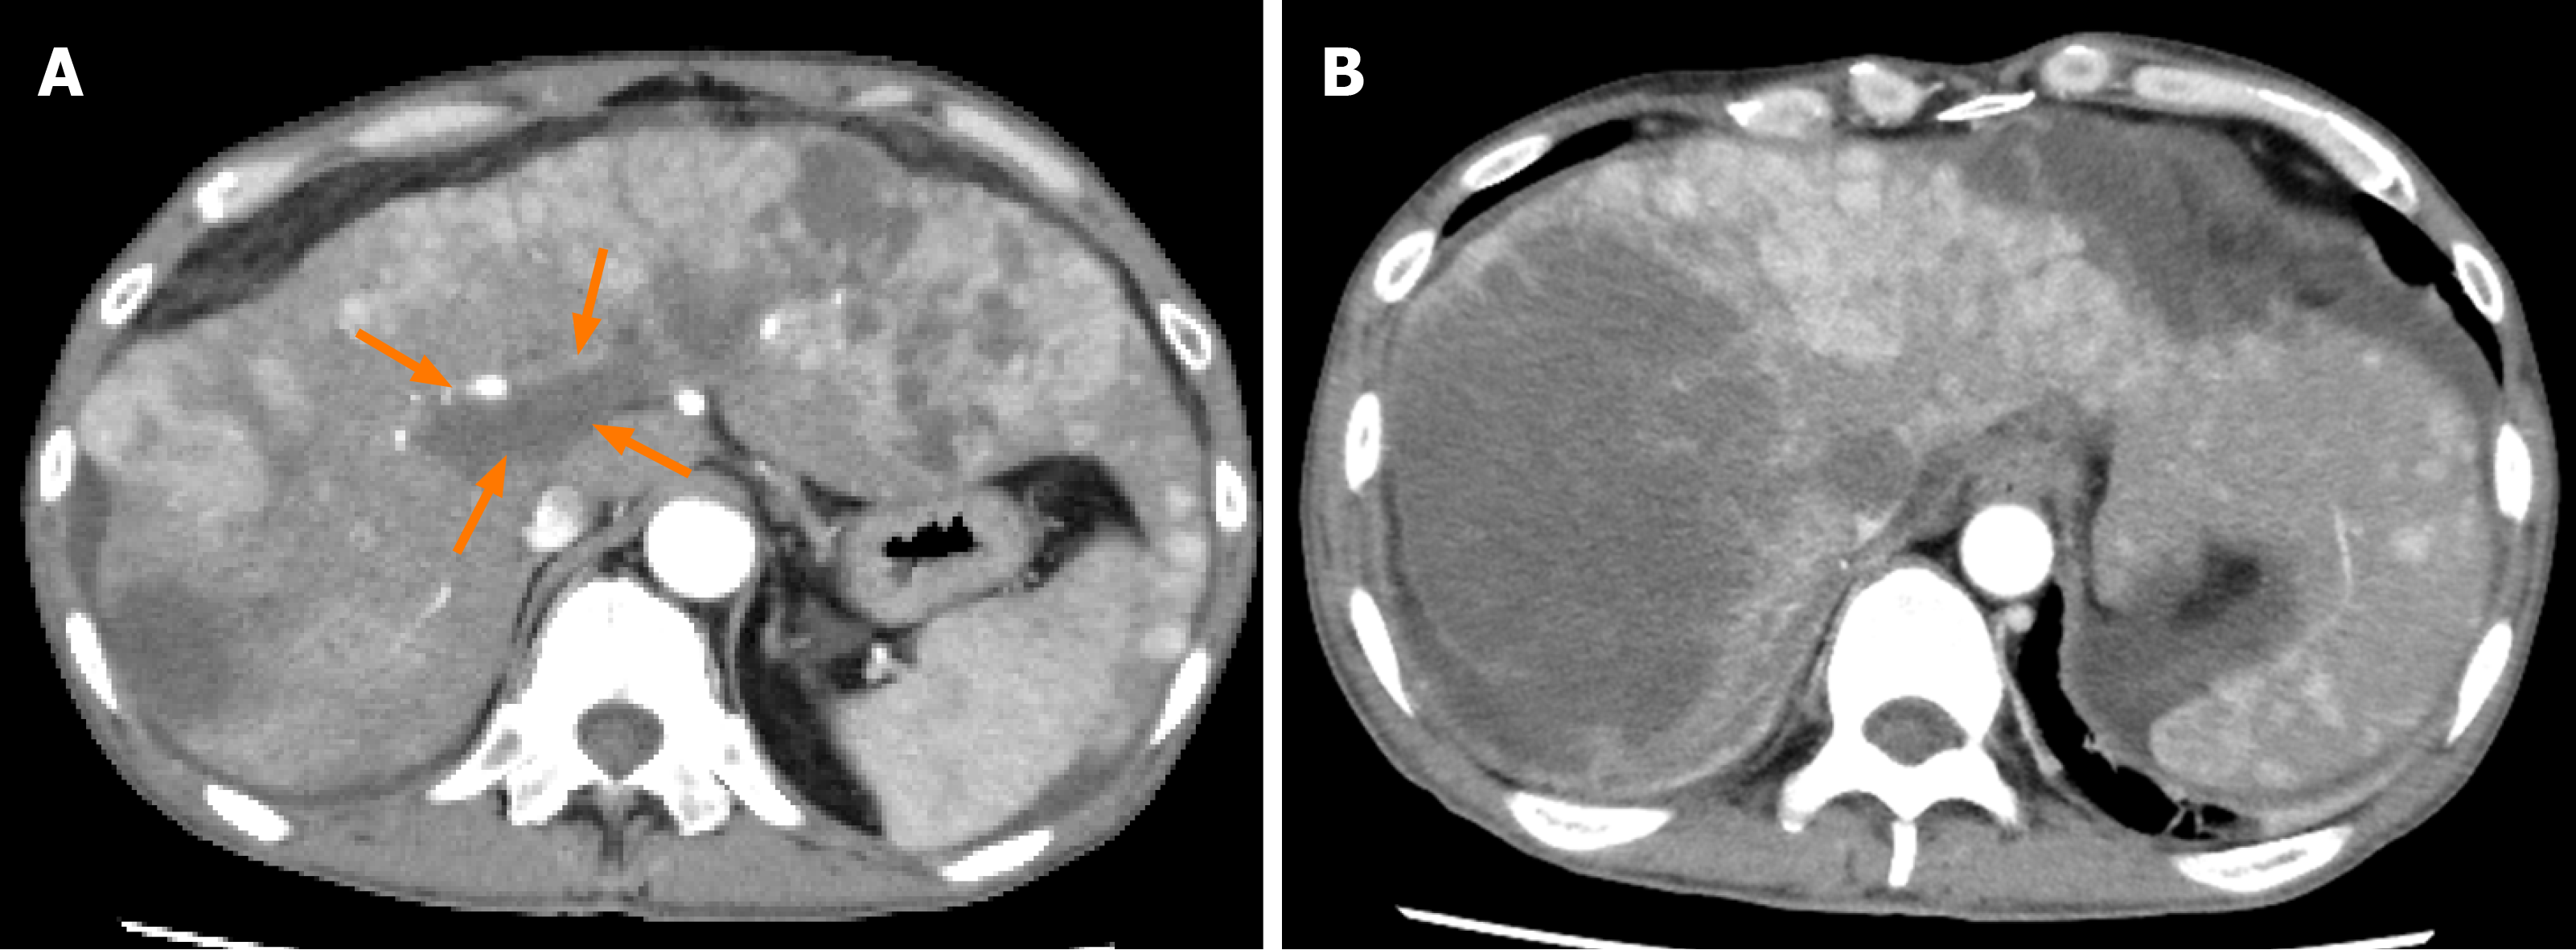
Figure 7 Dynamic contrast-enhanced computed tomography findings at 6 mo after lenvatinib administration in case 1.
A, B: Arterial-phase computed tomography image at 6 mo after the start of lenvatinib administration showing newly developed intrahepatic metastases and a tumor growth of the hepatocellular carcinomas and no obvious change in the size of the tumor thrombus in the main portal vein (arrows) (A), and the emergence of ascites around the liver were observed (B).
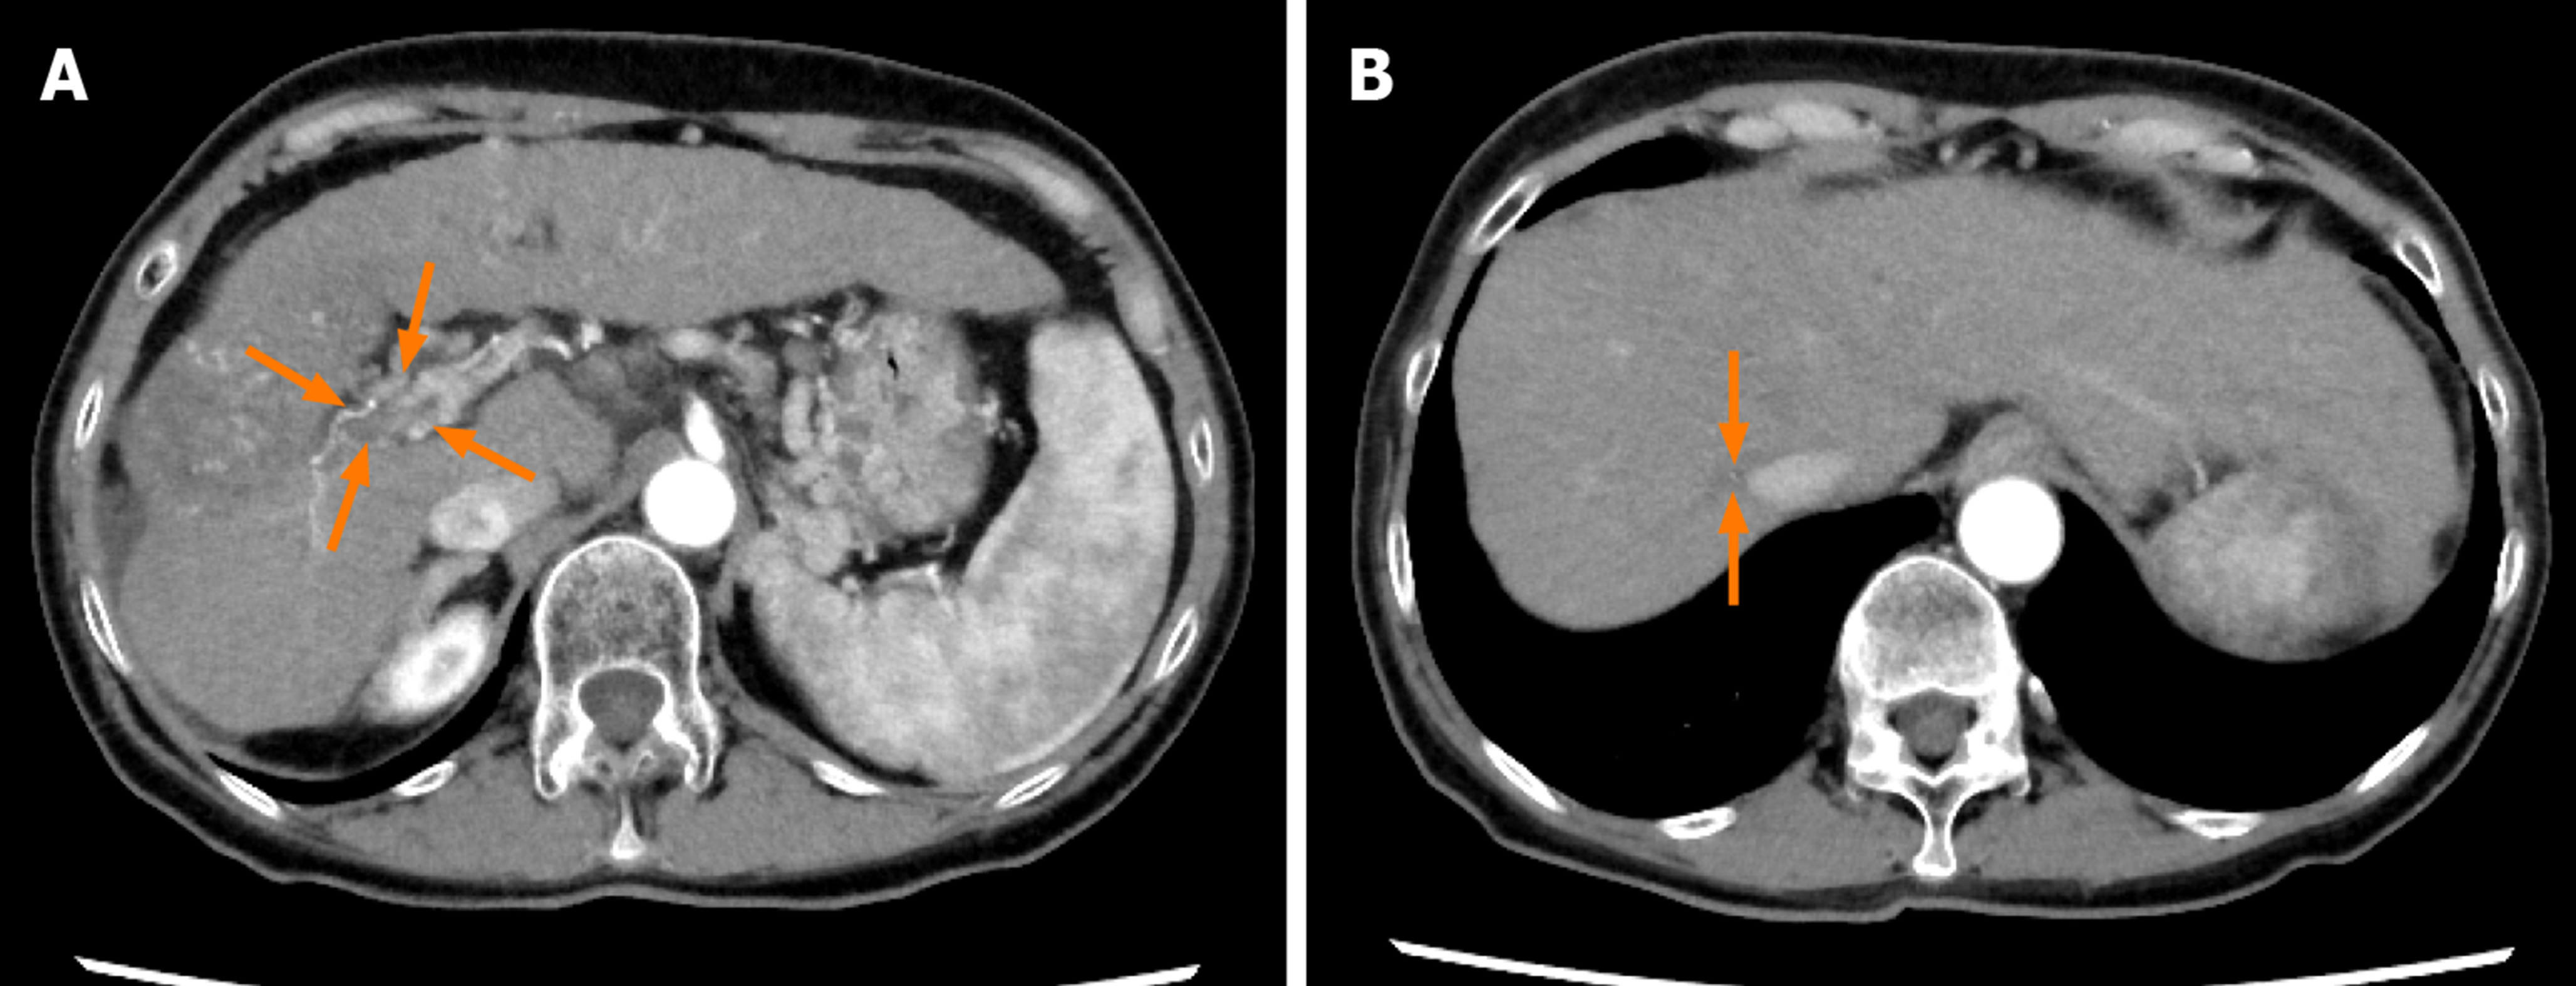
Figure 8 Dynamic contrast-enhanced computed tomography findings at 80 wk after lenvatinib administration in case 2.
A and B: Arterial-phase computed tomography image at 80 wk after the start of lenvatinib administration showing further decrease of the size of the hepatocellular carcinomas and the tumor thrombus in the main portal vein (arrows) (A) and further decrease of the size of the tumor thrombus in the inferior vena cava (arrows) (B).
- Citation: Komiyama S, Numata K, Moriya S, Fukuda H, Chuma M, Maeda S. Lenvatinib for large hepatocellular carcinomas with portal trunk invasion: Two case reports. World J Clin Cases 2020; 8(12): 2574-2584
- URL: https://www.wjgnet.com/2307-8960/full/v8/i12/2574.htm
- DOI: https://dx.doi.org/10.12998/wjcc.v8.i12.2574


