Copyright
©The Author(s) 2020.
World J Clin Cases. Jun 6, 2020; 8(11): 2399-2405
Published online Jun 6, 2020. doi: 10.12998/wjcc.v8.i11.2399
Published online Jun 6, 2020. doi: 10.12998/wjcc.v8.i11.2399
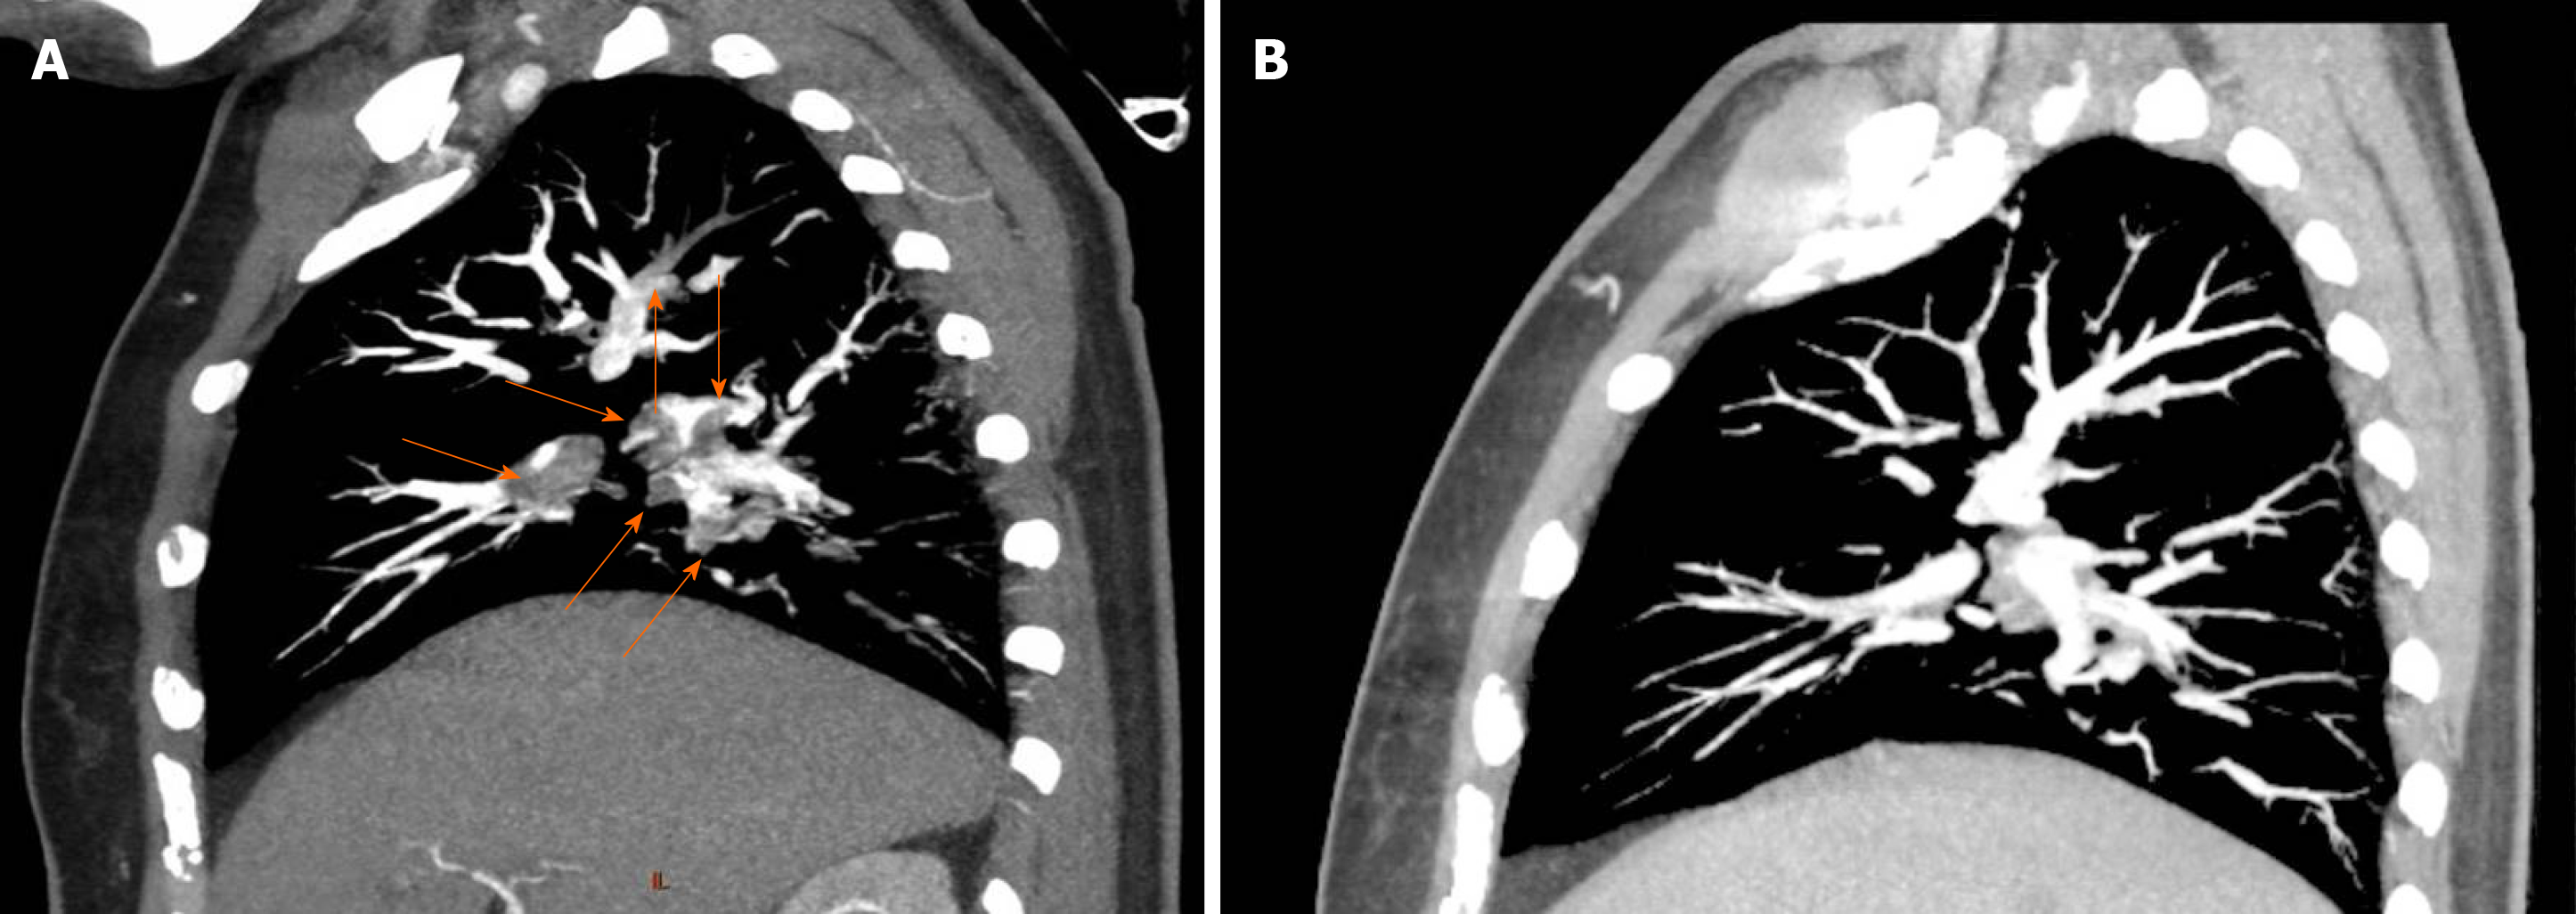
Figure 1 Representative computed tomography angiography evidence of pulmonary embolism and follow-up recovery.
A: Four years before this admission, the patient was diagnosed with pulmonary embolism. This is one representative computed tomography angiography image of the pulmonary embolism. Red arrows indicate the thrombi inside the pulmonary arteries; B: Following 6 mo of treatment after the diagnosis of pulmonary embolism, follow-up pulmonary computed tomography angiography showed obvious thrombus regression.
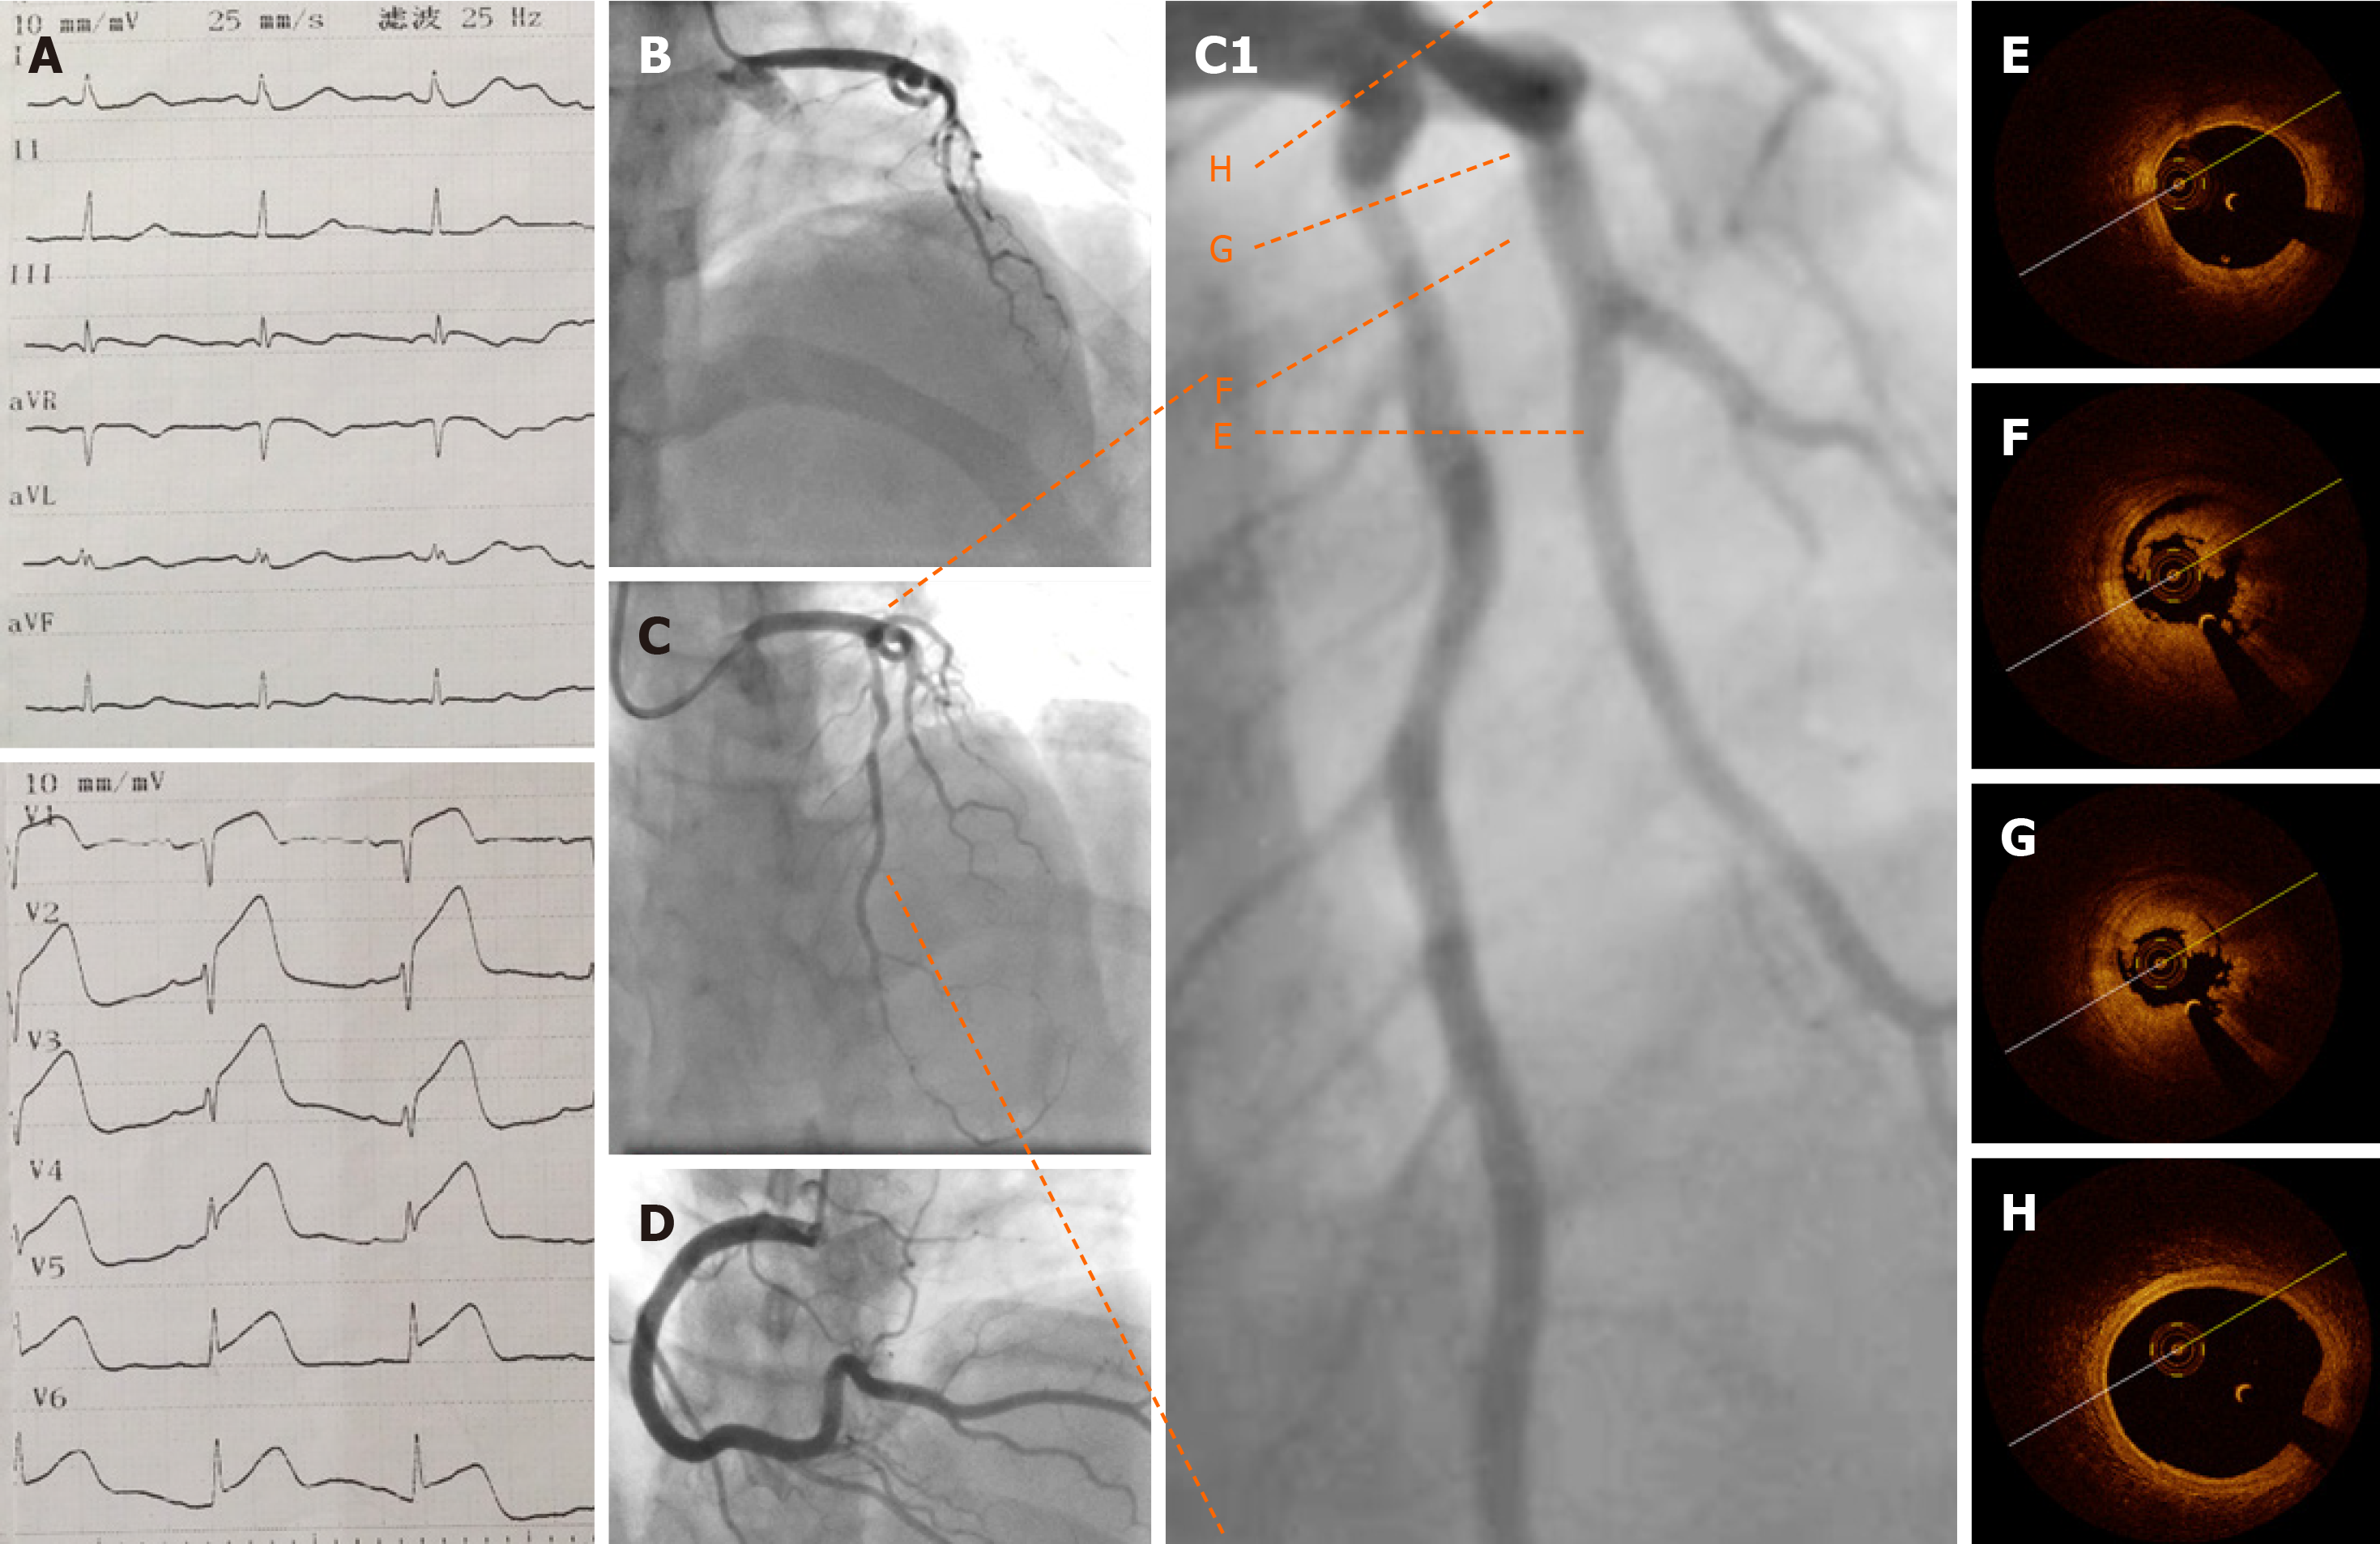
Figure 2 Baseline electrocardiography, coronary angiography, and optical coherence tomography.
A: Emergency electrocardiography showing acute anterior wall ST elevation myocardial infarction; B: Emergency coronary angiography showing acute total occlusion and thrombus of the proximal left anterior descending artery (pLAD); C: pLAD after repeated thrombus aspirations; C1: Zoom-in image of pLAD; D: Normal right coronary artery; E-G: Representative cross-sectional optical coherence tomography images of the pLAD. Distal reference image of the pLAD stenosis (E), residual red and white thrombi around the optical coherence tomography catheter (F), and minimal lumen area of pLAD (2.19 mm2), area stenosis (67.3%), and residual thrombus (G, 3 o’clock to 9 o’clock) are shown; H: Normal left anterior descending artery ostium.
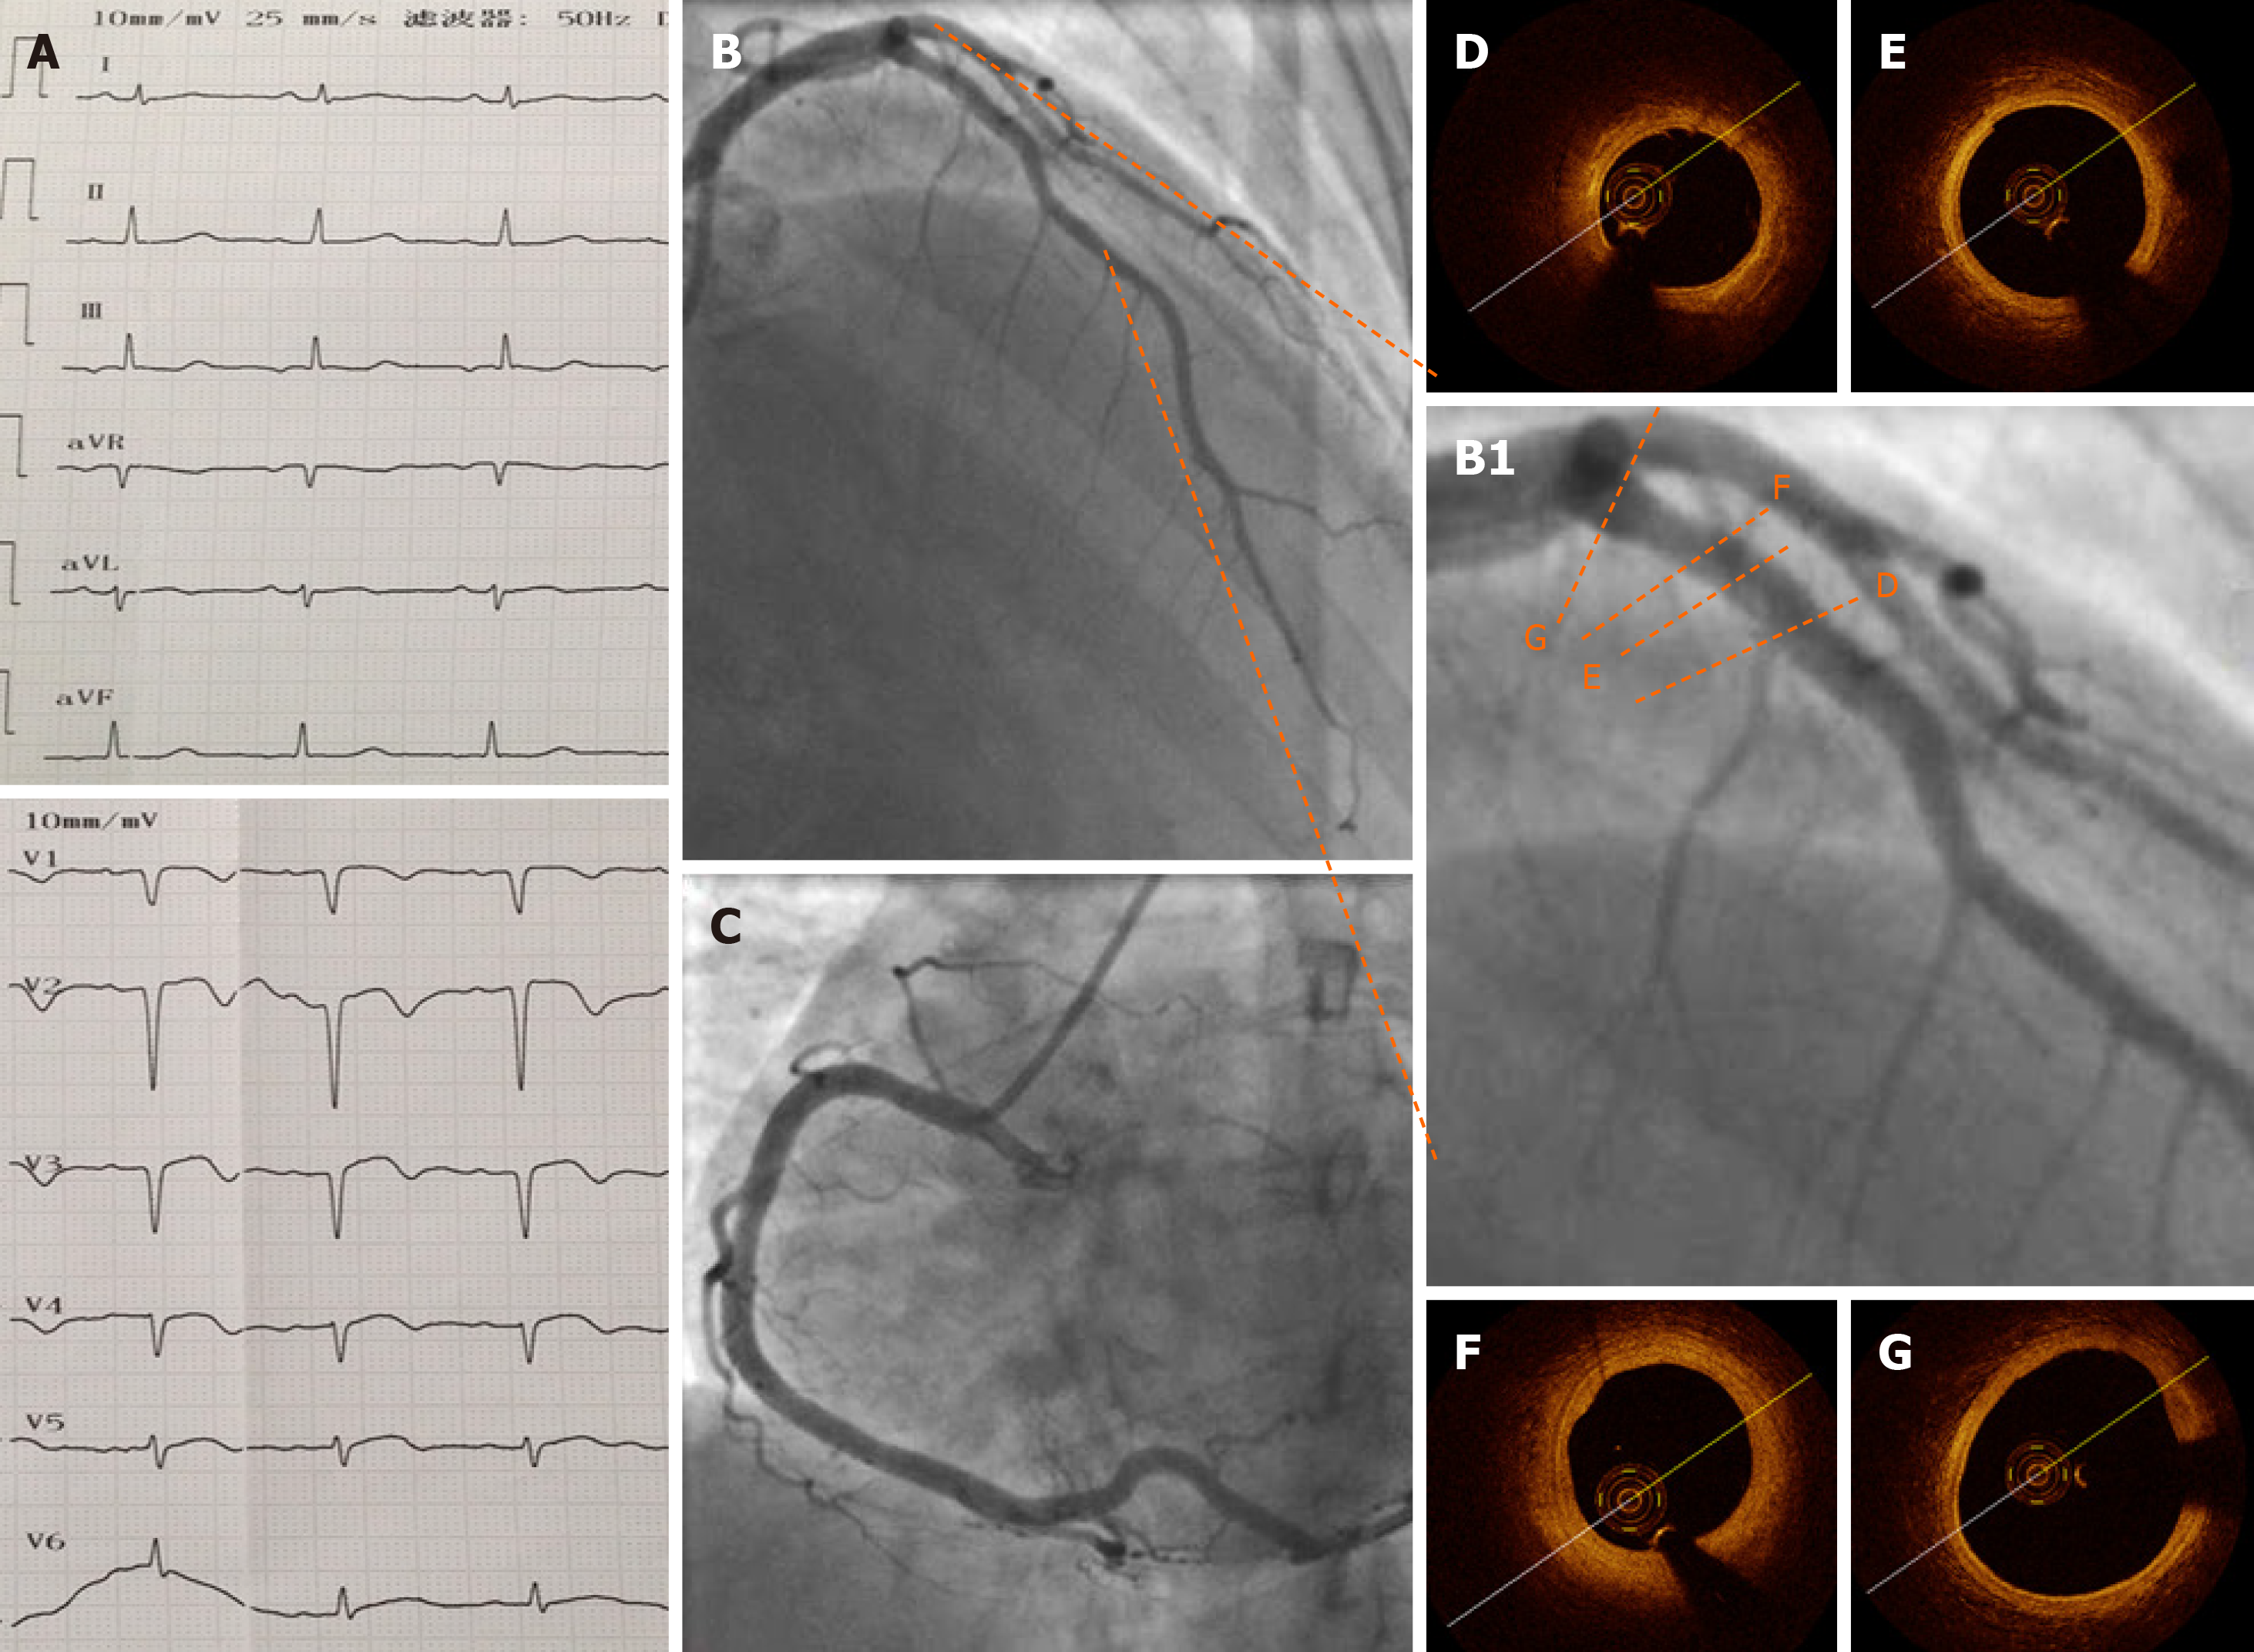
Figure 3 Electrocardiography, coronary angiography, and optical coherence tomography at 1 wk after the procedure.
A: Pathological Q waves were visible on electrocardiography in leads V1–V4 at 1 wk after the procedure; B and C: One week later, coronary angiography showed a normal proximal left anterior descending artery (pLAD) and normal repeated thrombus aspirations; B1: Zoomed-in image of pLAD; D-G: Representative images of the pLAD showing a nearly normal coronary artery with an intact intima and no residual thrombus. F: Focal segment of a stable thick-cap plaque. Minimal lumen area was 5.57 mm2, and the percentage of area stenosis was 16.6%.
- Citation: Du BB, Wang XT, Tong YL, Liu K, Li PP, Li XD, Yang P, Wang Y. Optical coherence tomography guided treatment avoids stenting in an antiphospholipid syndrome patient: A case report. World J Clin Cases 2020; 8(11): 2399-2405
- URL: https://www.wjgnet.com/2307-8960/full/v8/i11/2399.htm
- DOI: https://dx.doi.org/10.12998/wjcc.v8.i11.2399


