Copyright
©The Author(s) 2020.
World J Clin Cases. Jun 6, 2020; 8(11): 2127-2136
Published online Jun 6, 2020. doi: 10.12998/wjcc.v8.i11.2127
Published online Jun 6, 2020. doi: 10.12998/wjcc.v8.i11.2127
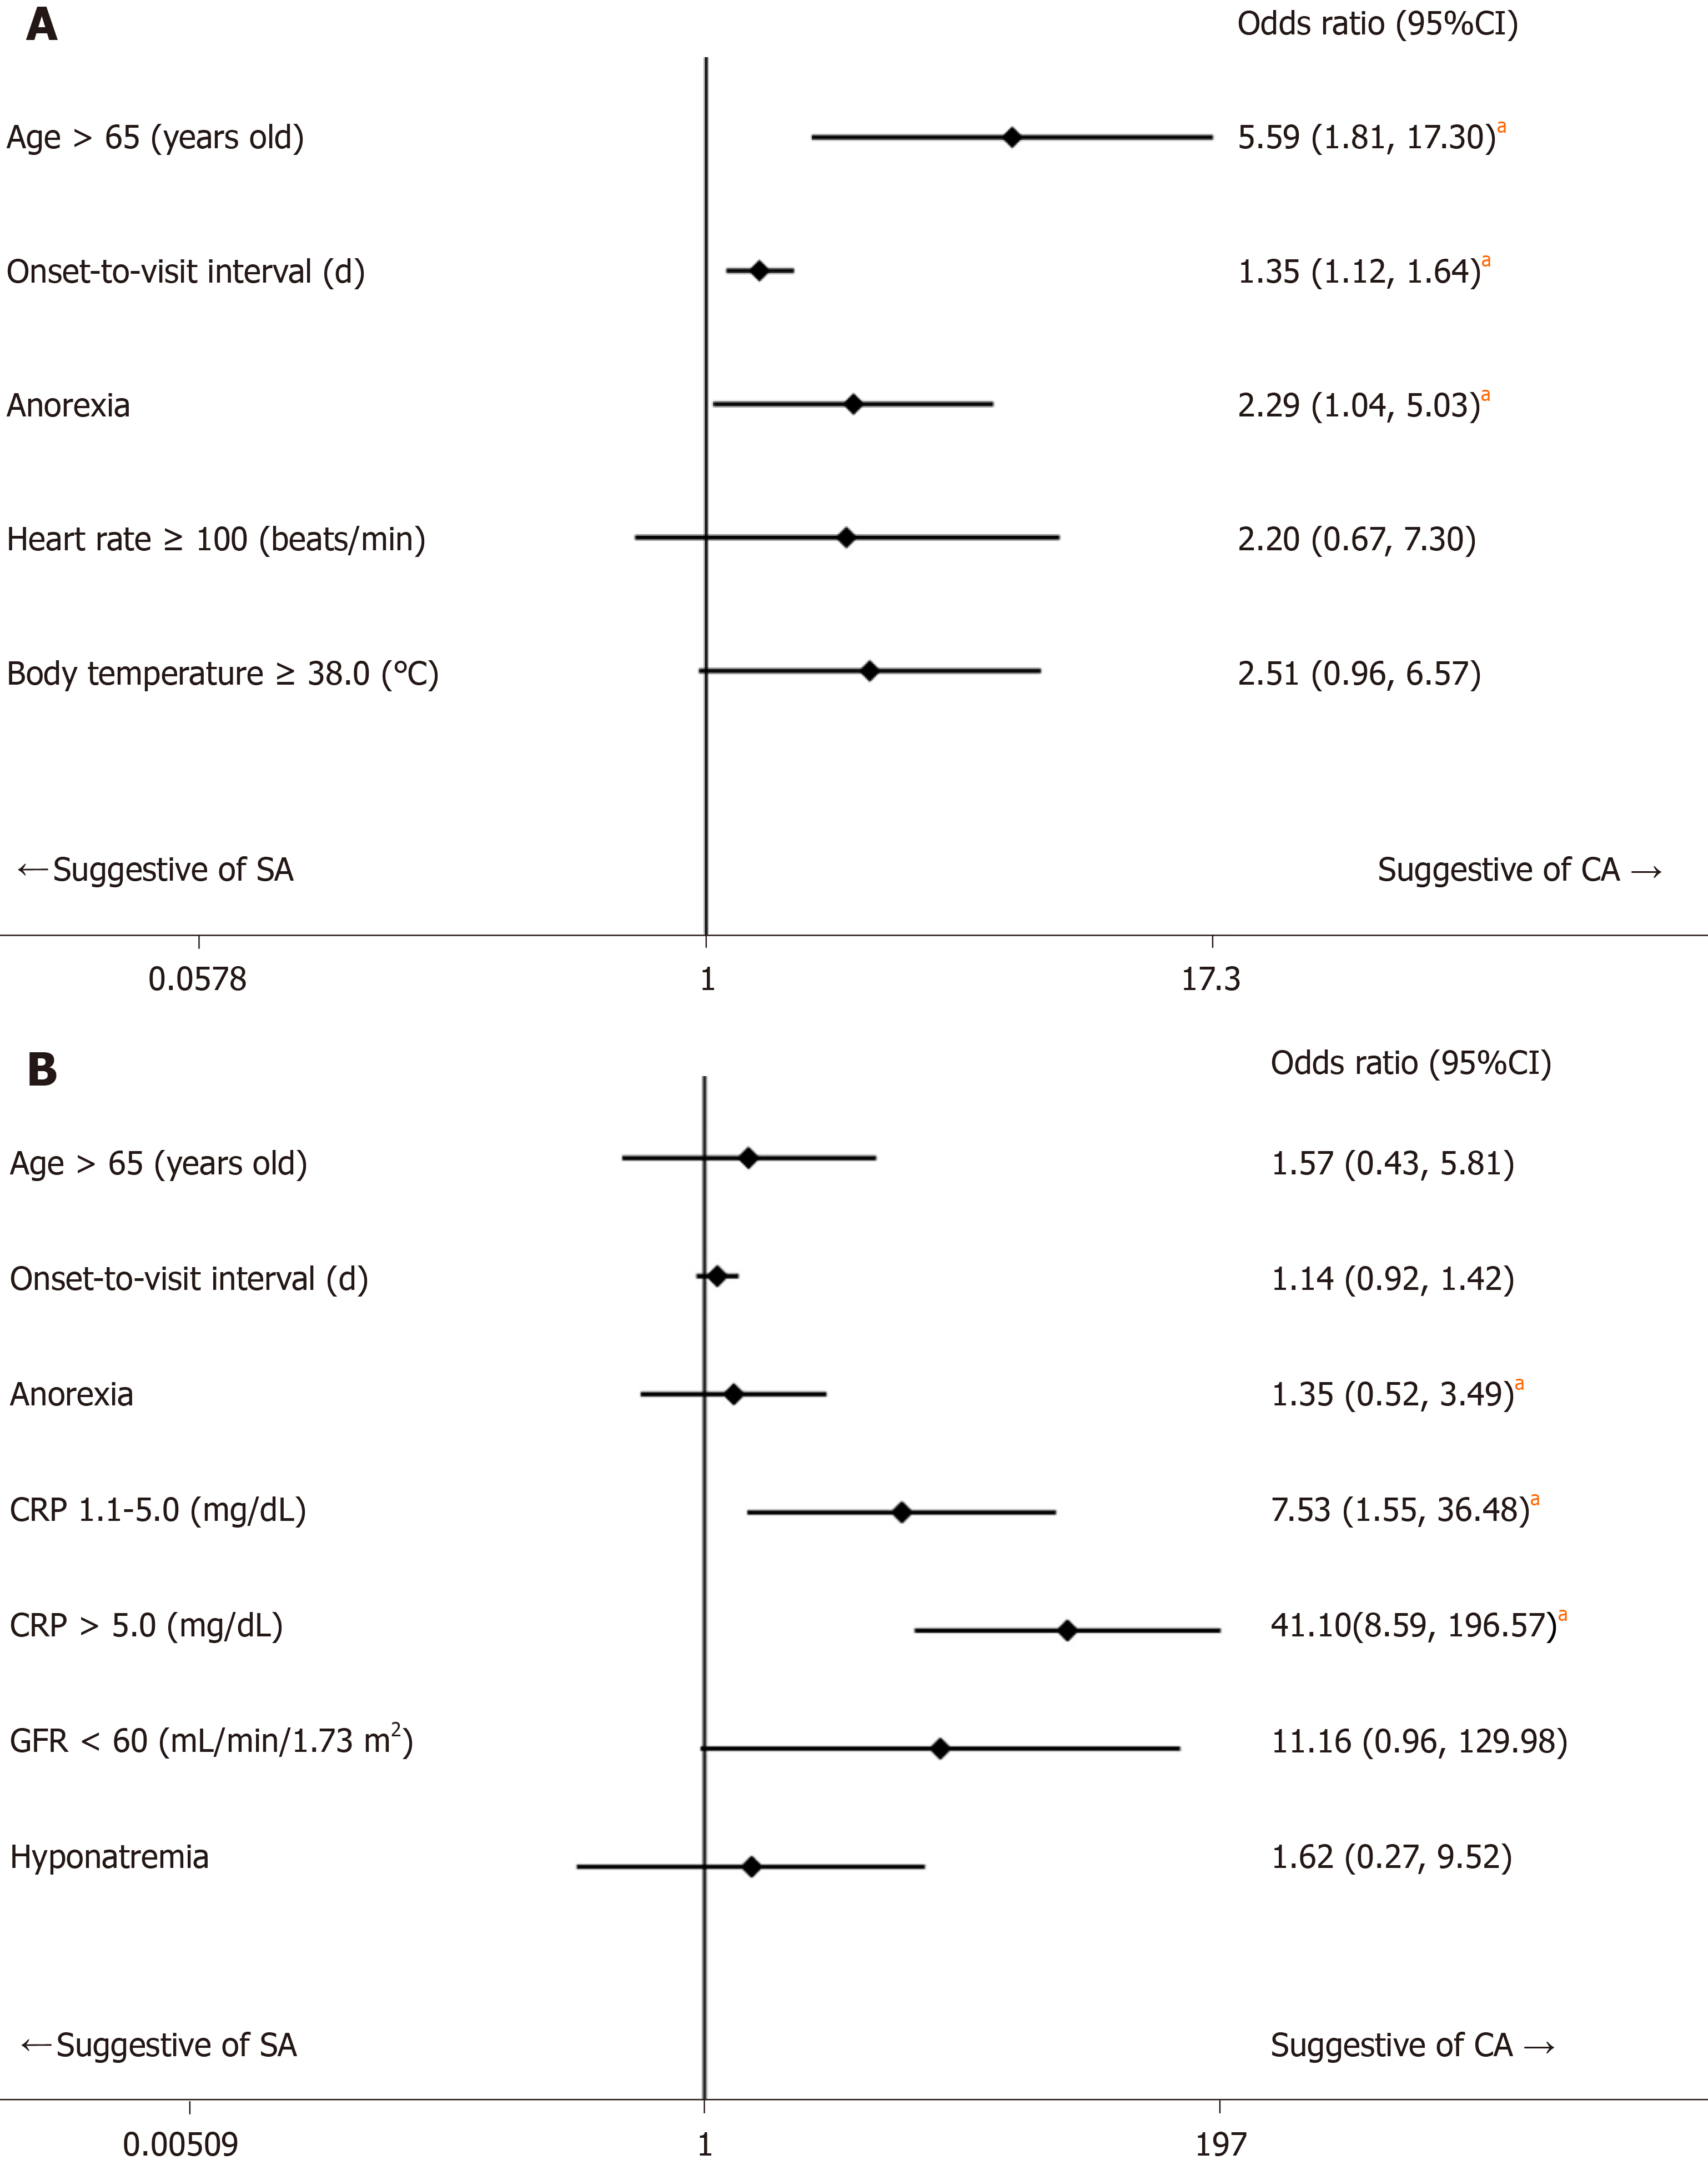
Figure 1 Forest plot of the logistic regression in Model 1 and Model 2.
A: Model 1 (Non-laboratory factors only). aAge > 65 years old, longer onset-to-visit interval, and anorexia have significantly high odds ratios, which suggests that complicated appendicitis is more likely; B: Model 2 (including laboratory factors). aOnly high CRP values have significantly high odds ratios, which suggests that complicated appendicitis is more likely. The odds ratio increases in proportion to the CRP value. CA: Complicated appendicitis; CI: Confidence interval; SA: Simple appendicitis; CRP: C-reactive protein; GFR: Glomerular filtration rate.
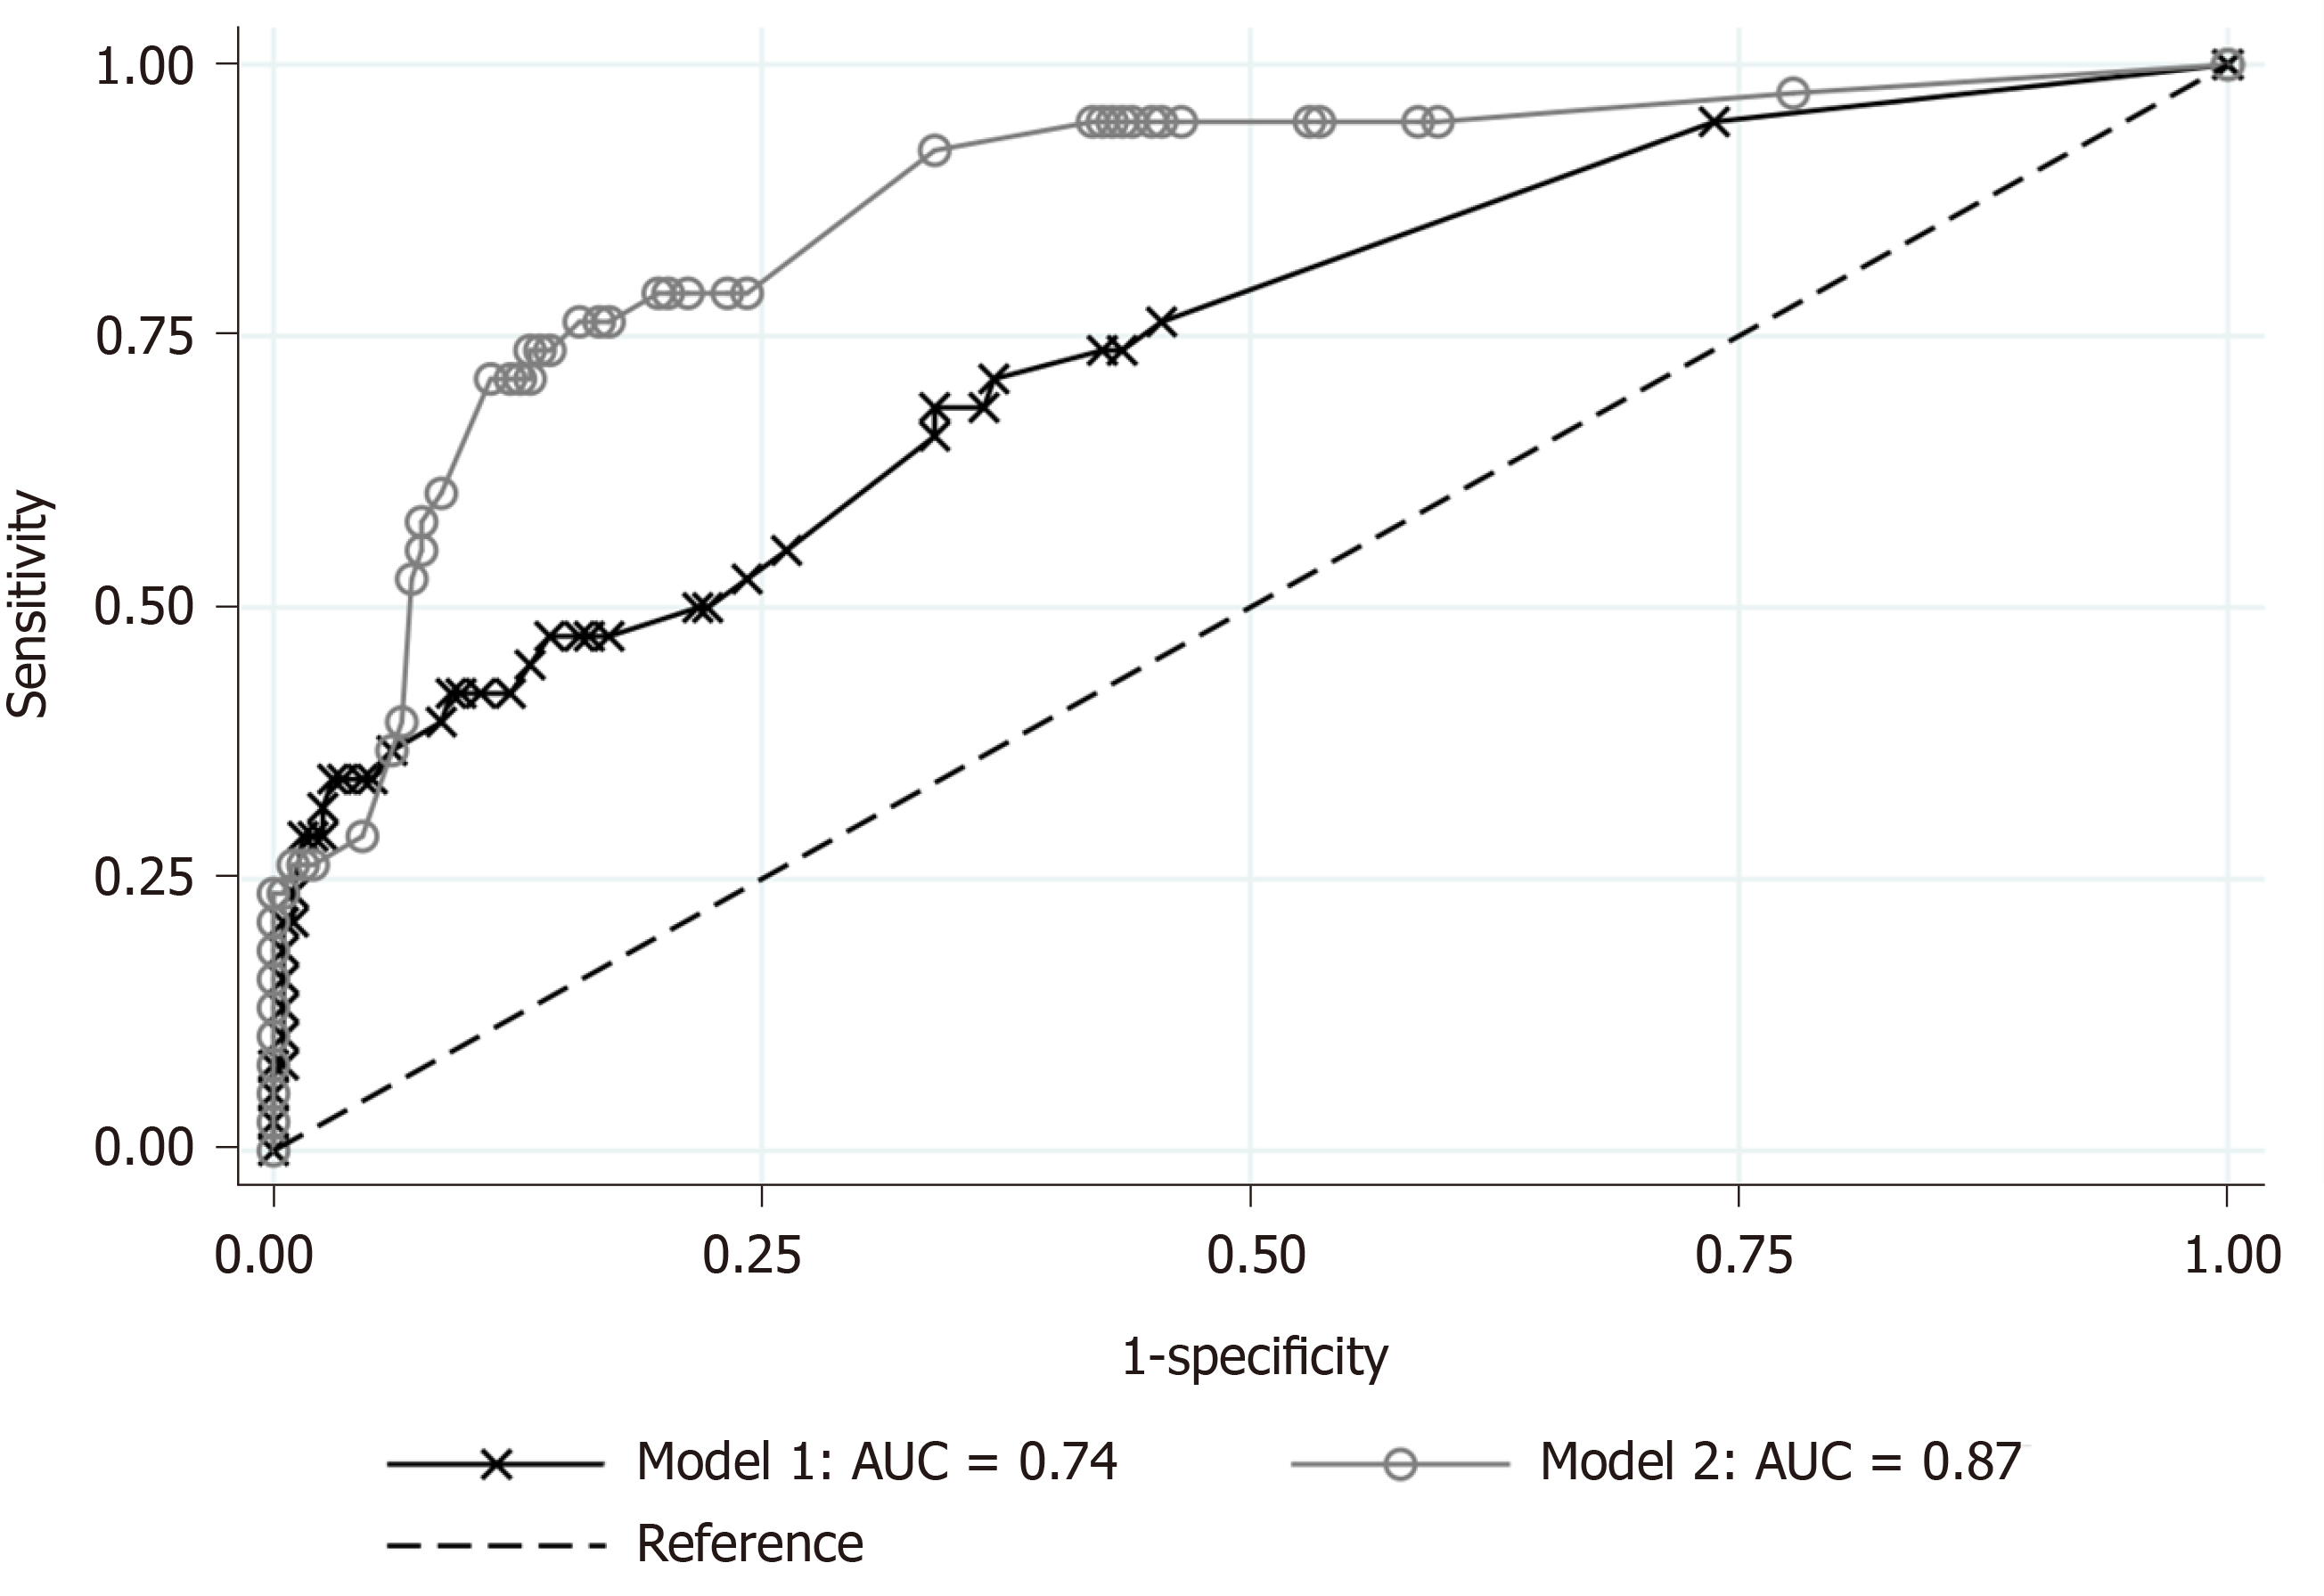
Figure 2 Comparison of the regression models for prediction of complicated appendicitis.
The receiver operating characteristic curves are shown for Model 1 (explanatory variables: Age > 65 years old, onset-to-visit interval, anorexia, tachycardia, and fever) and Model 2 (explanatory variables: Age > 65 years old, onset-to-visit interval, anorexia, serum C-reactive protein level, renal dysfunction, and hyponatremia). Area under the curve of the receiver operating characteristic curve for Model 2 is superior to that of Model 1 (0.87 vs 0.74).
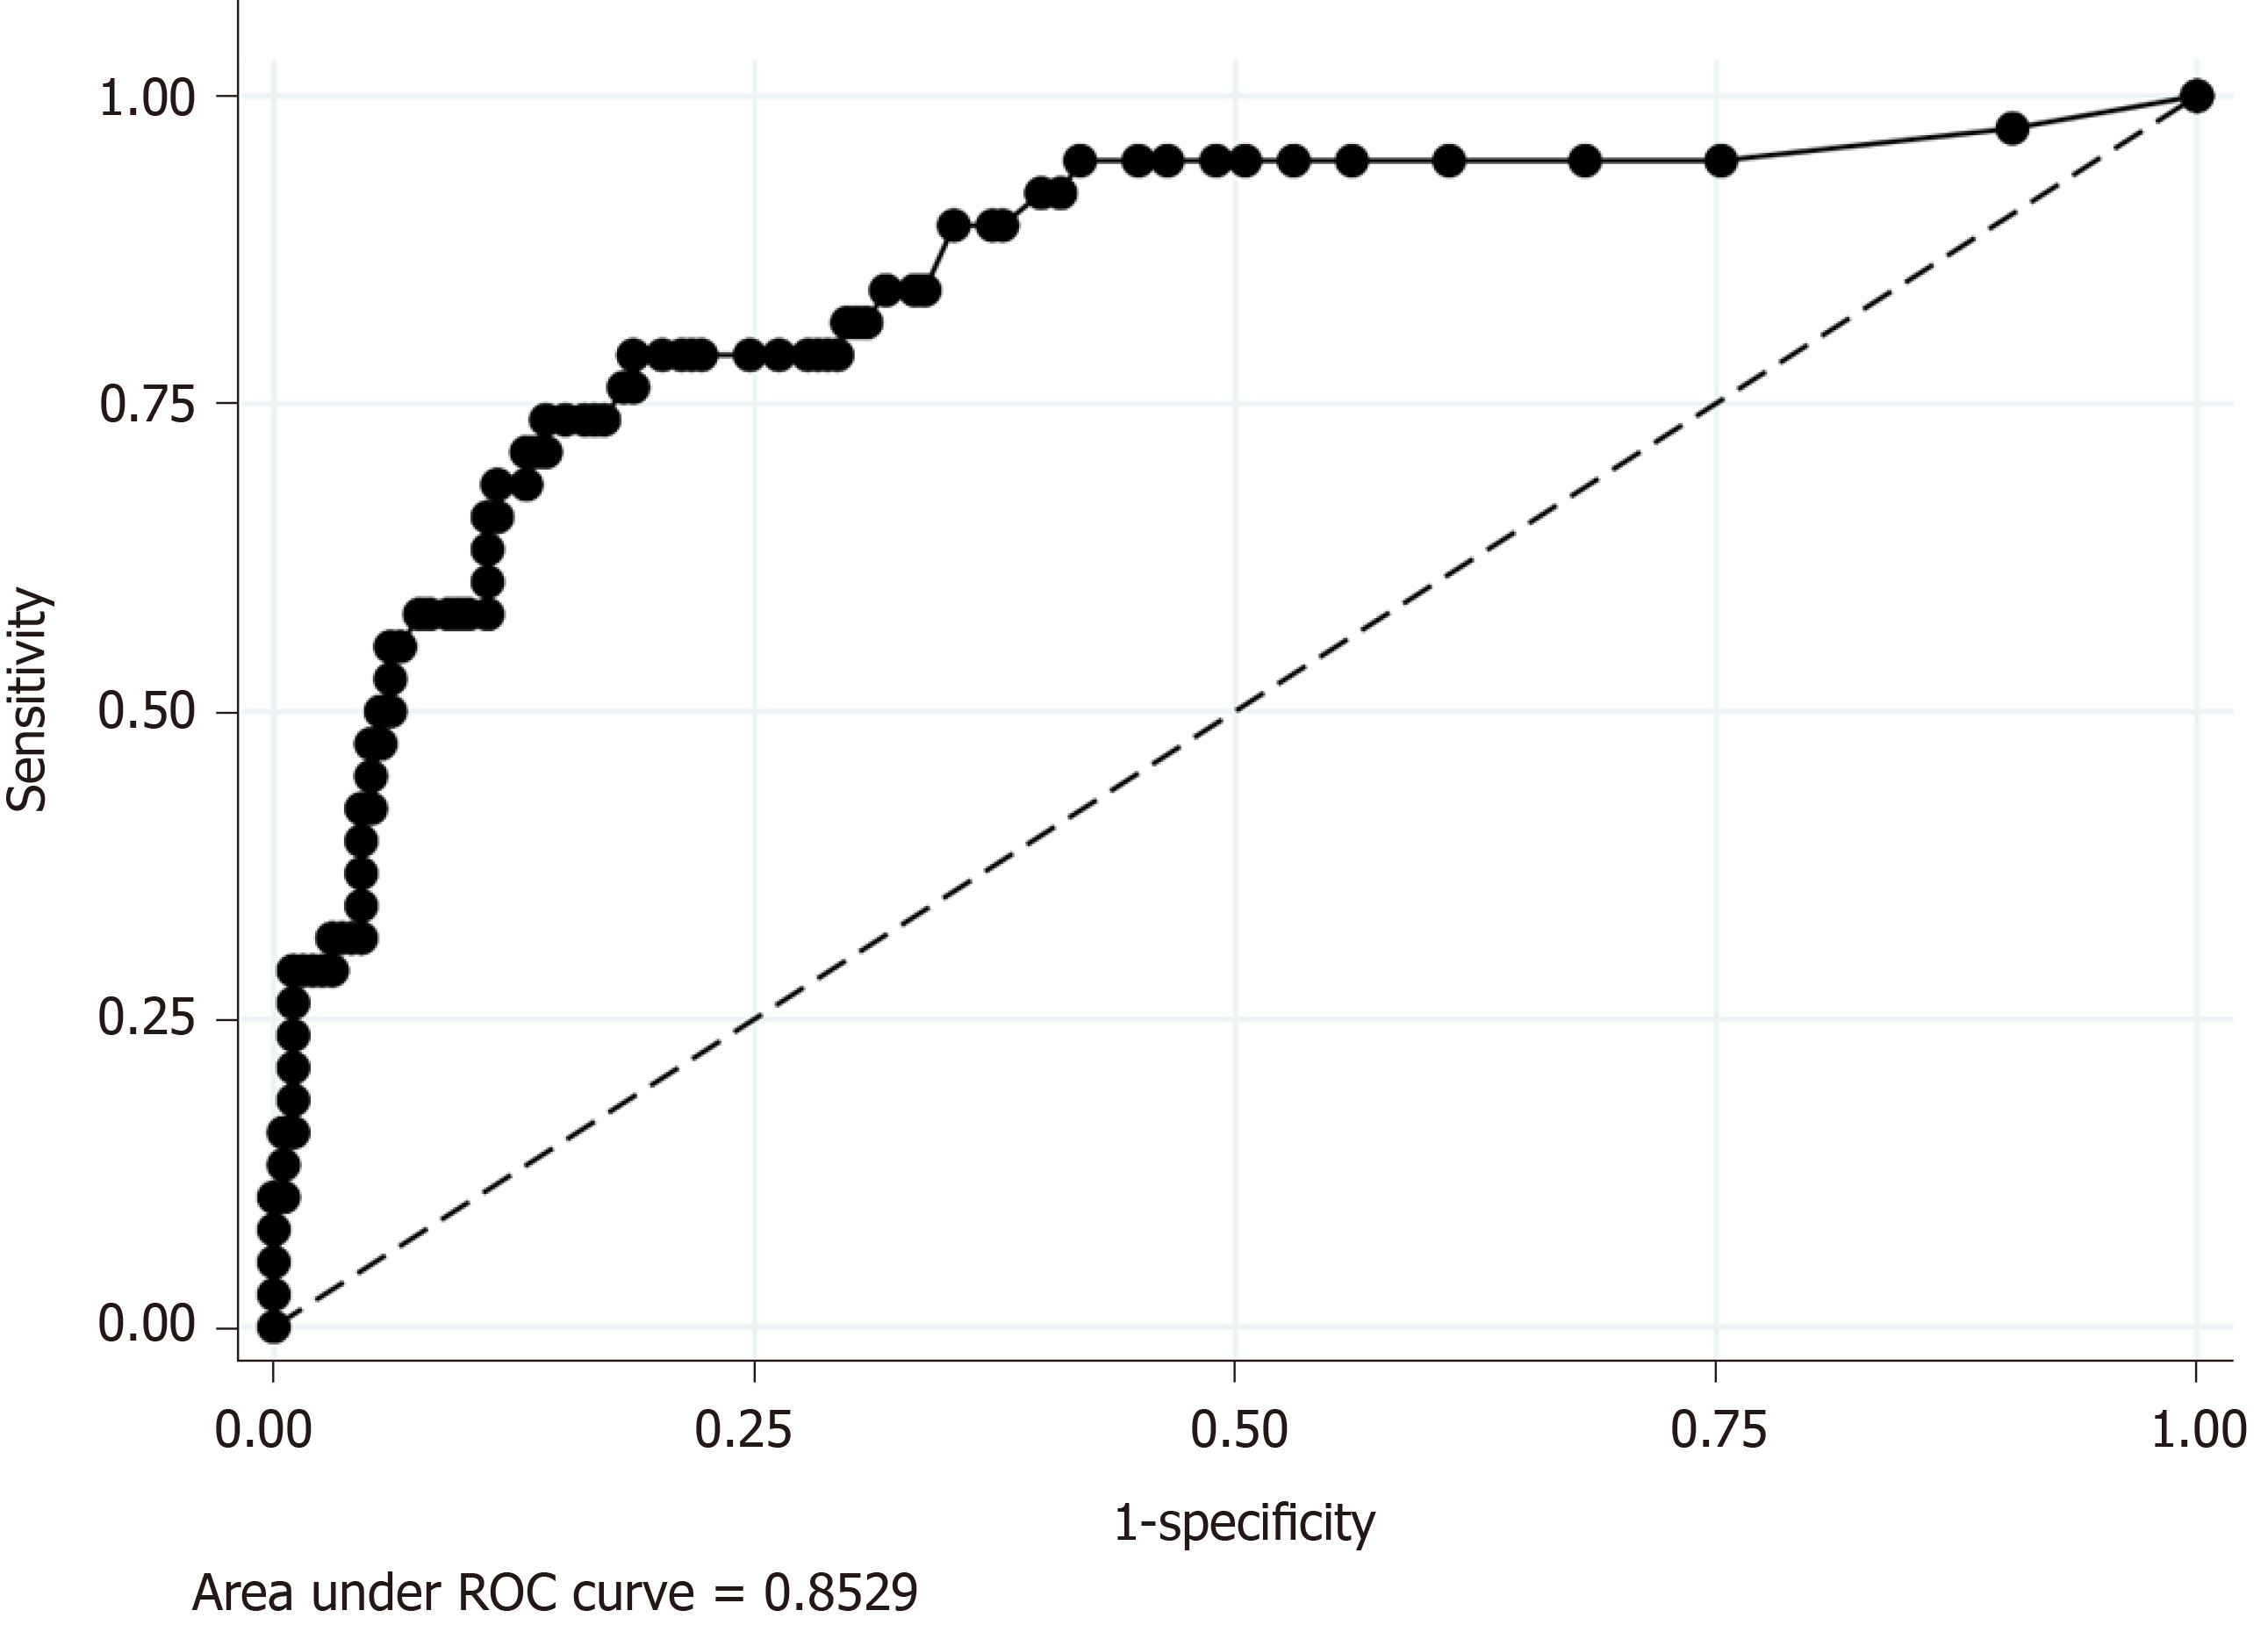
Figure 3 Receiver operating characteristic curve of serum C-reactive protein level for prediction of complicated appendicitis.
Receiver operating characteristic curve of serum C-reactive protein (CRP) level for prediction of complicated appendicitis revealed an area under the curve value of 0.85. The sensitivity and specificity are 94.7% and 55.1% when CRP ≥ was 1.0 mg/dL and 68.4% and 86.9% when CRP was ≥ 4.9 mg/dL, respectively.
- Citation: Sasaki Y, Komatsu F, Kashima N, Suzuki T, Takemoto I, Kijima S, Maeda T, Miyazaki T, Honda Y, Zai H, Shimada N, Funahashi K, Urita Y. Clinical prediction of complicated appendicitis: A case-control study utilizing logistic regression. World J Clin Cases 2020; 8(11): 2127-2136
- URL: https://www.wjgnet.com/2307-8960/full/v8/i11/2127.htm
- DOI: https://dx.doi.org/10.12998/wjcc.v8.i11.2127


