Copyright
©The Author(s) 2019.
World J Clin Cases. Nov 6, 2019; 7(21): 3419-3435
Published online Nov 6, 2019. doi: 10.12998/wjcc.v7.i21.3419
Published online Nov 6, 2019. doi: 10.12998/wjcc.v7.i21.3419
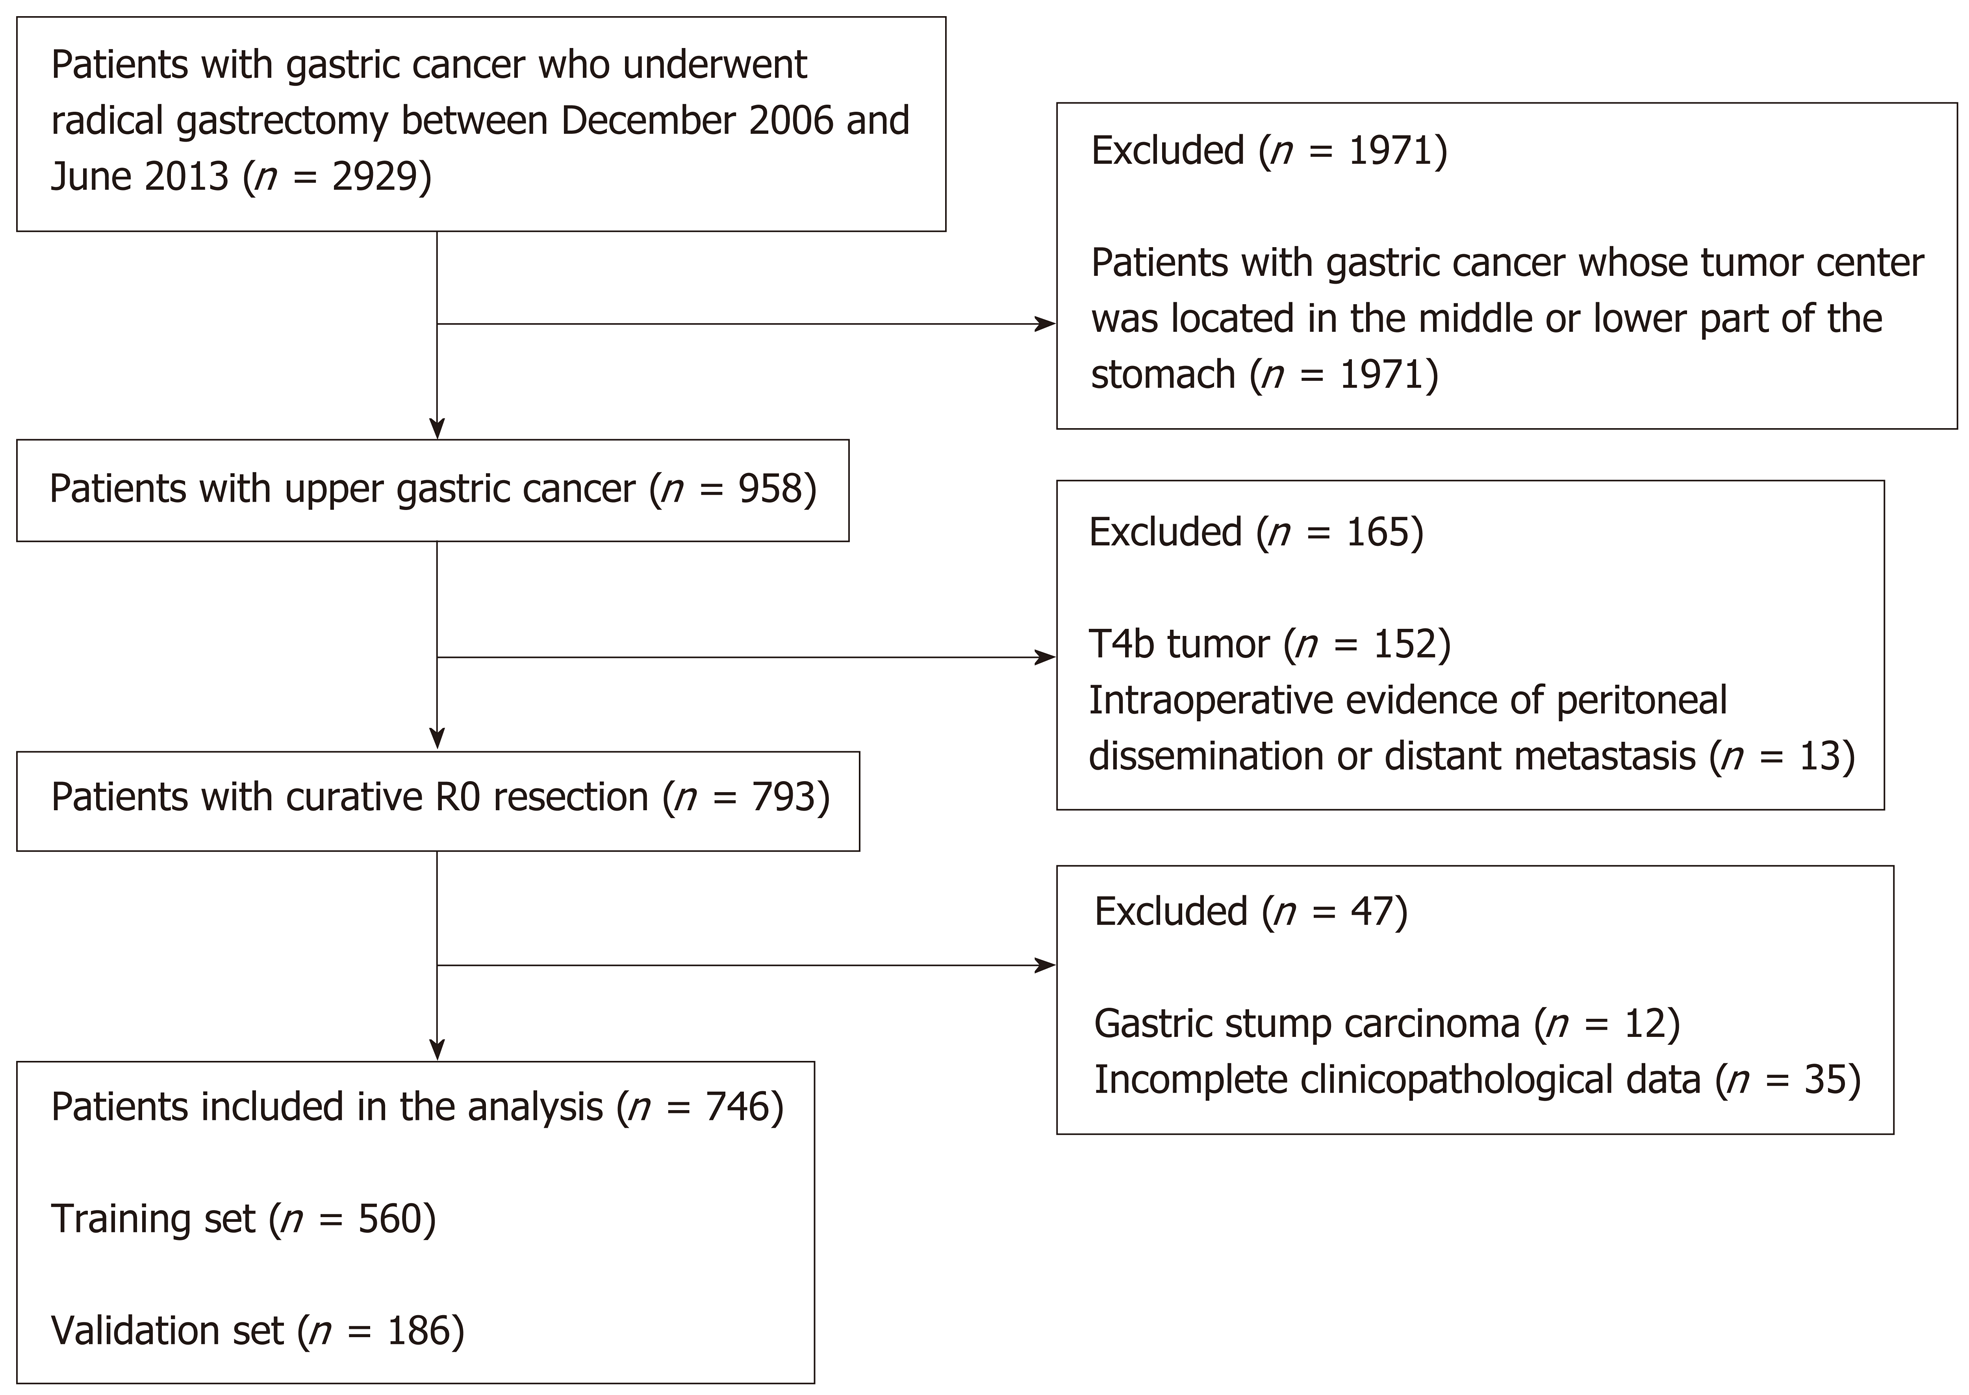
Figure 1 Flow chart depicting the patient selection process.
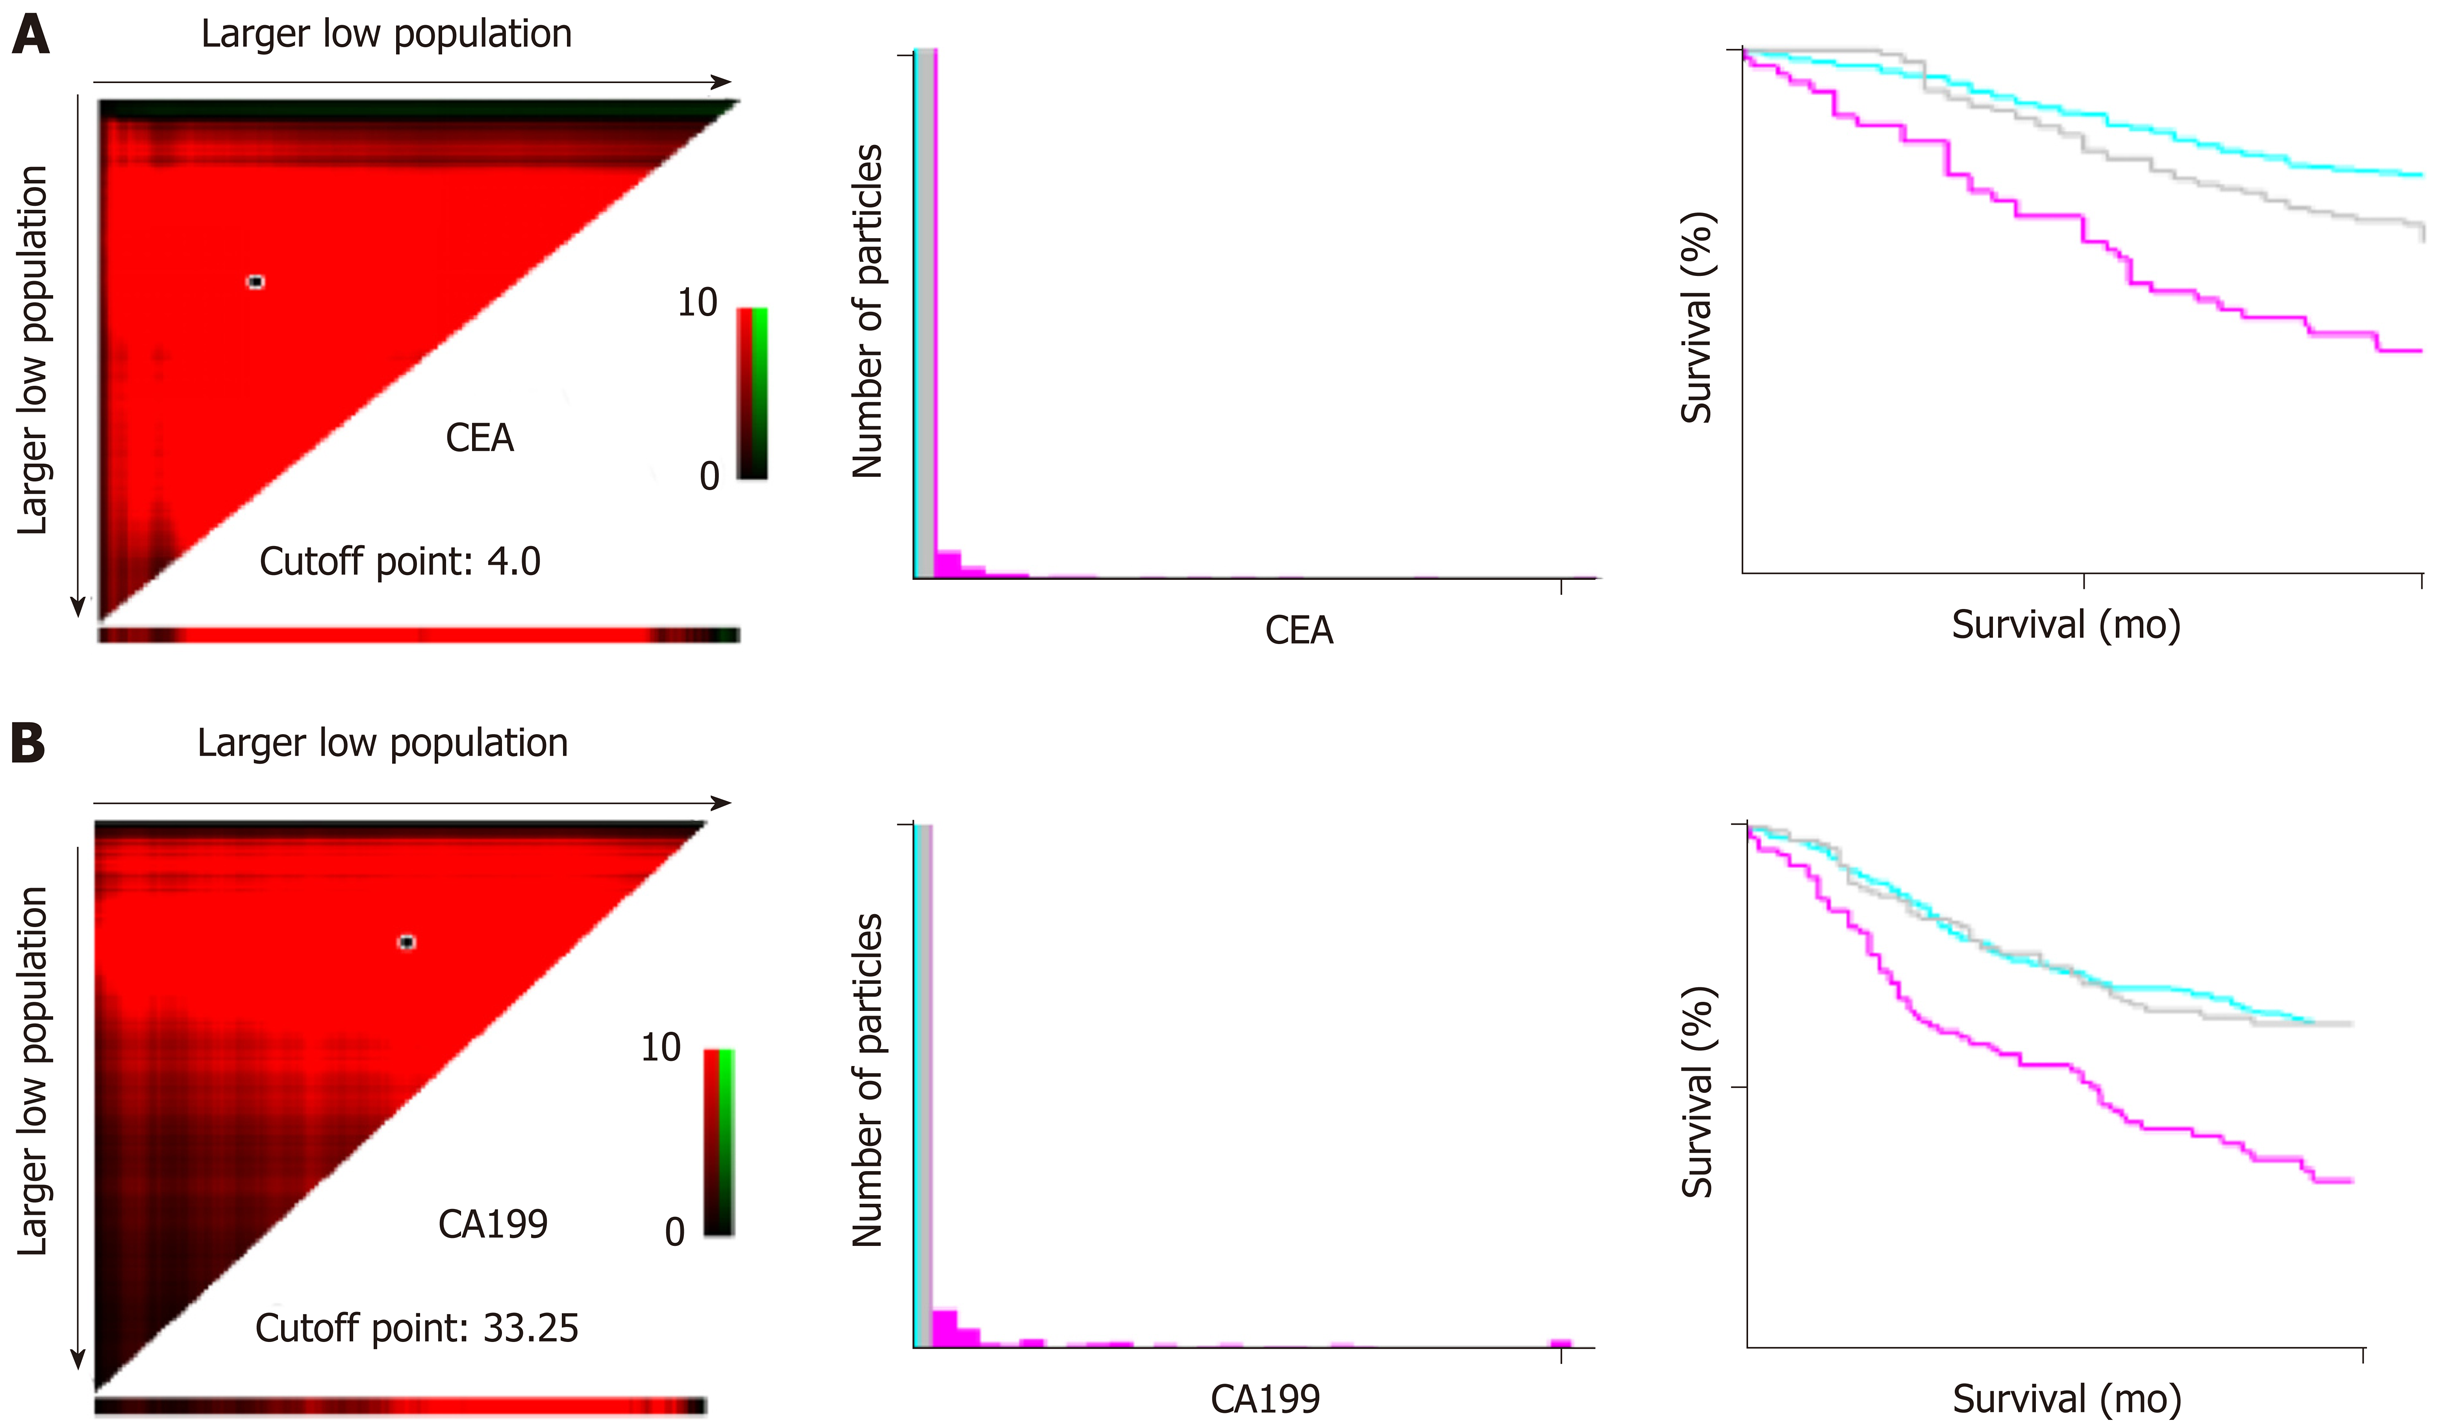
Figure 2 X-tile used to confirm the cutoff values for CEA (A) and CA19-9 (B).
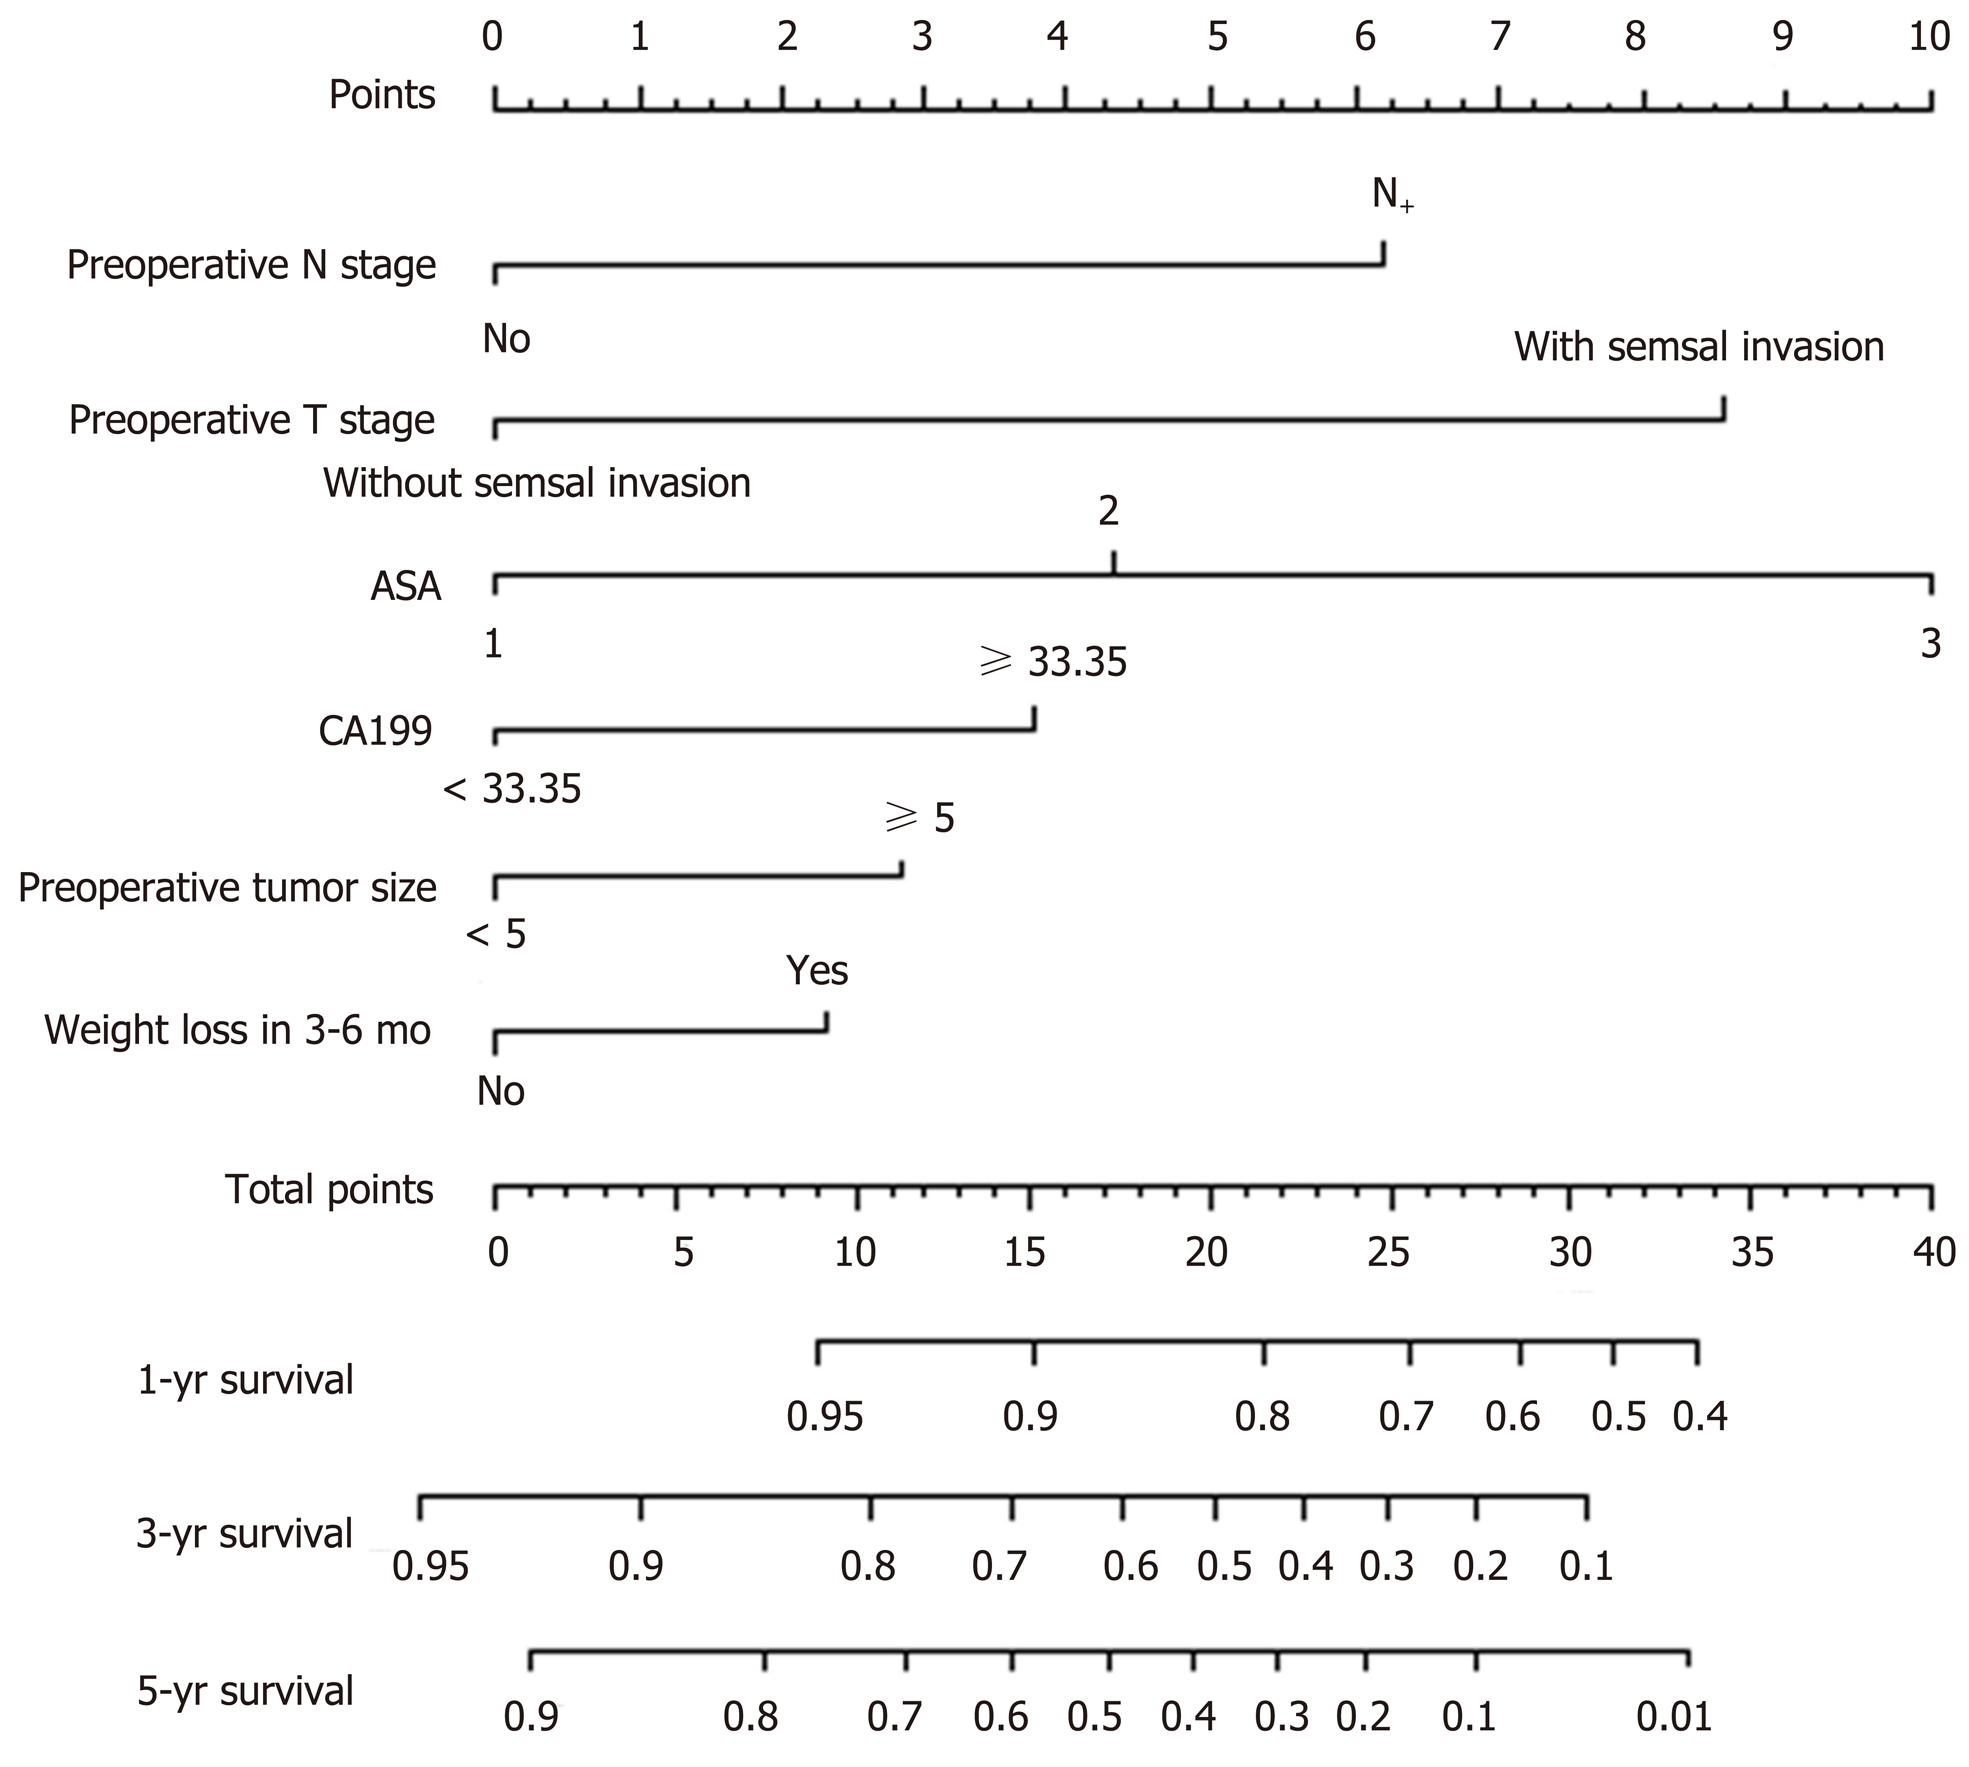
Figure 3 Preoperative nomogram for predicting overall survival in proximal gastric cancer patients after operation (C-index = 0.
751).
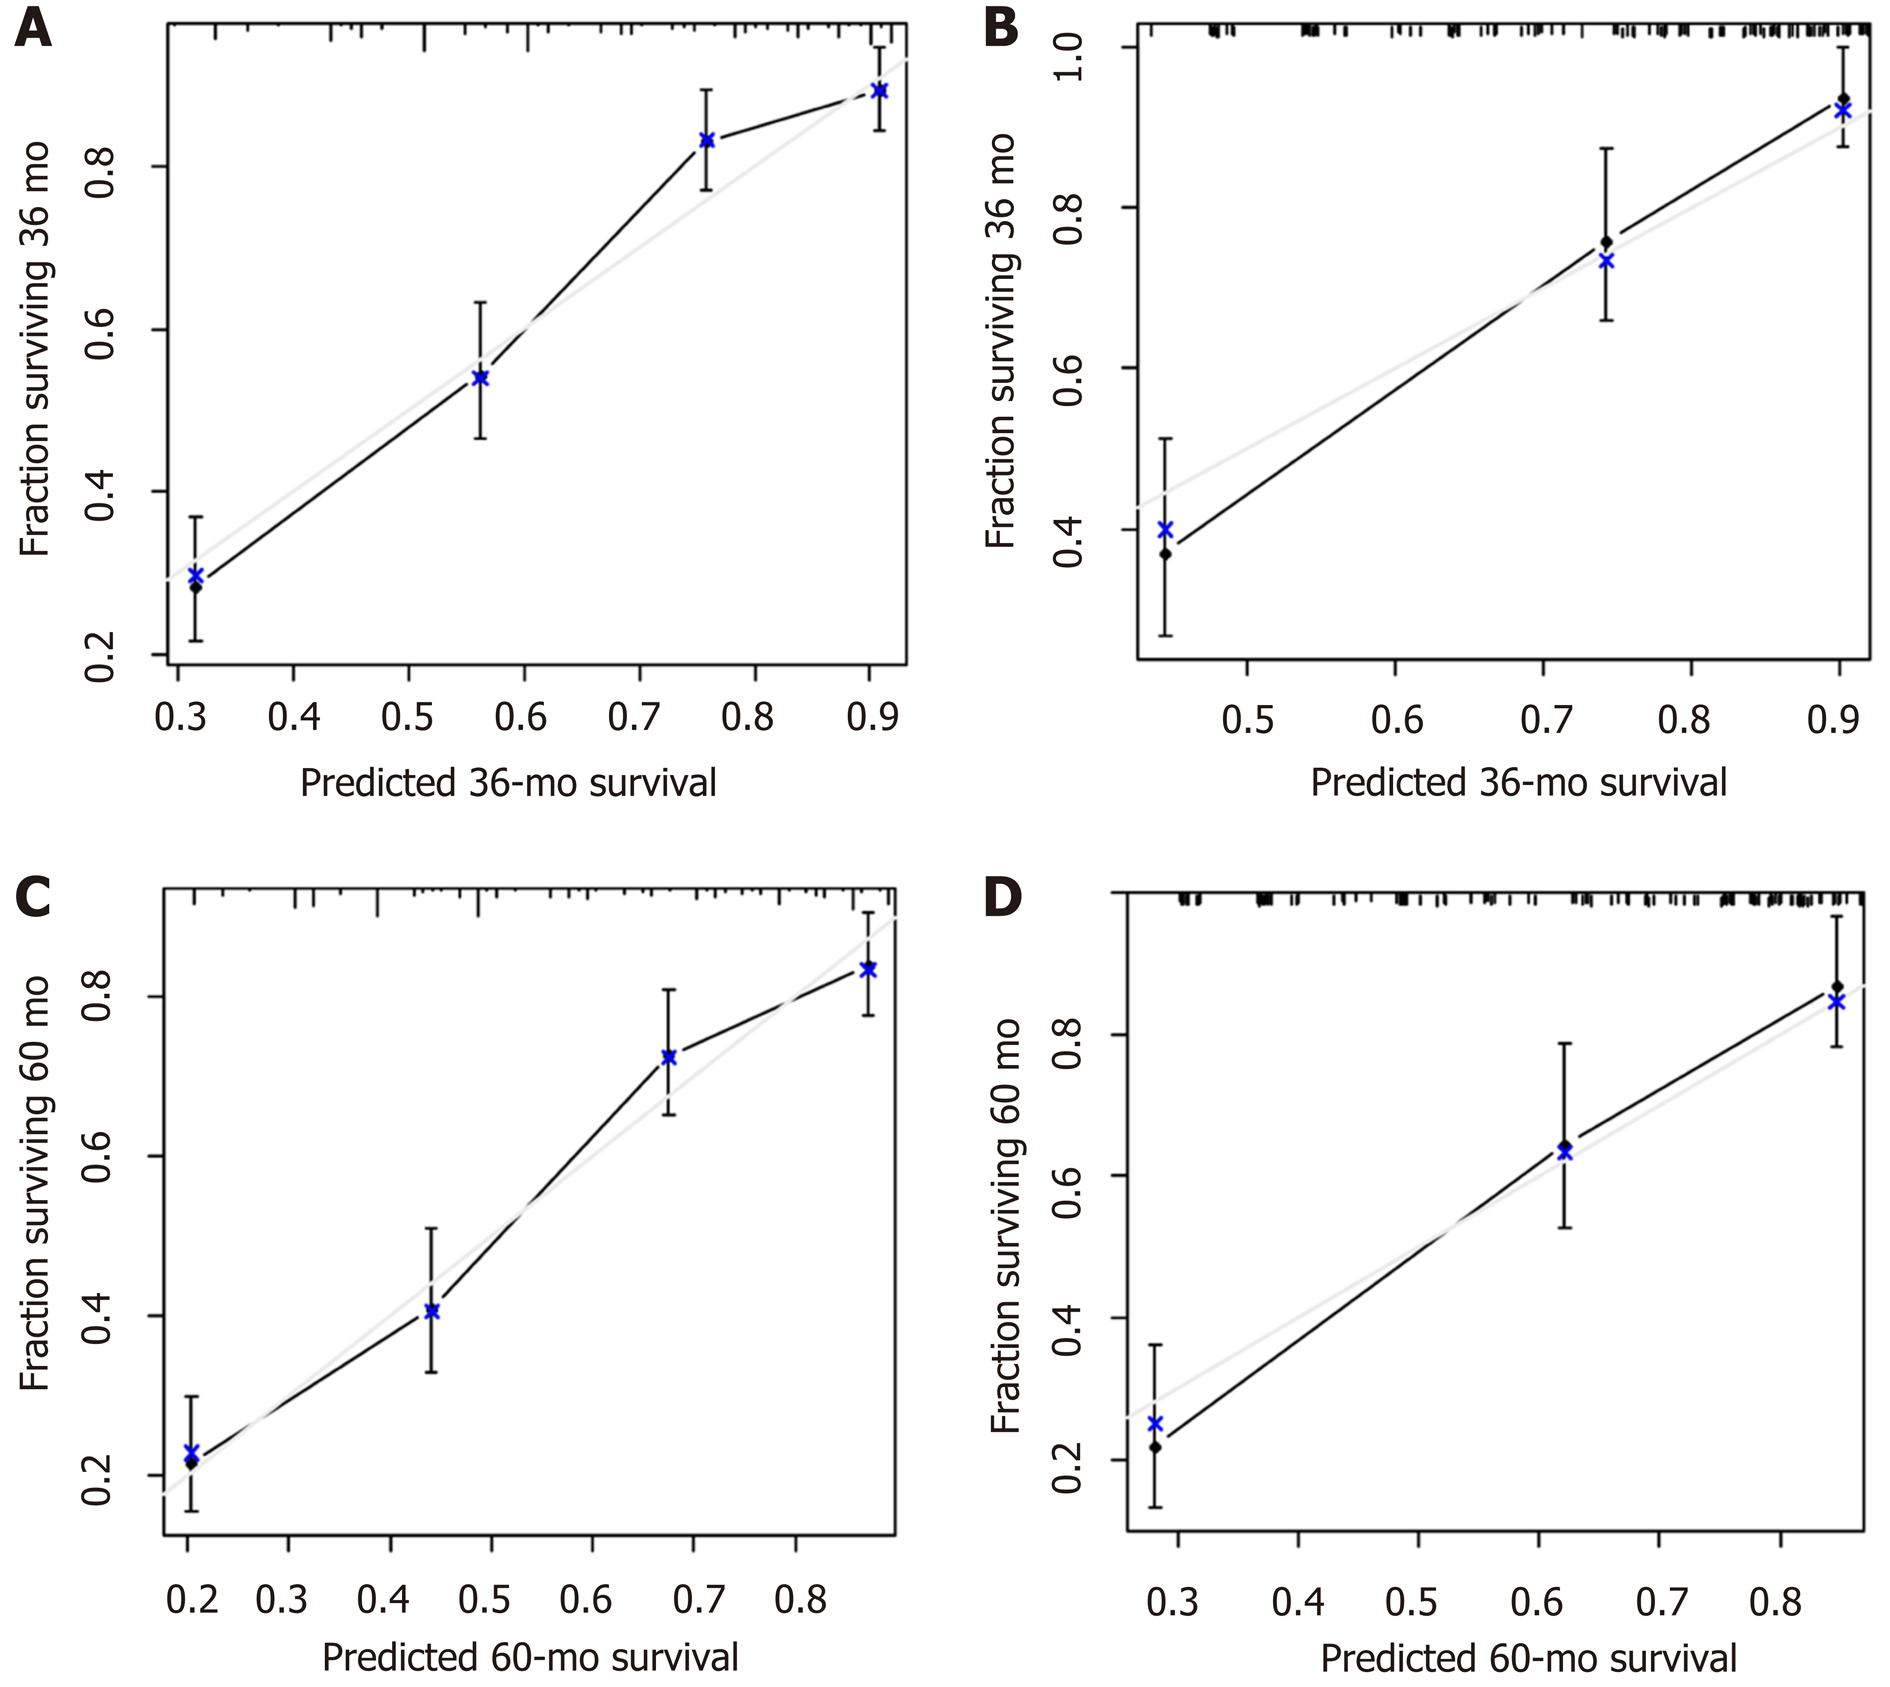
Figure 4 Postoperative 3-year and 5-year overall survival rate calibration curves.
A: Training set calibration curve for the preoperative nomogram for predicting the 3-year OS; B: Validation set calibration curve for the preoperative nomogram for predicting the 3-year OS; C: Training set calibration curve for the preoperative nomogram for predicting the 5-year OS; D: Validation set calibration curve for the preoperative nomogram for predicting the 5-year OS. OS: Overall survival.
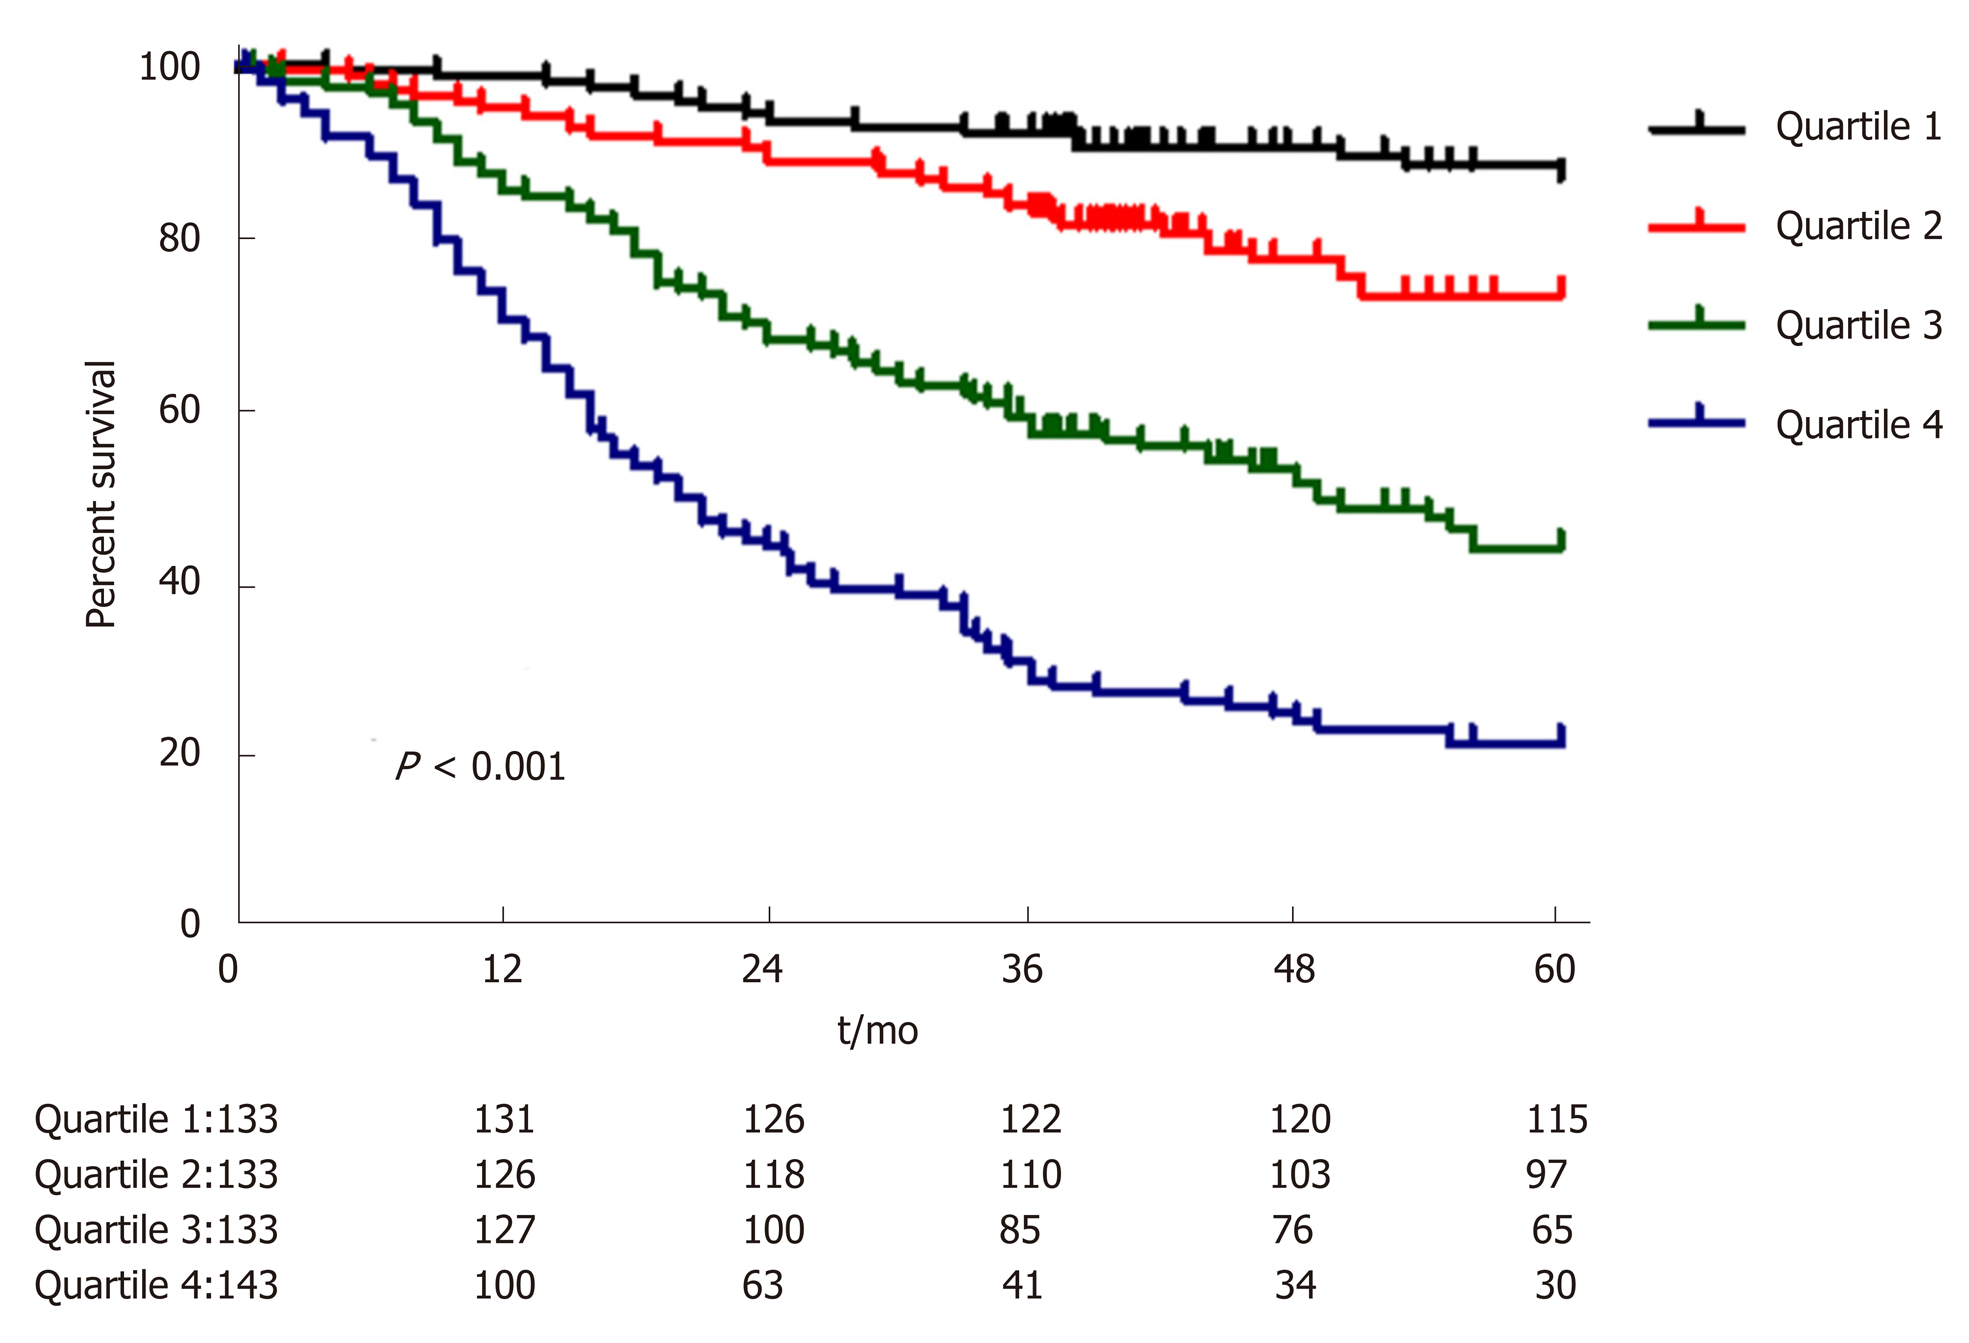
Figure 5 Survival curve cutoff points for the preoperative nomogram quartiles.
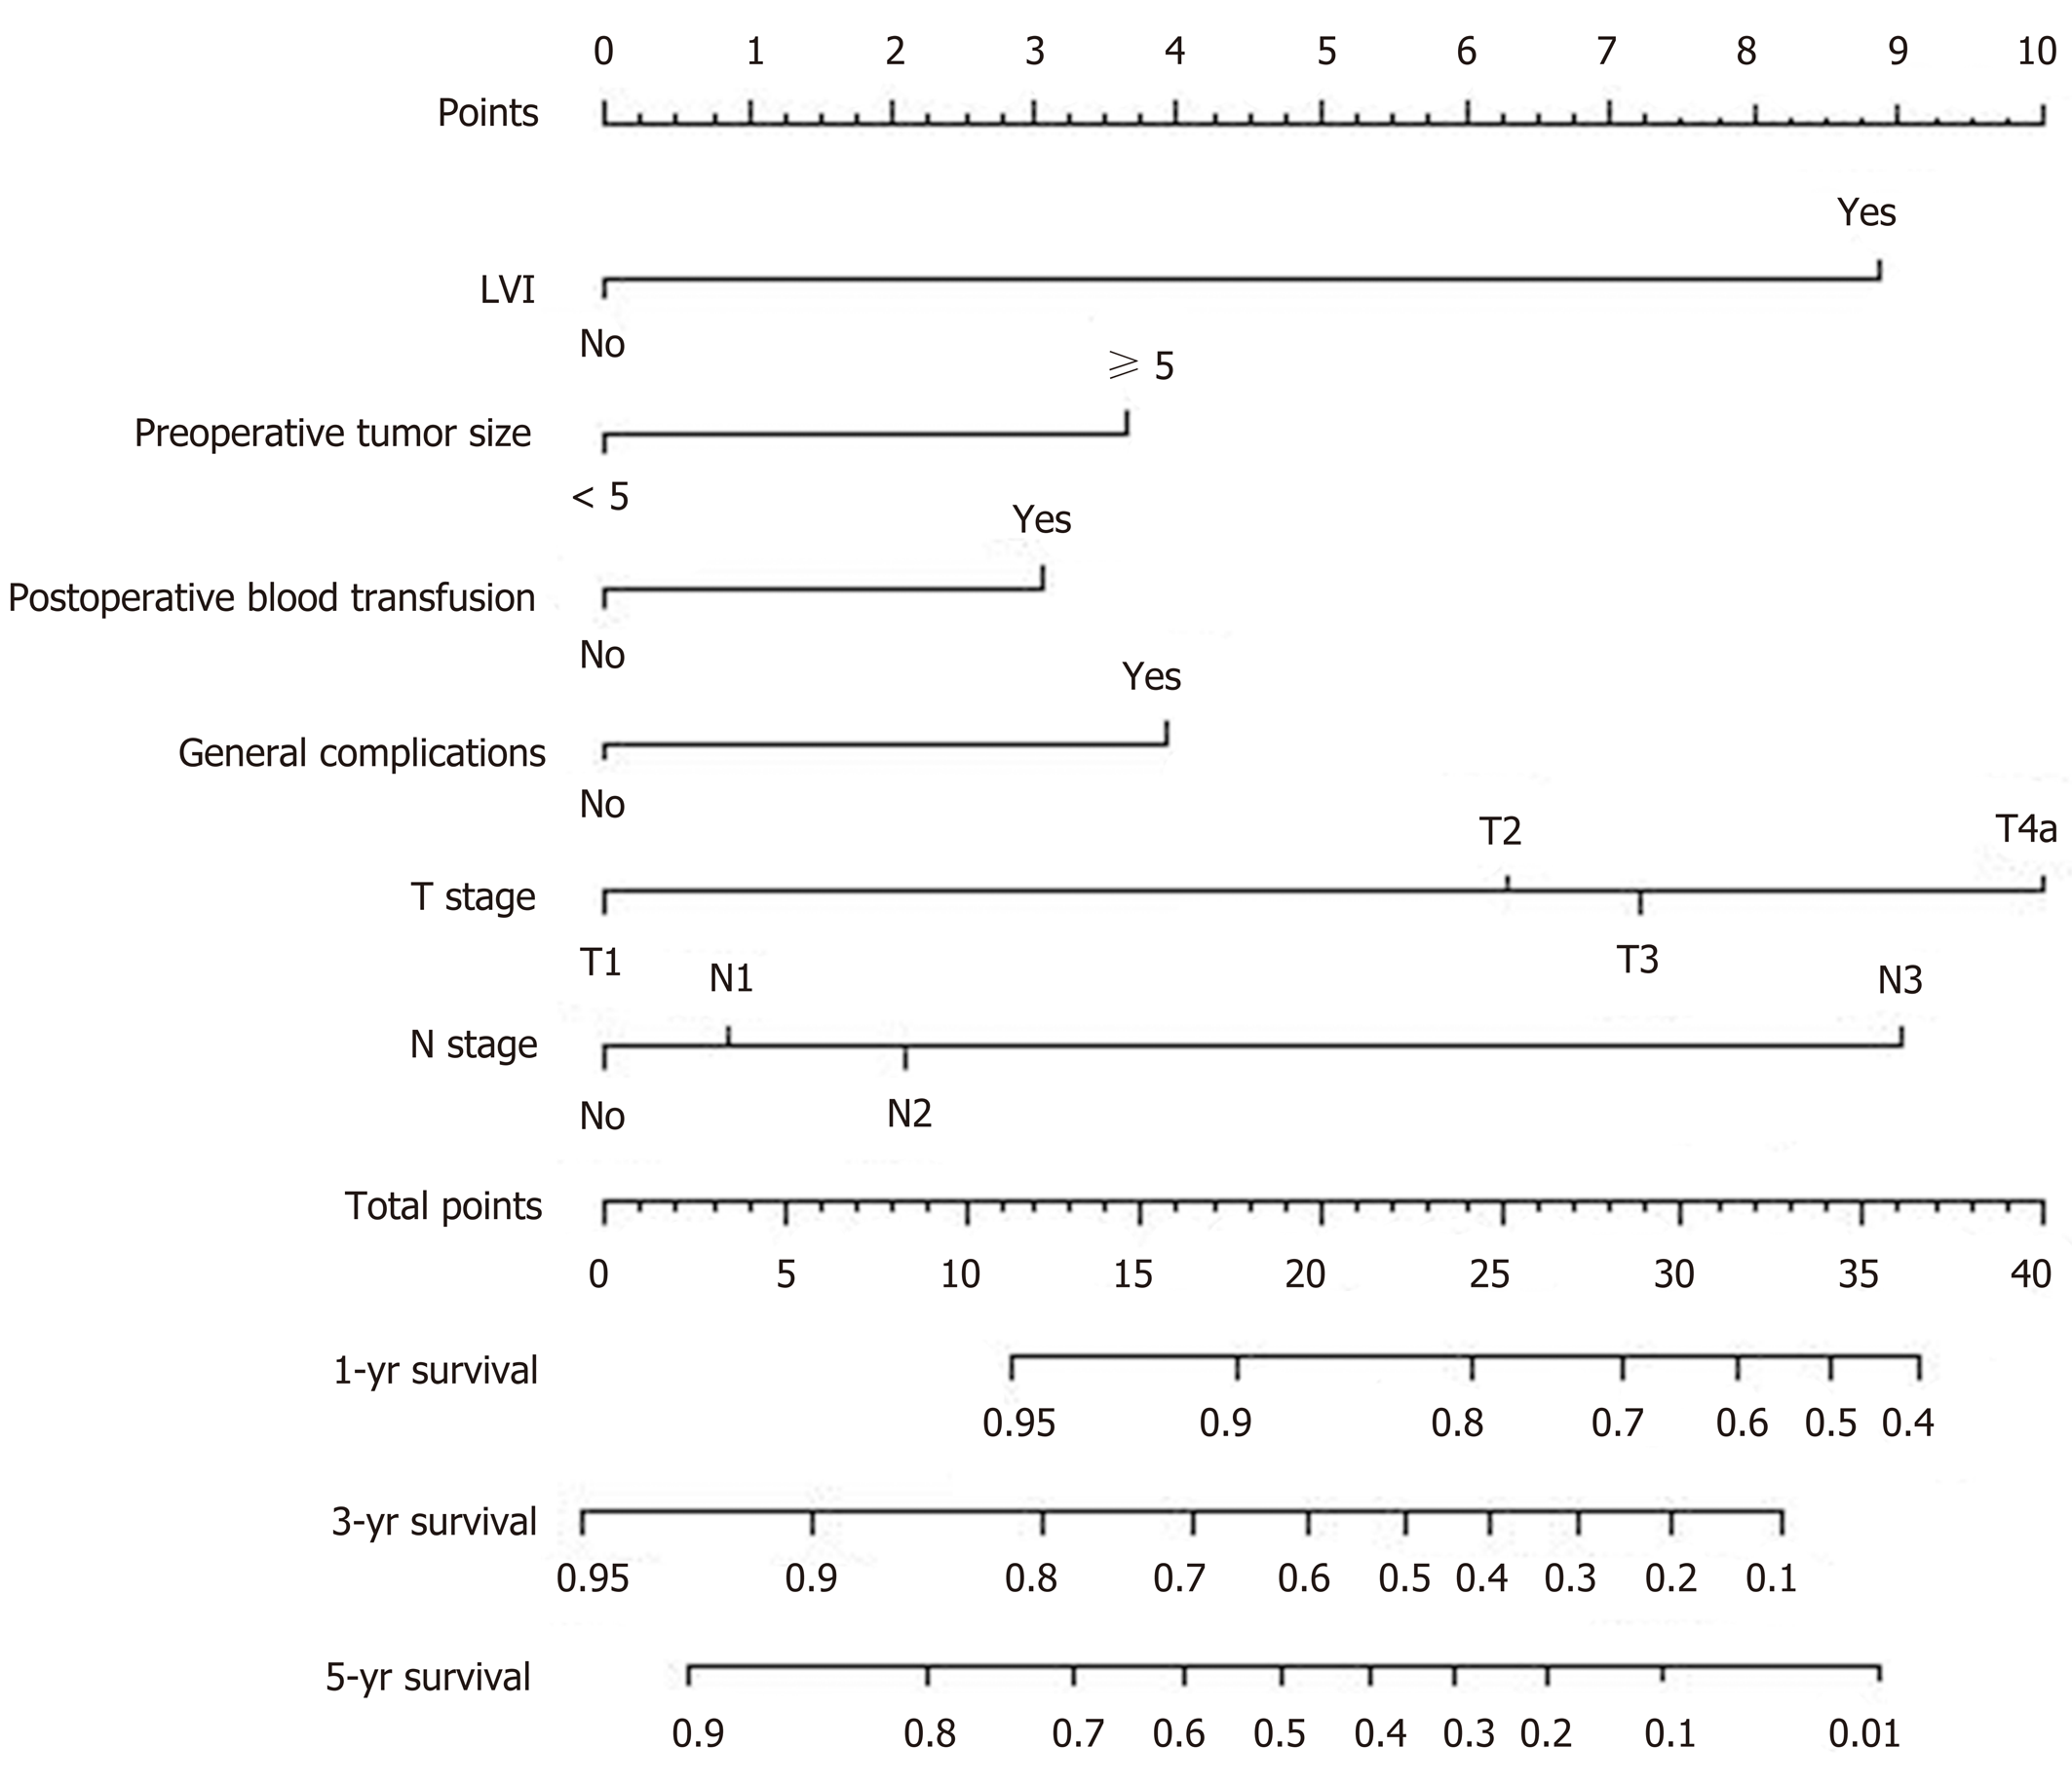
Figure 6 Nomogram for predicting overall survival in postoperative proximal gastric cancer patients (C-index = 0.
754).
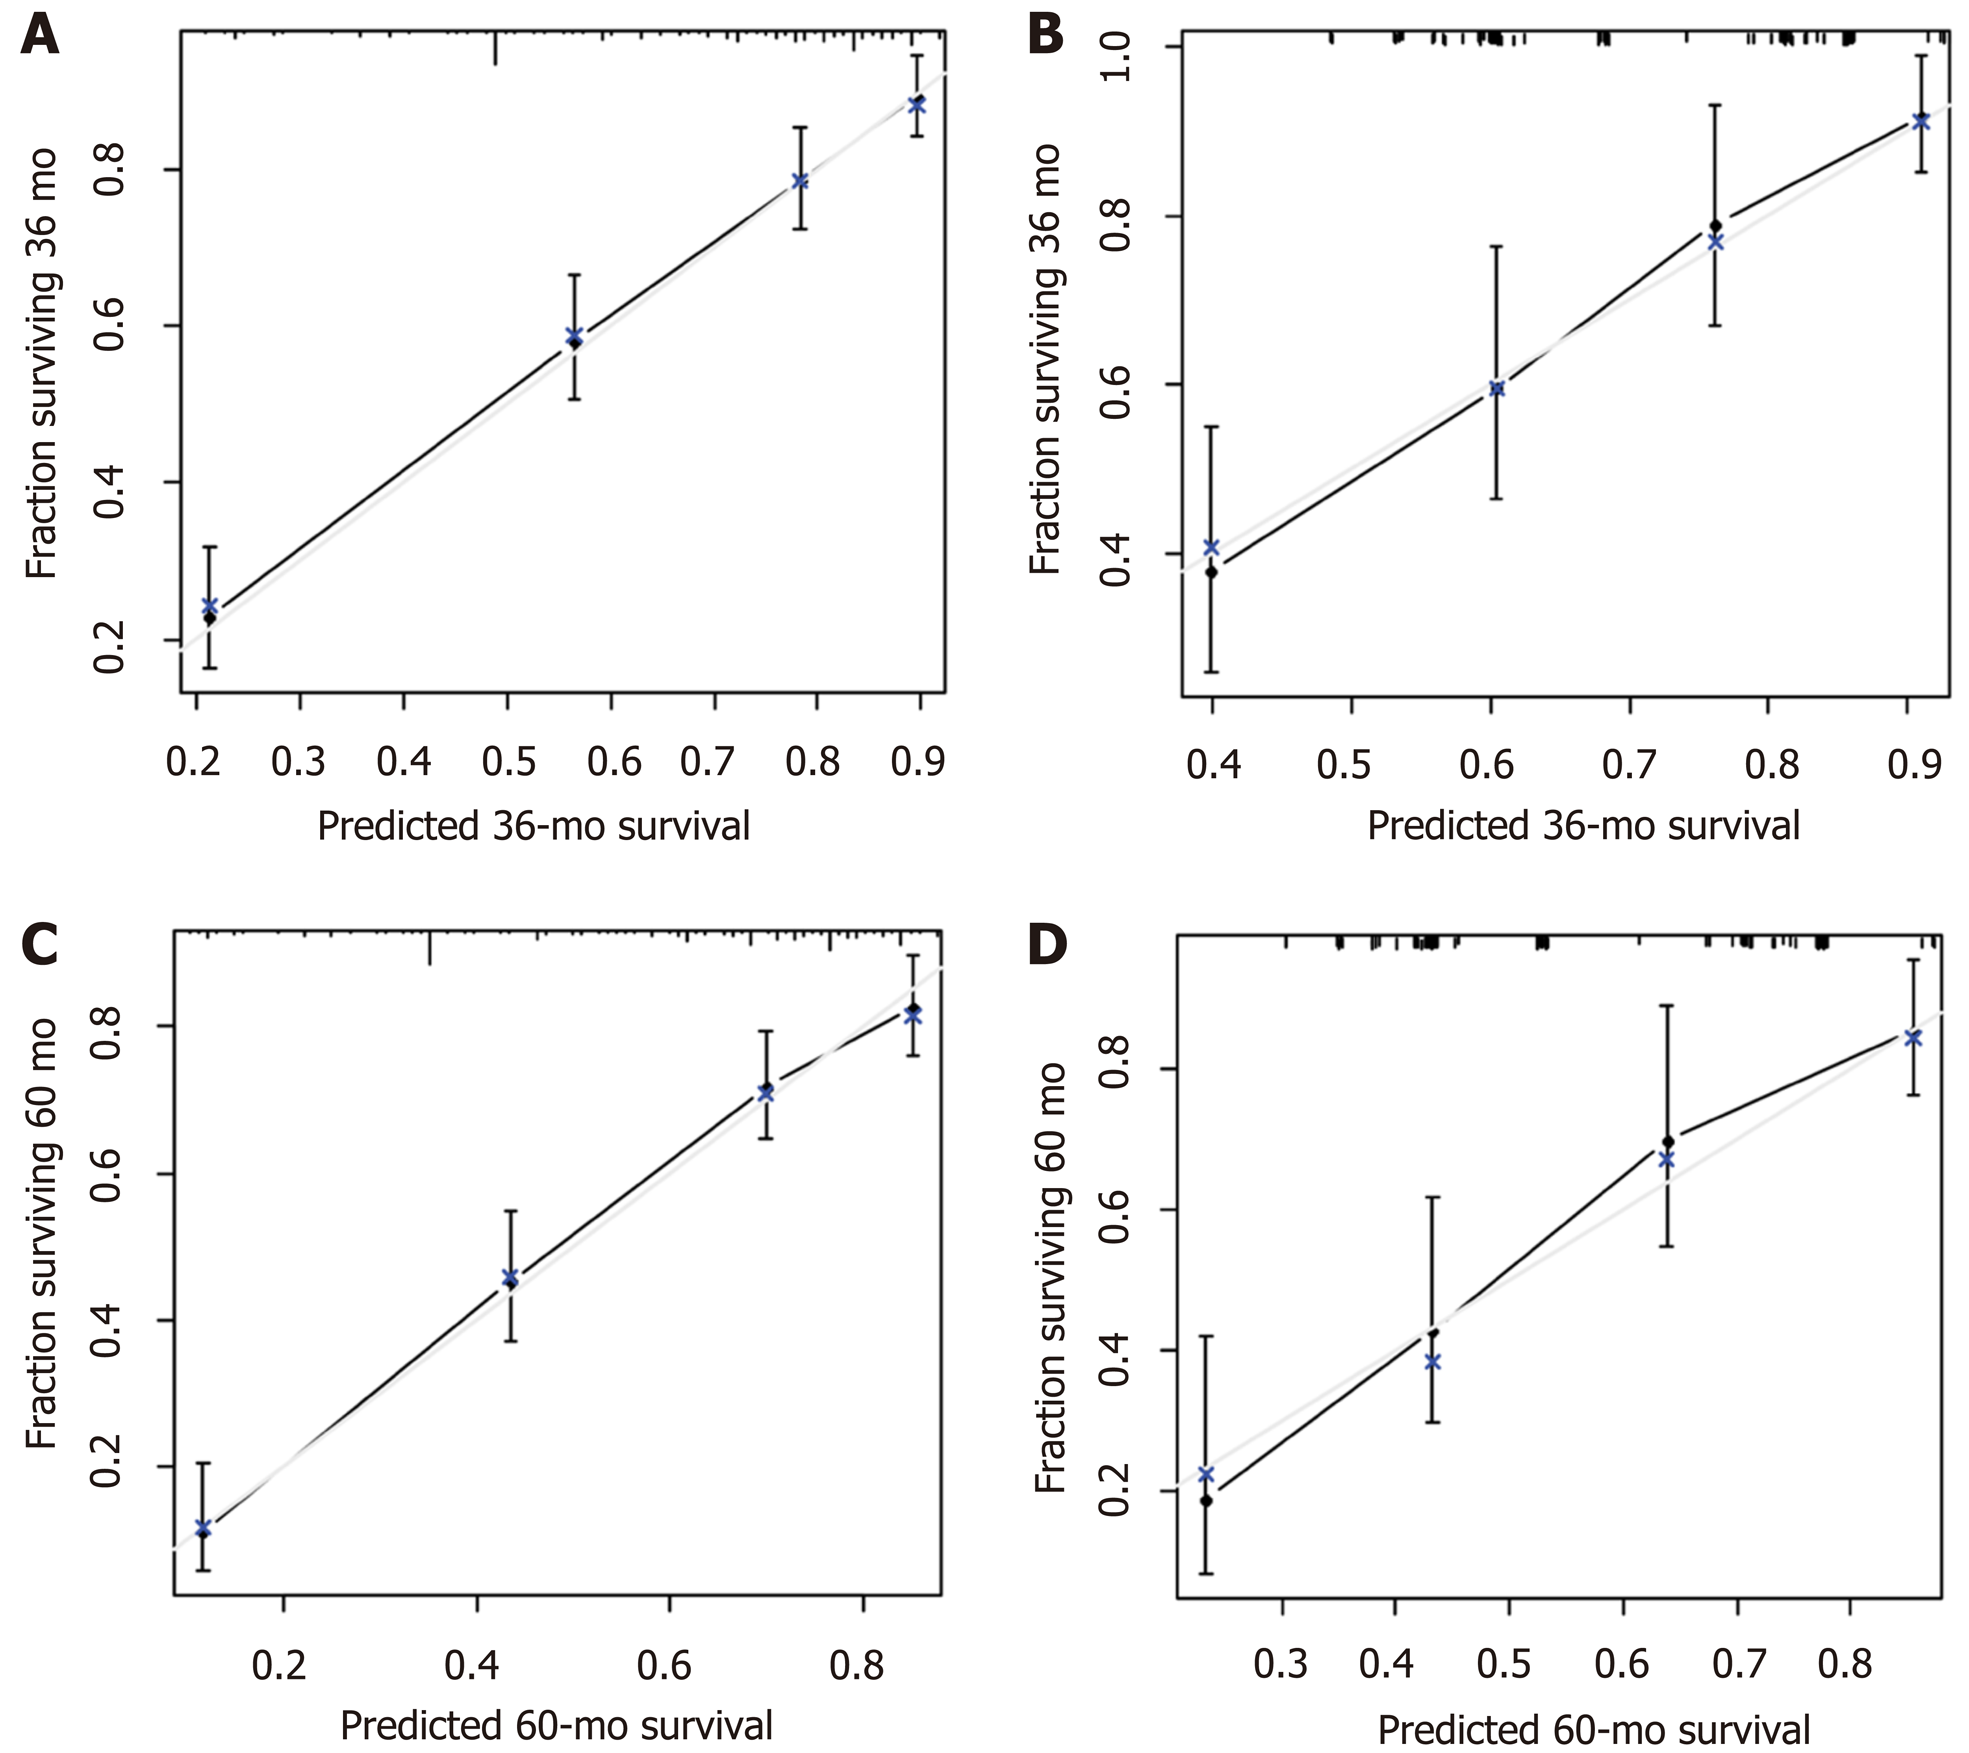
Figure 7 Postoperative nomogram 3-year and 5-year overall survival rate calibration curves.
A: Calibration curve for the postoperative nomogram for predicting the three-year OS using the training set; B: Calibration curve for the postoperative nomogram for predicting the three-year OS using the validation set; C: Calibration curve for the postoperative nomogram for predicting the five-year OS using the training set; D: Calibration curve for the postoperative nomogram for predicting the five-year OS using the validation set. OS: Overall survival.
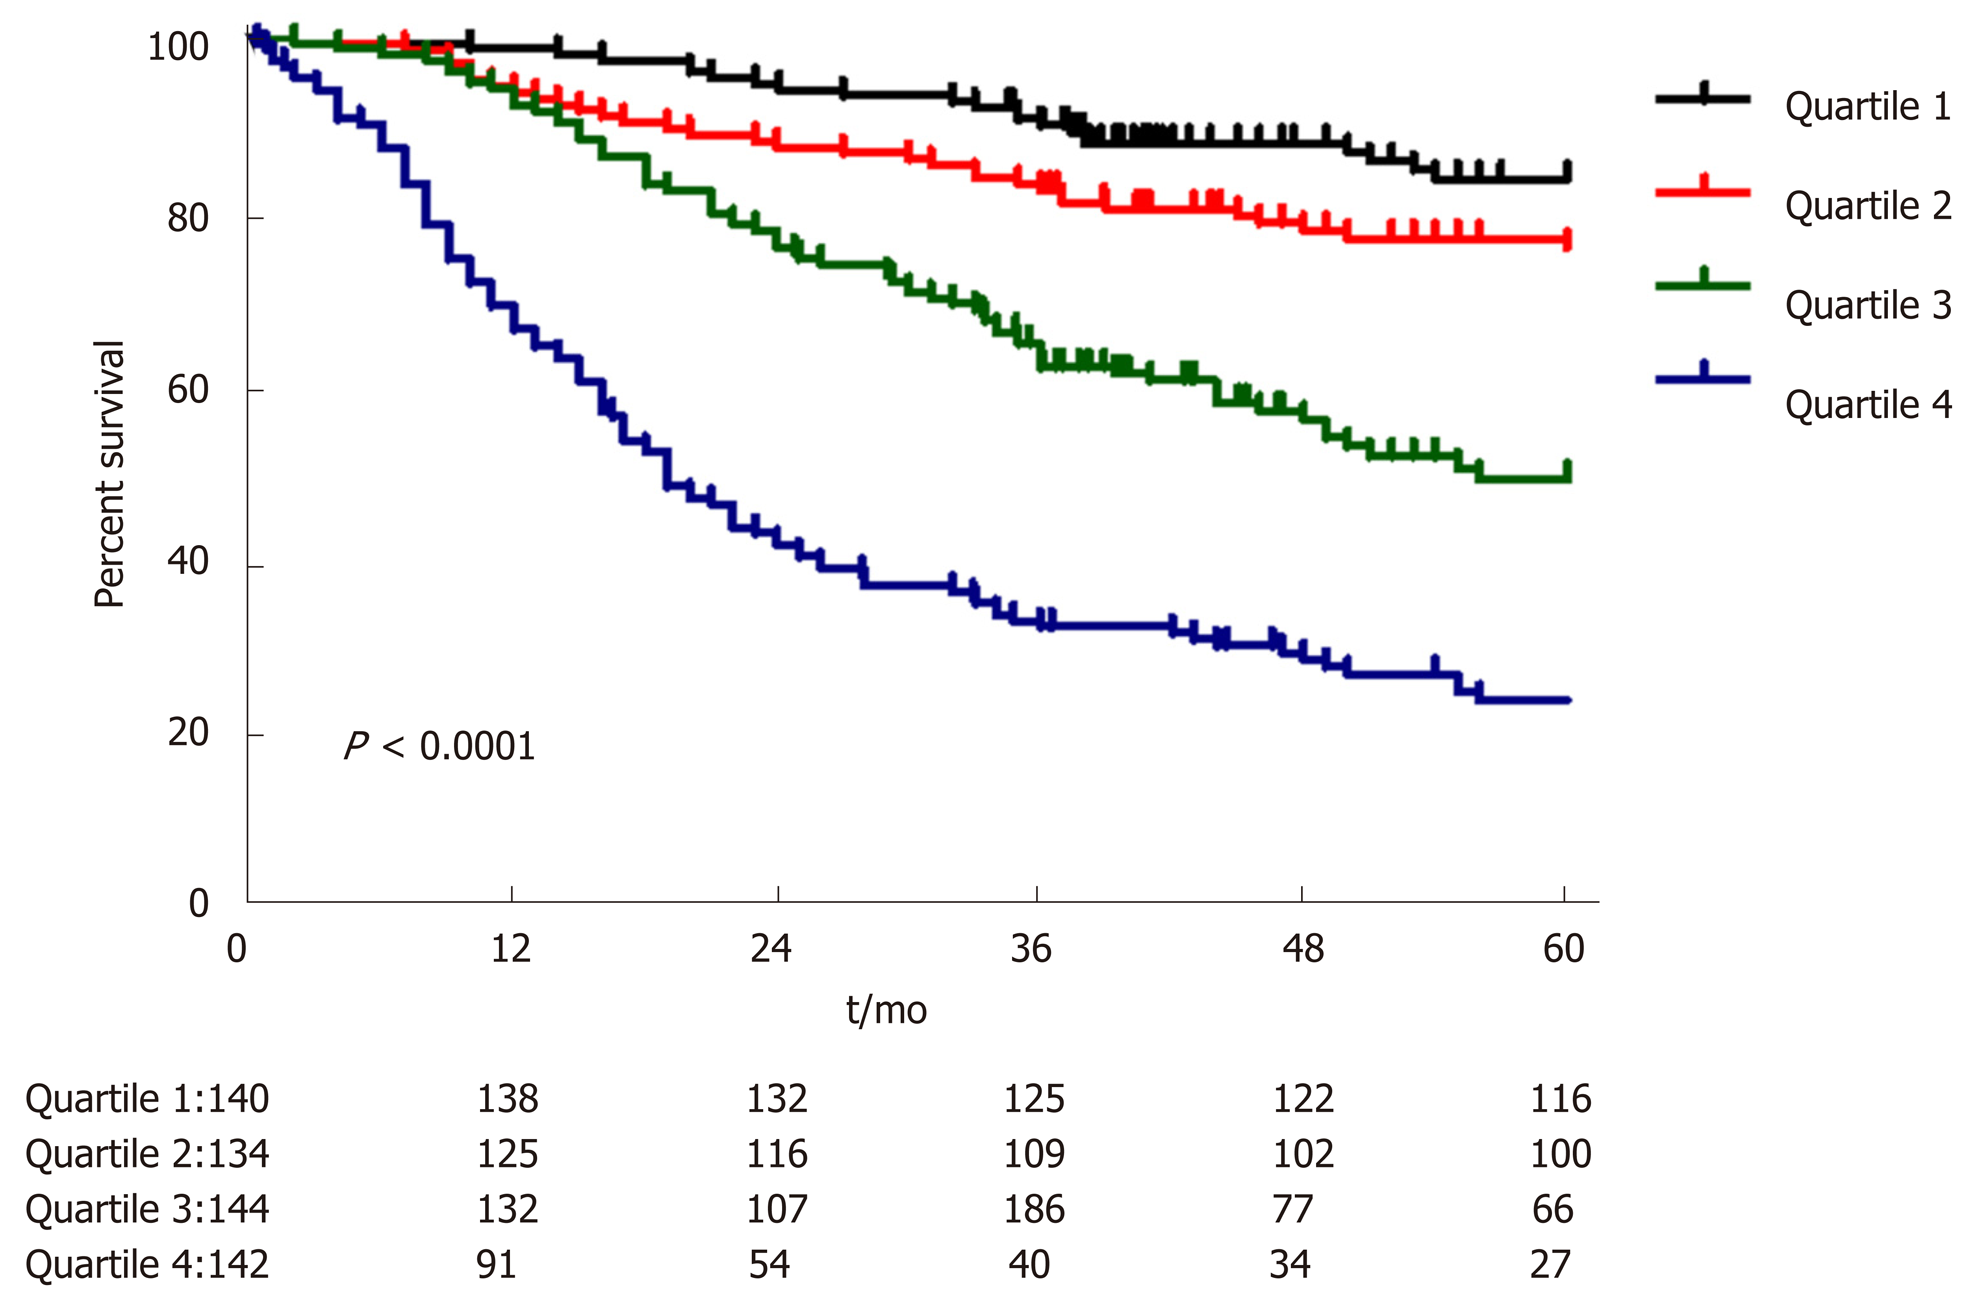
Figure 8 Survival curve cutoff points for the postoperative nomogram quartiles.
- Citation: Chen QY, Hong ZL, Zhong Q, Liu ZY, Huang XB, Que SJ, Li P, Xie JW, Wang JB, Lin JX, Lu J, Cao LL, Lin M, Tu RH, Zheng CH, Huang CM. Nomograms for pre- and postoperative prediction of long-term survival among proximal gastric cancer patients: A large-scale, single-center retrospective study. World J Clin Cases 2019; 7(21): 3419-3435
- URL: https://www.wjgnet.com/2307-8960/full/v7/i21/3419.htm
- DOI: https://dx.doi.org/10.12998/wjcc.v7.i21.3419


