©The Author(s) 2019.
World J Clin Cases. Jan 26, 2019; 7(2): 171-190
Published online Jan 26, 2019. doi: 10.12998/wjcc.v7.i2.171
Published online Jan 26, 2019. doi: 10.12998/wjcc.v7.i2.171
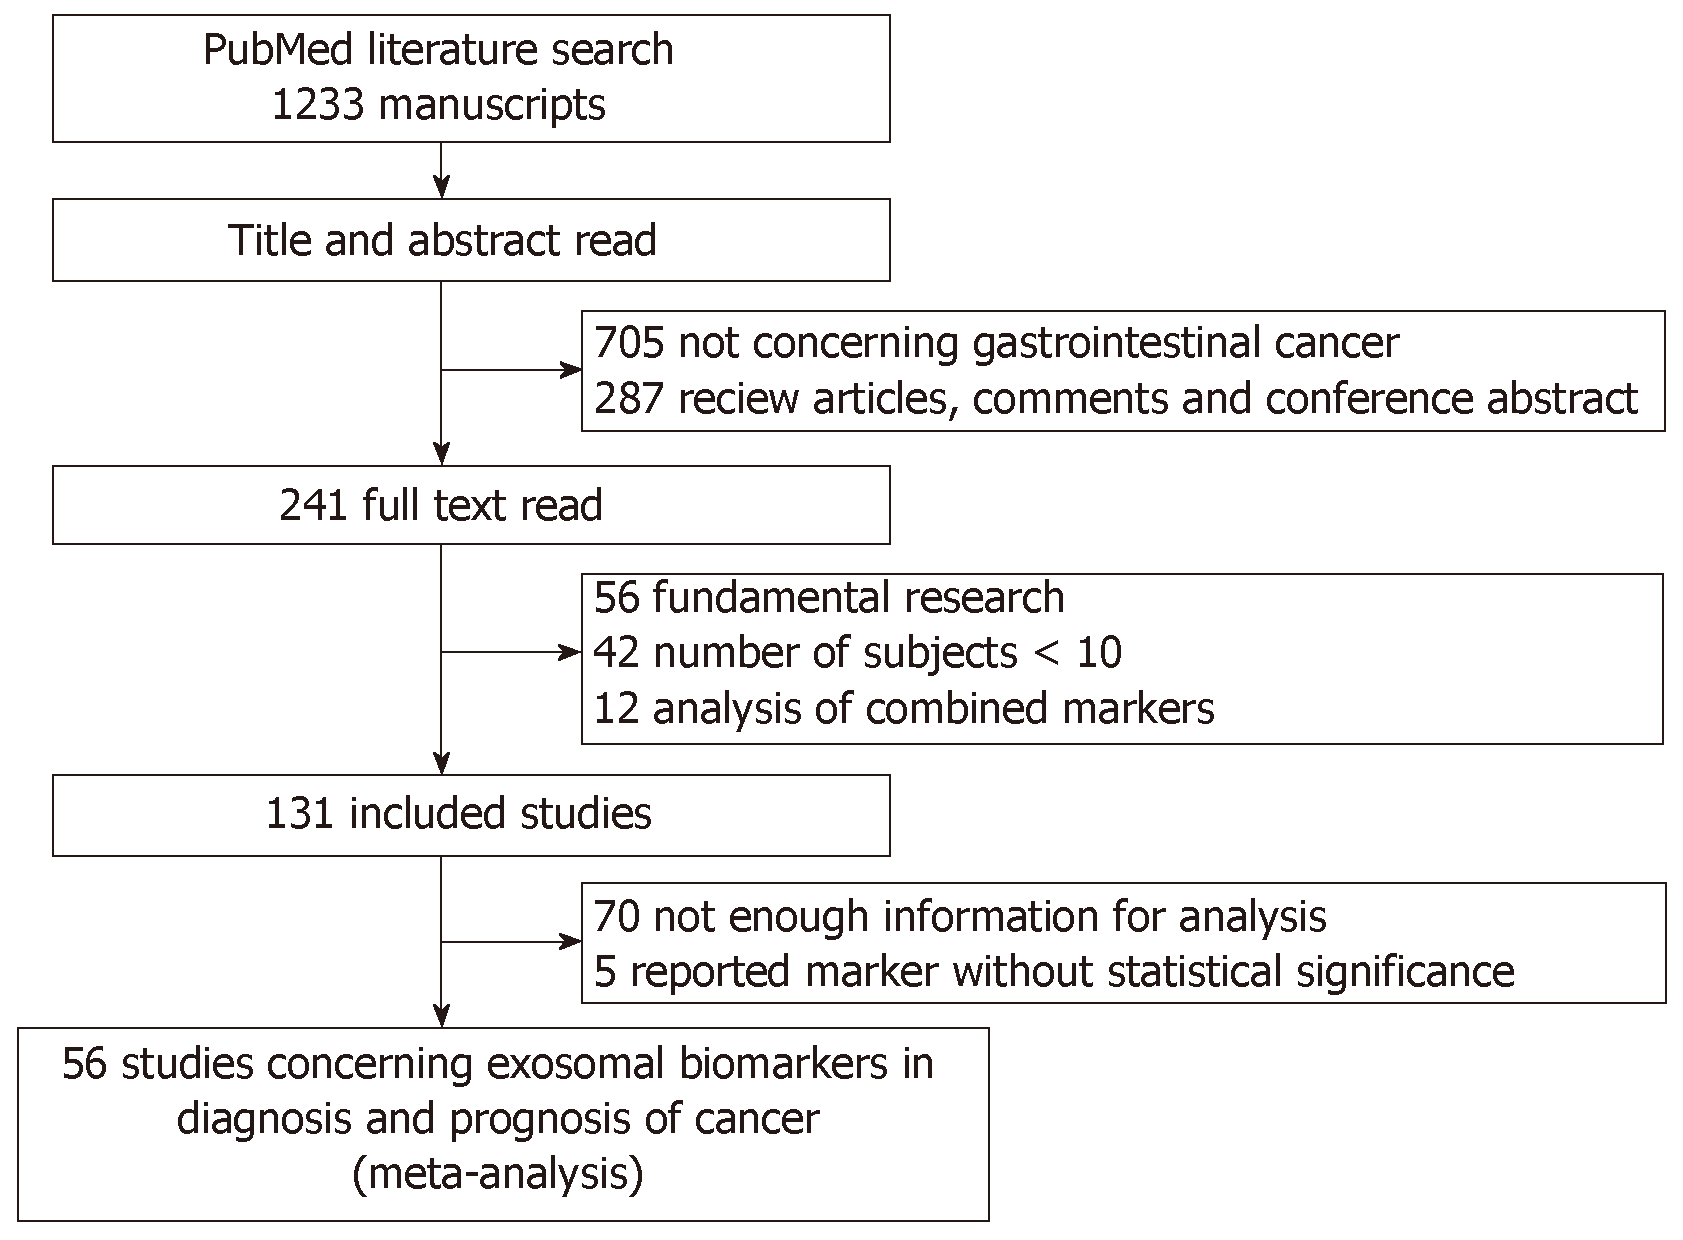
Figure 1 Literature search process to select studies which evaluated the diagnostic or prognostic performance of exosomal biomarkers in cancer.
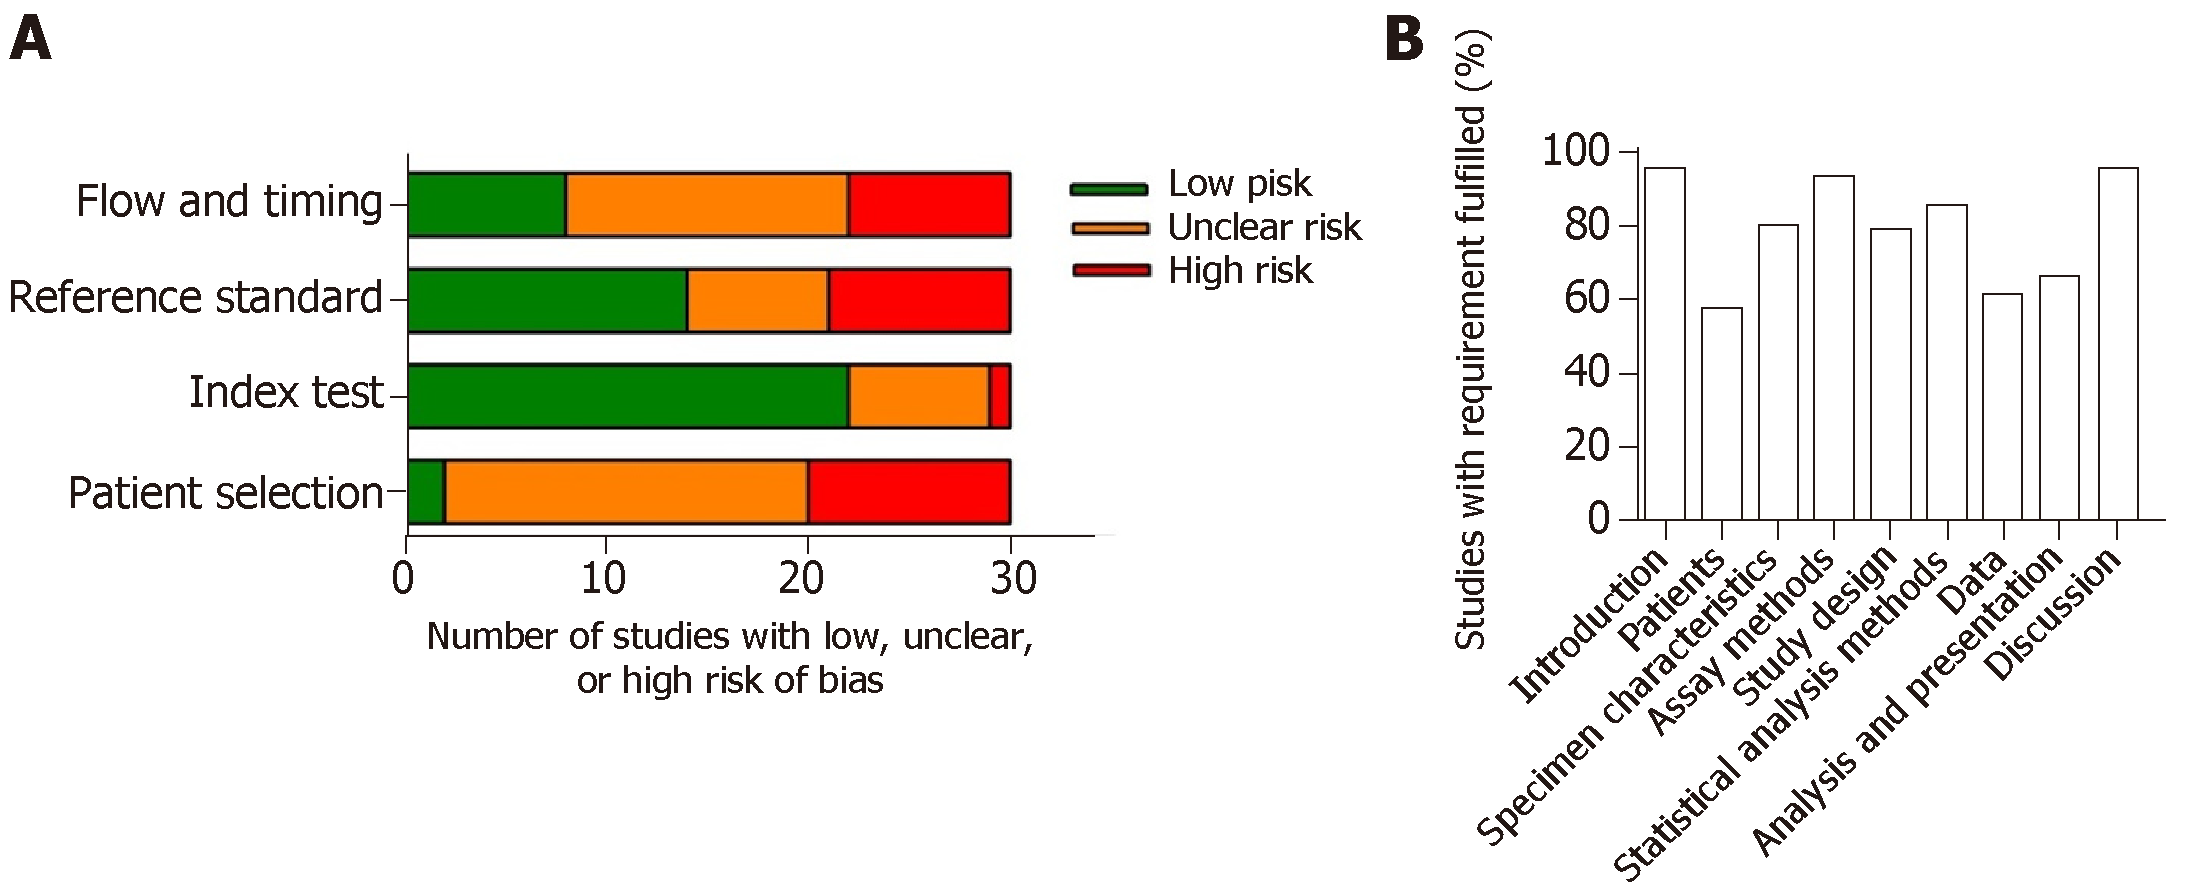
Figure 2 Quality assessment of the studies in this meta-analysis.
A: QUADAS-2 system was used to assess the quality of diagnostic studies; B: REMARK checklist was used to assess the quality of prognostic studies.
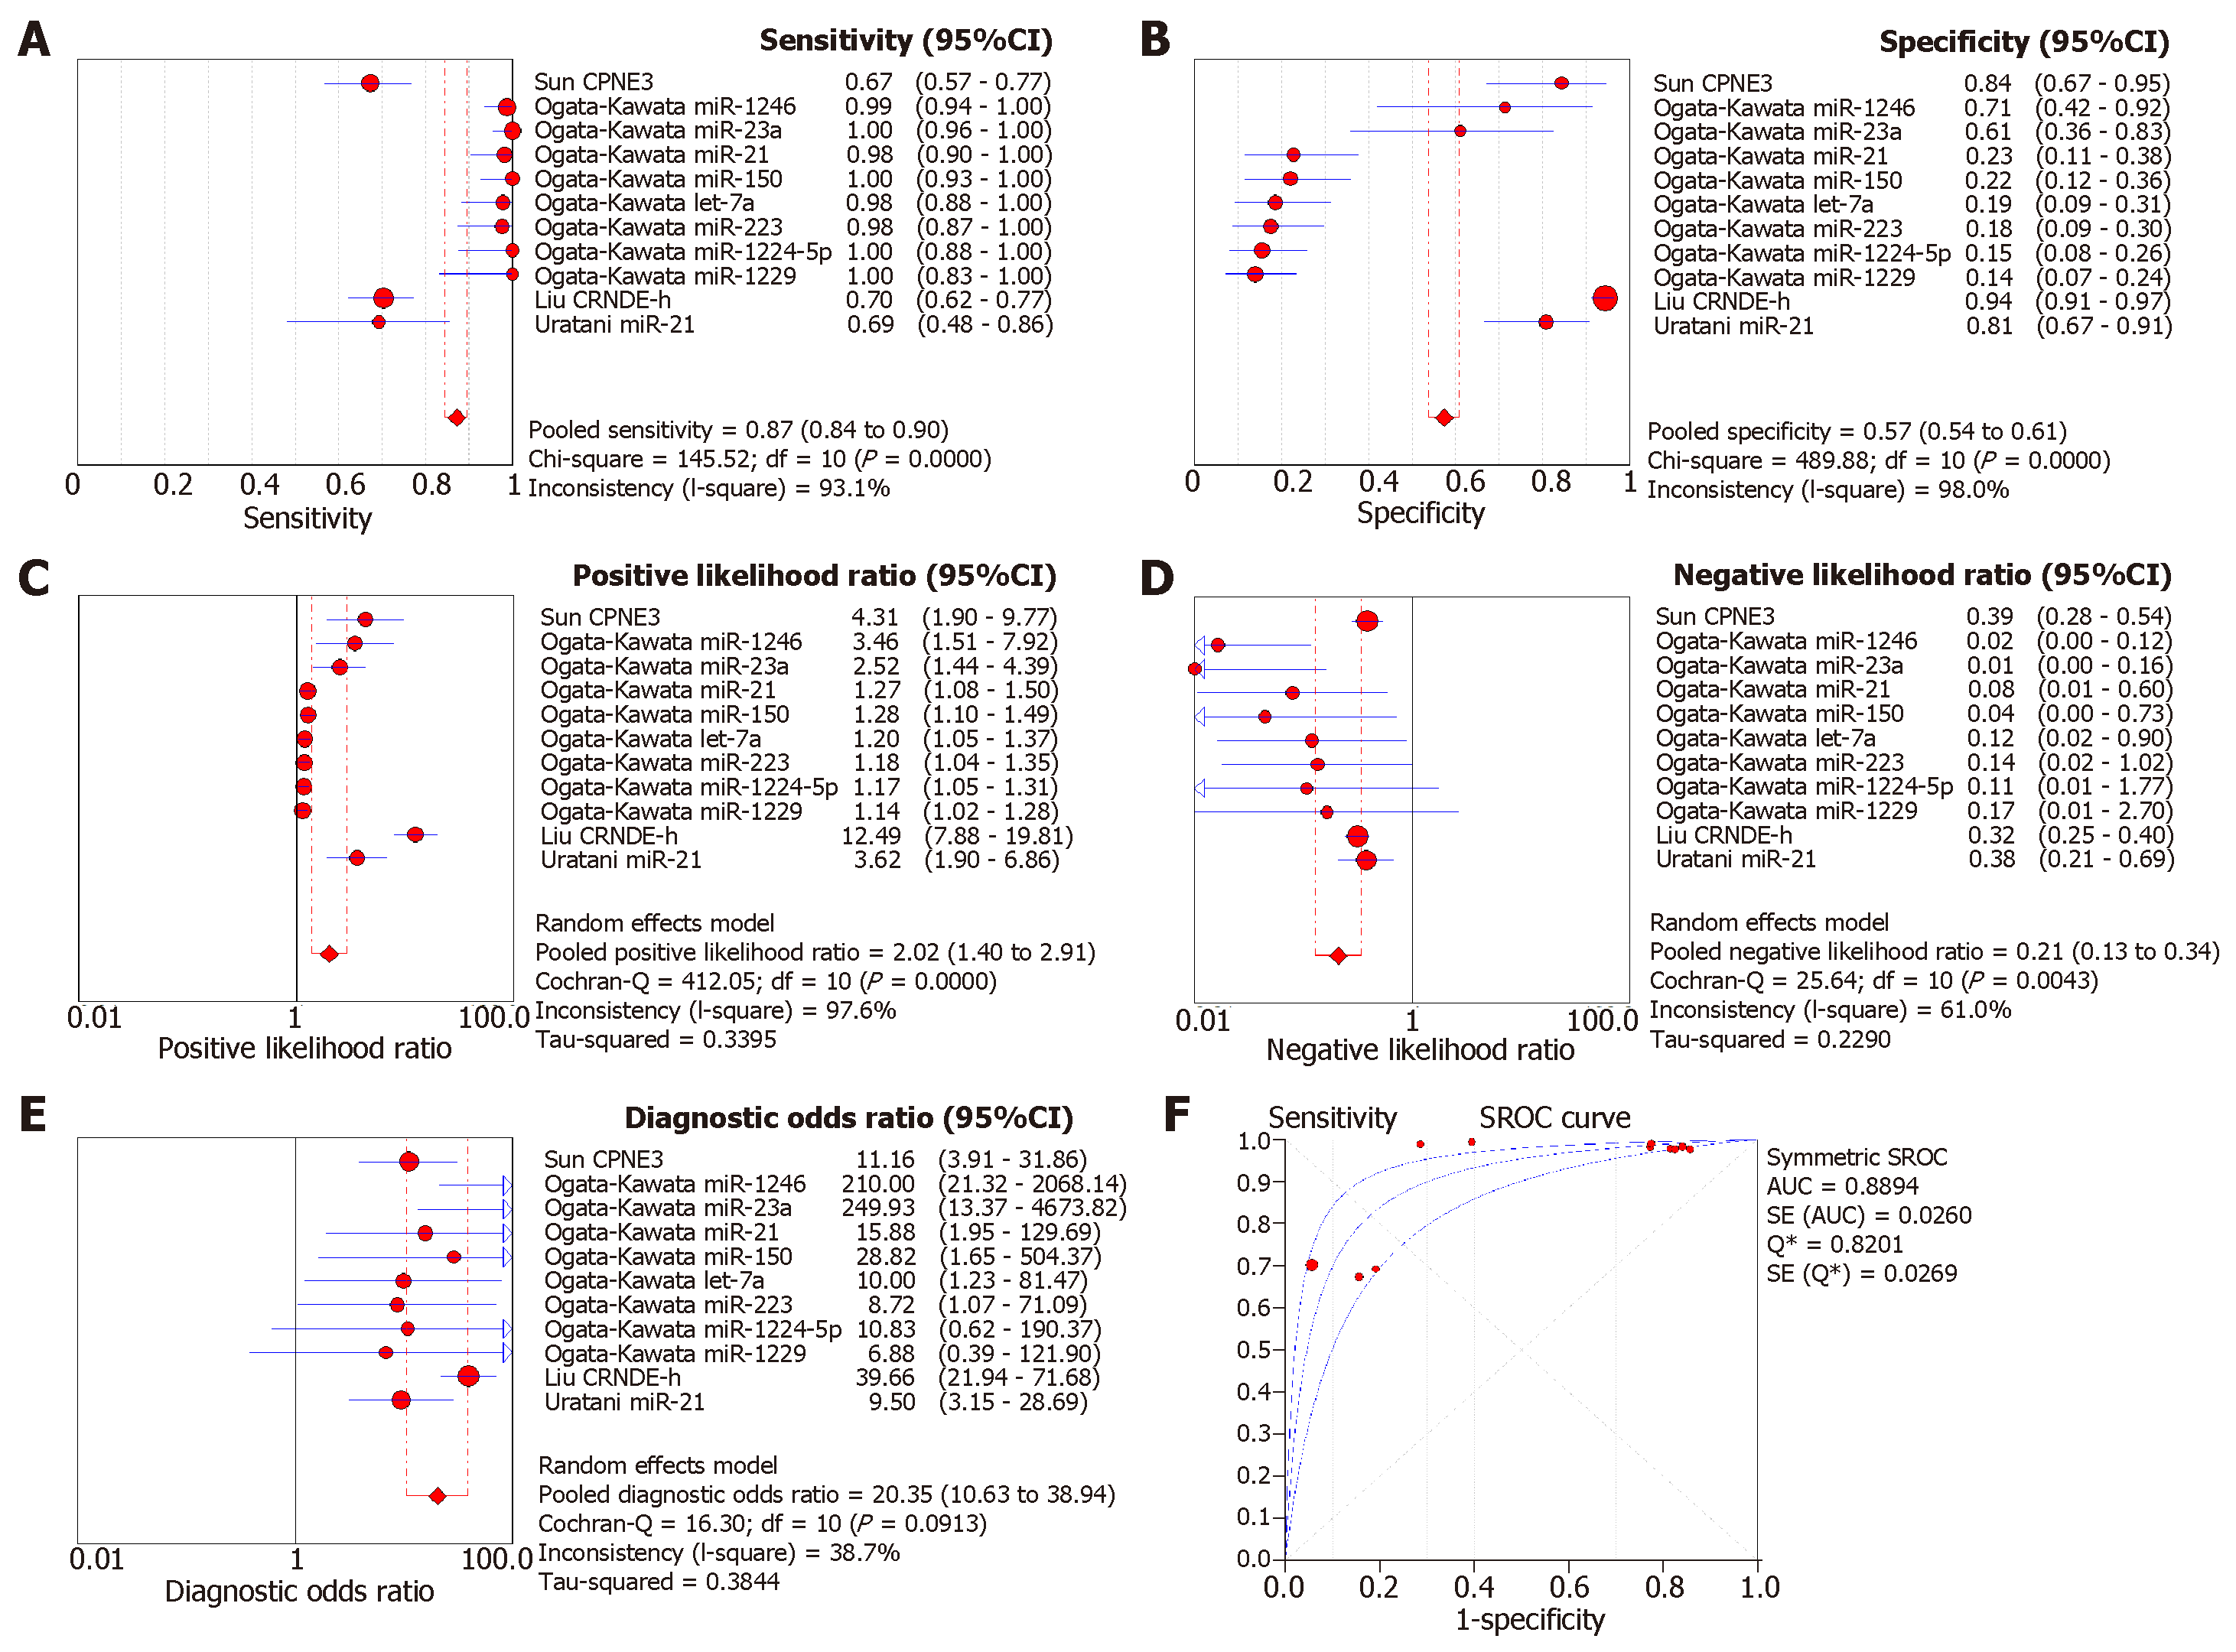
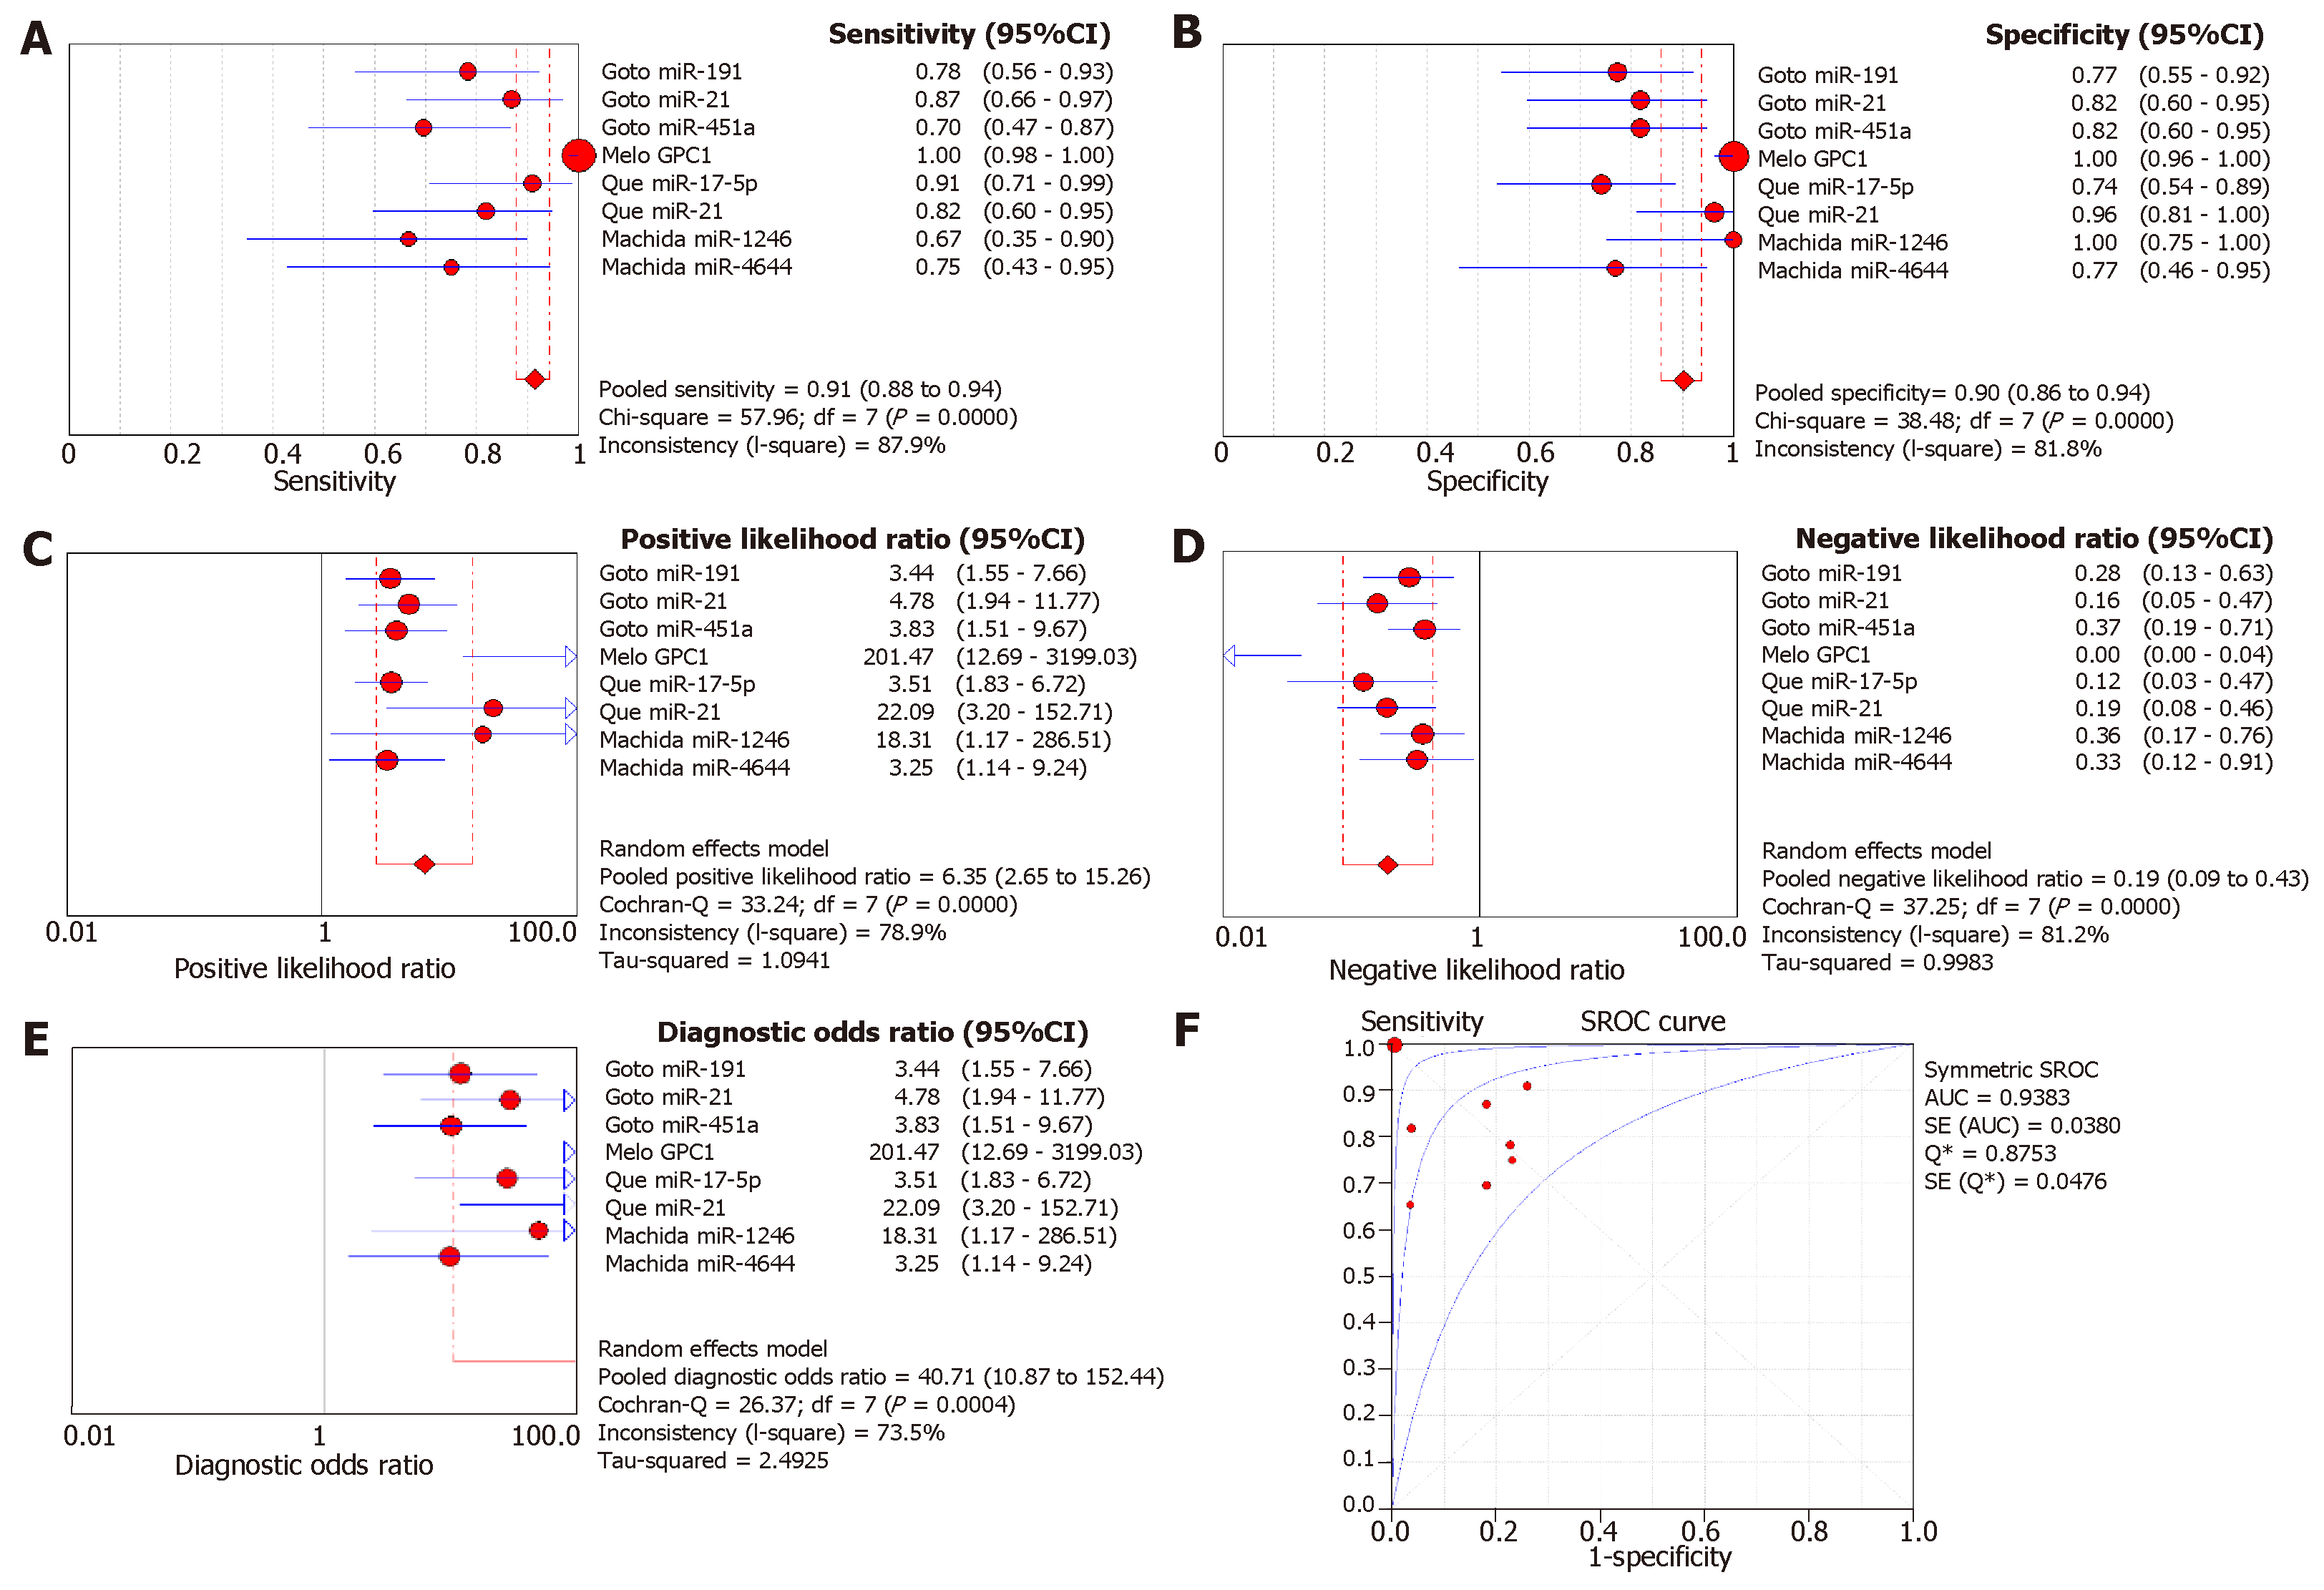
Figure 3 Forest plot of pooled (A) sensitivity, (B) specificity, (C) positive likelihood ratio, (D) negative likelihood ratio, (E) diagnostic odds ratio and (F) SROC curve of exosomal biomarkers in diagnosis of colon cancer.
SROC: Summary receiver operating characteristic.
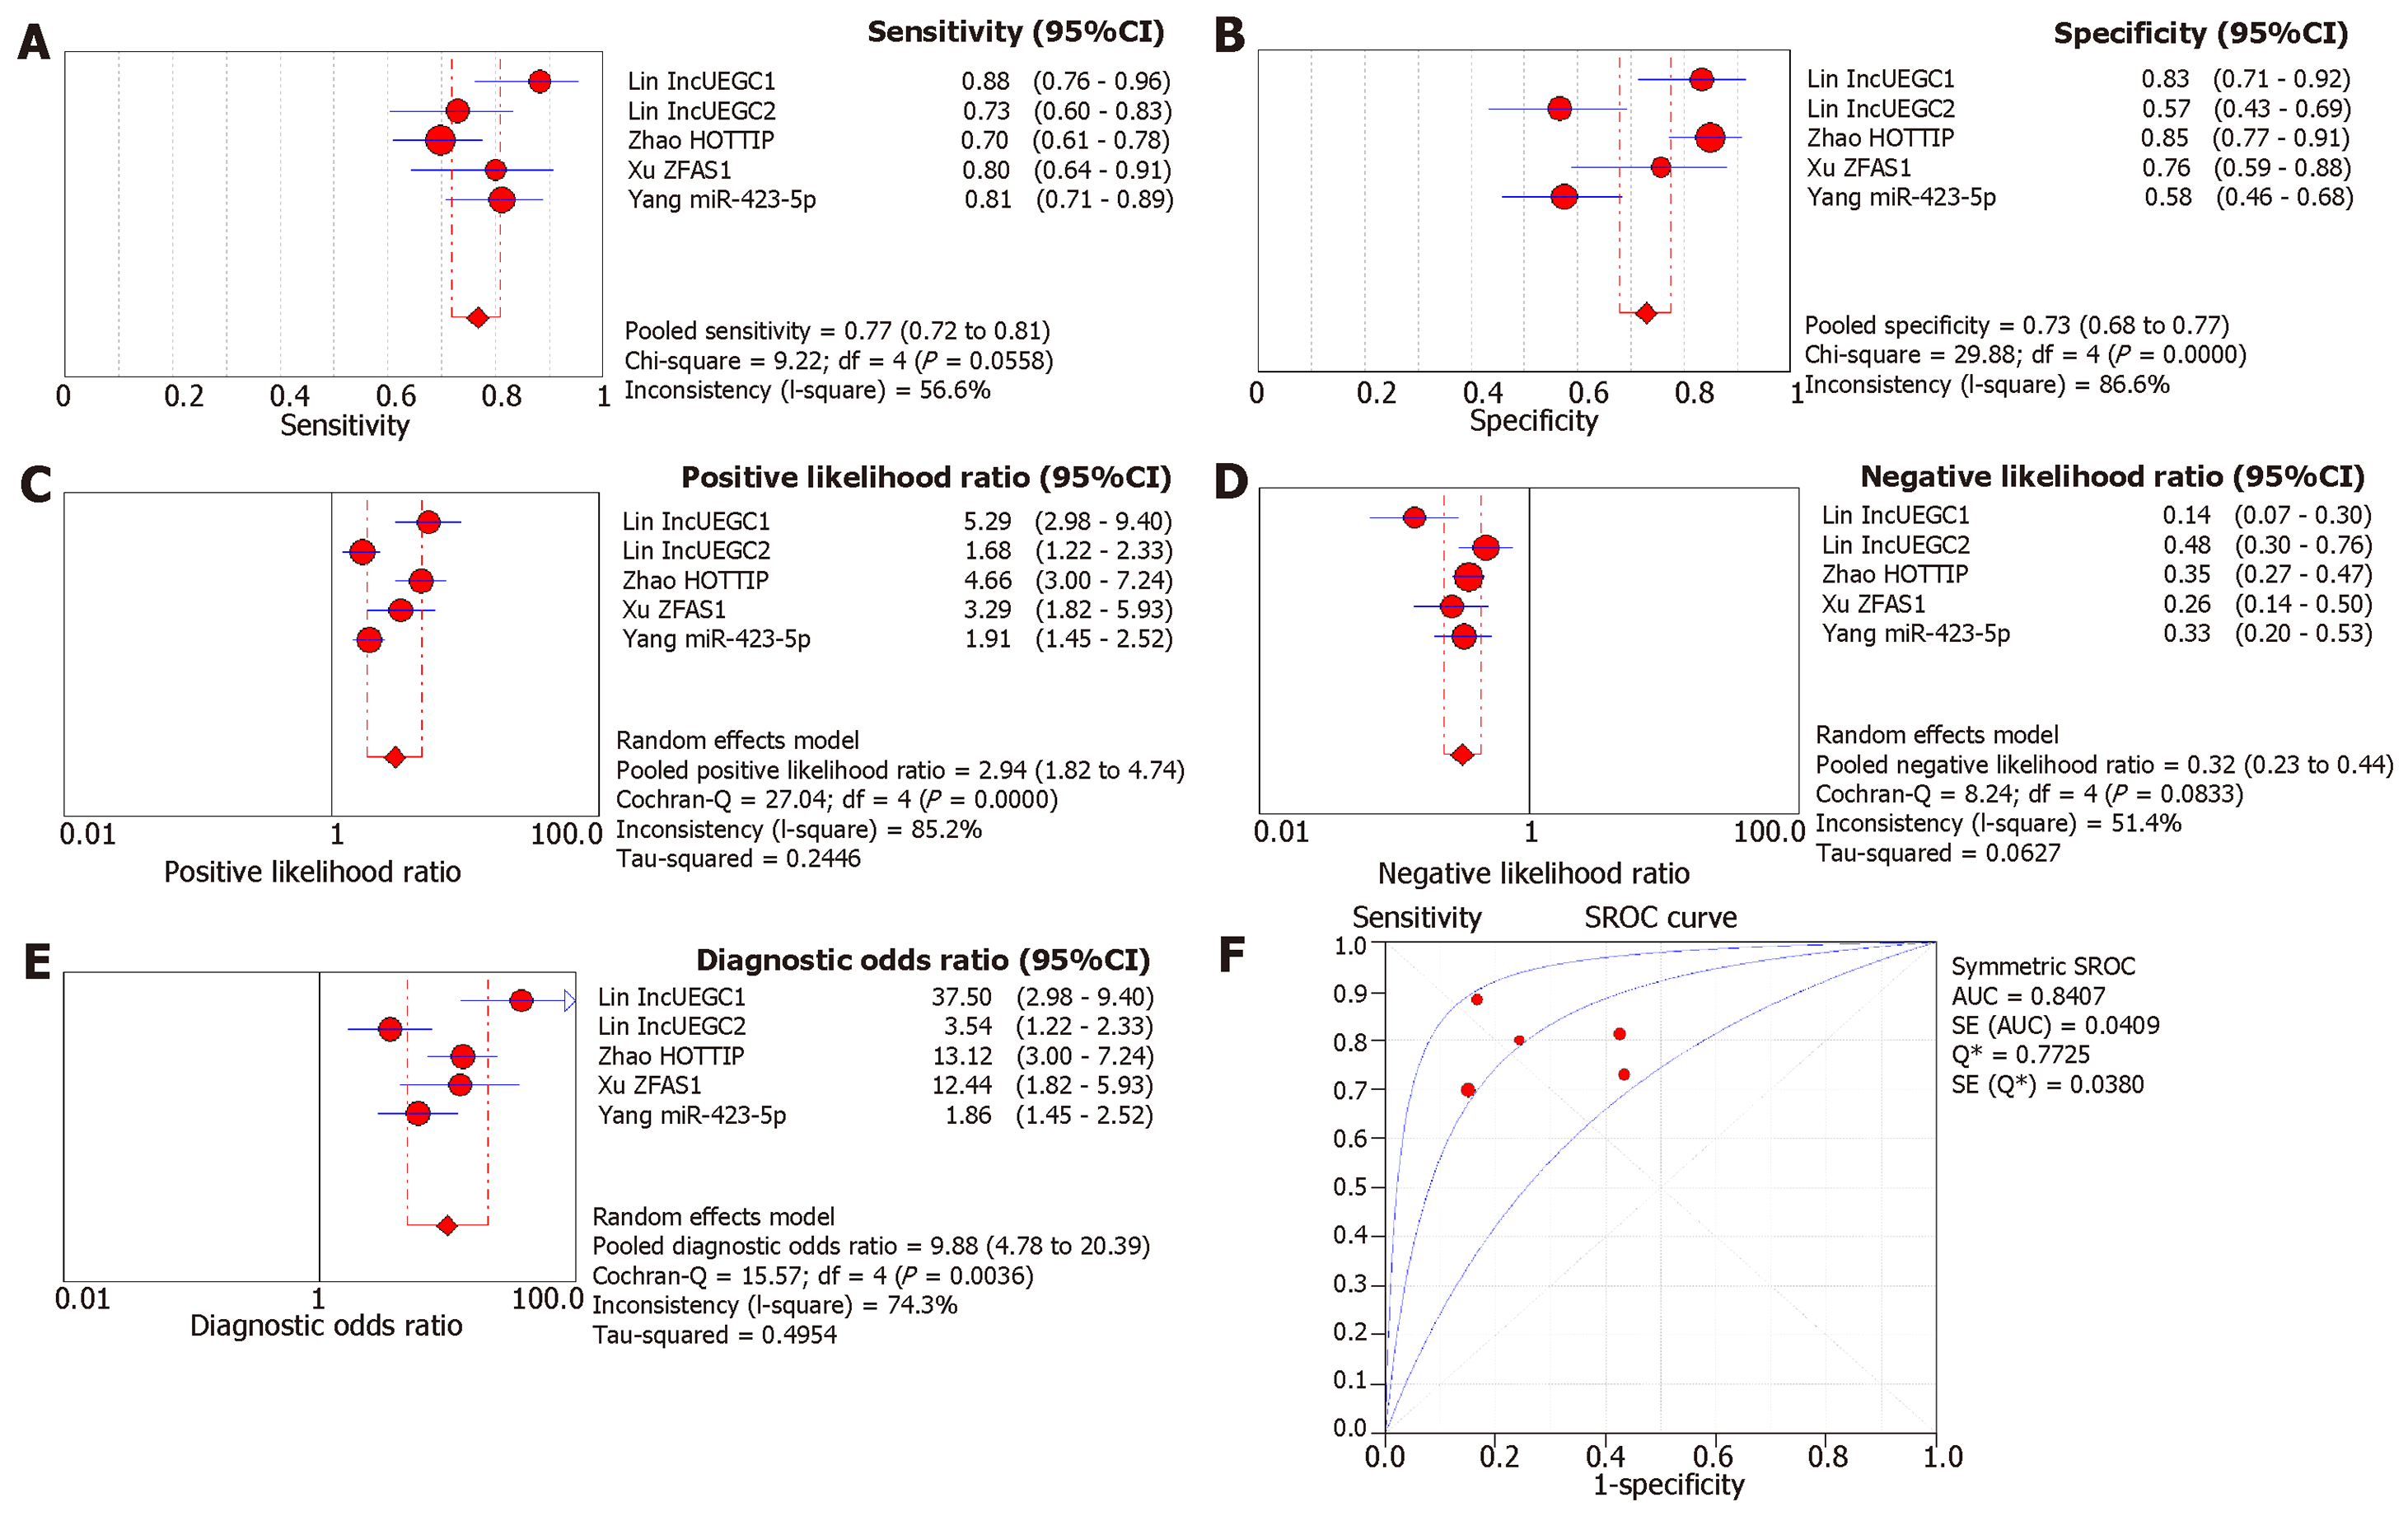
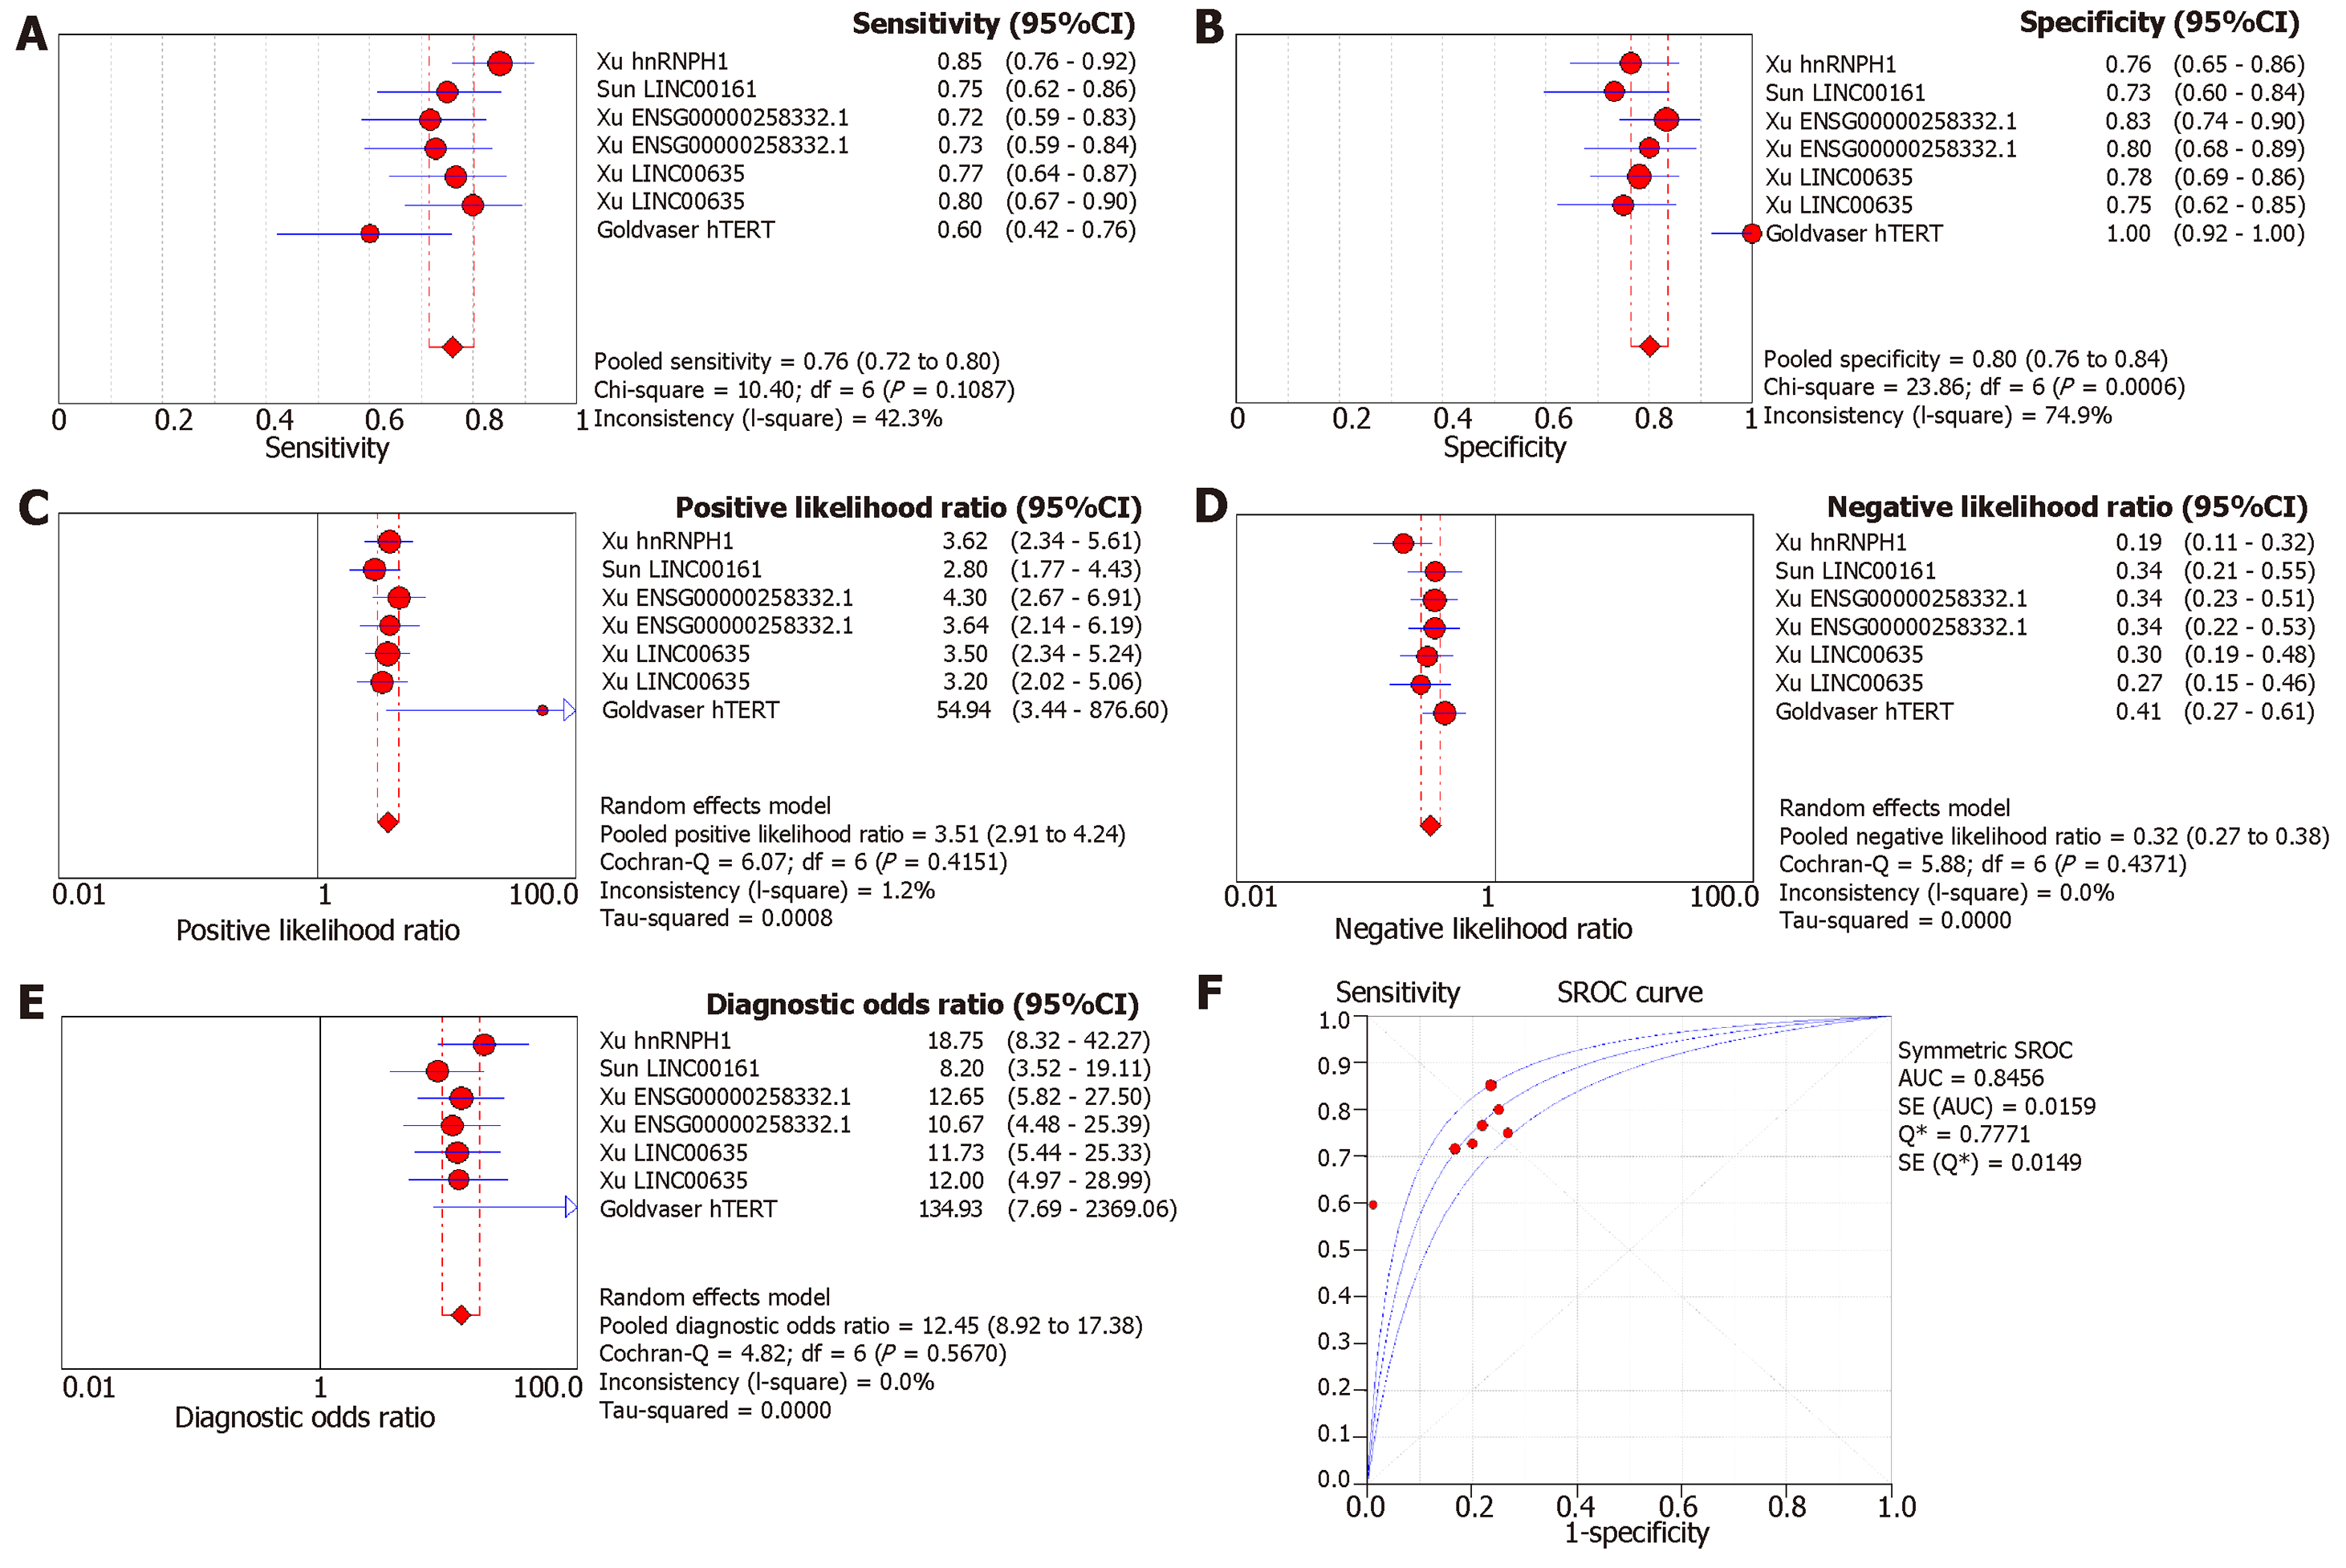
Figure 4 Forest plot of pooled (A) sensitivity, (B) specificity, (C) positive likelihood ratio, (D) negative likelihood ratio, (E) diagnostic odds ratio, and (F) SROC curve of exosomal biomarkers in diagnosis of gastric cancer.
SROC: Summary receiver operating characteristic.
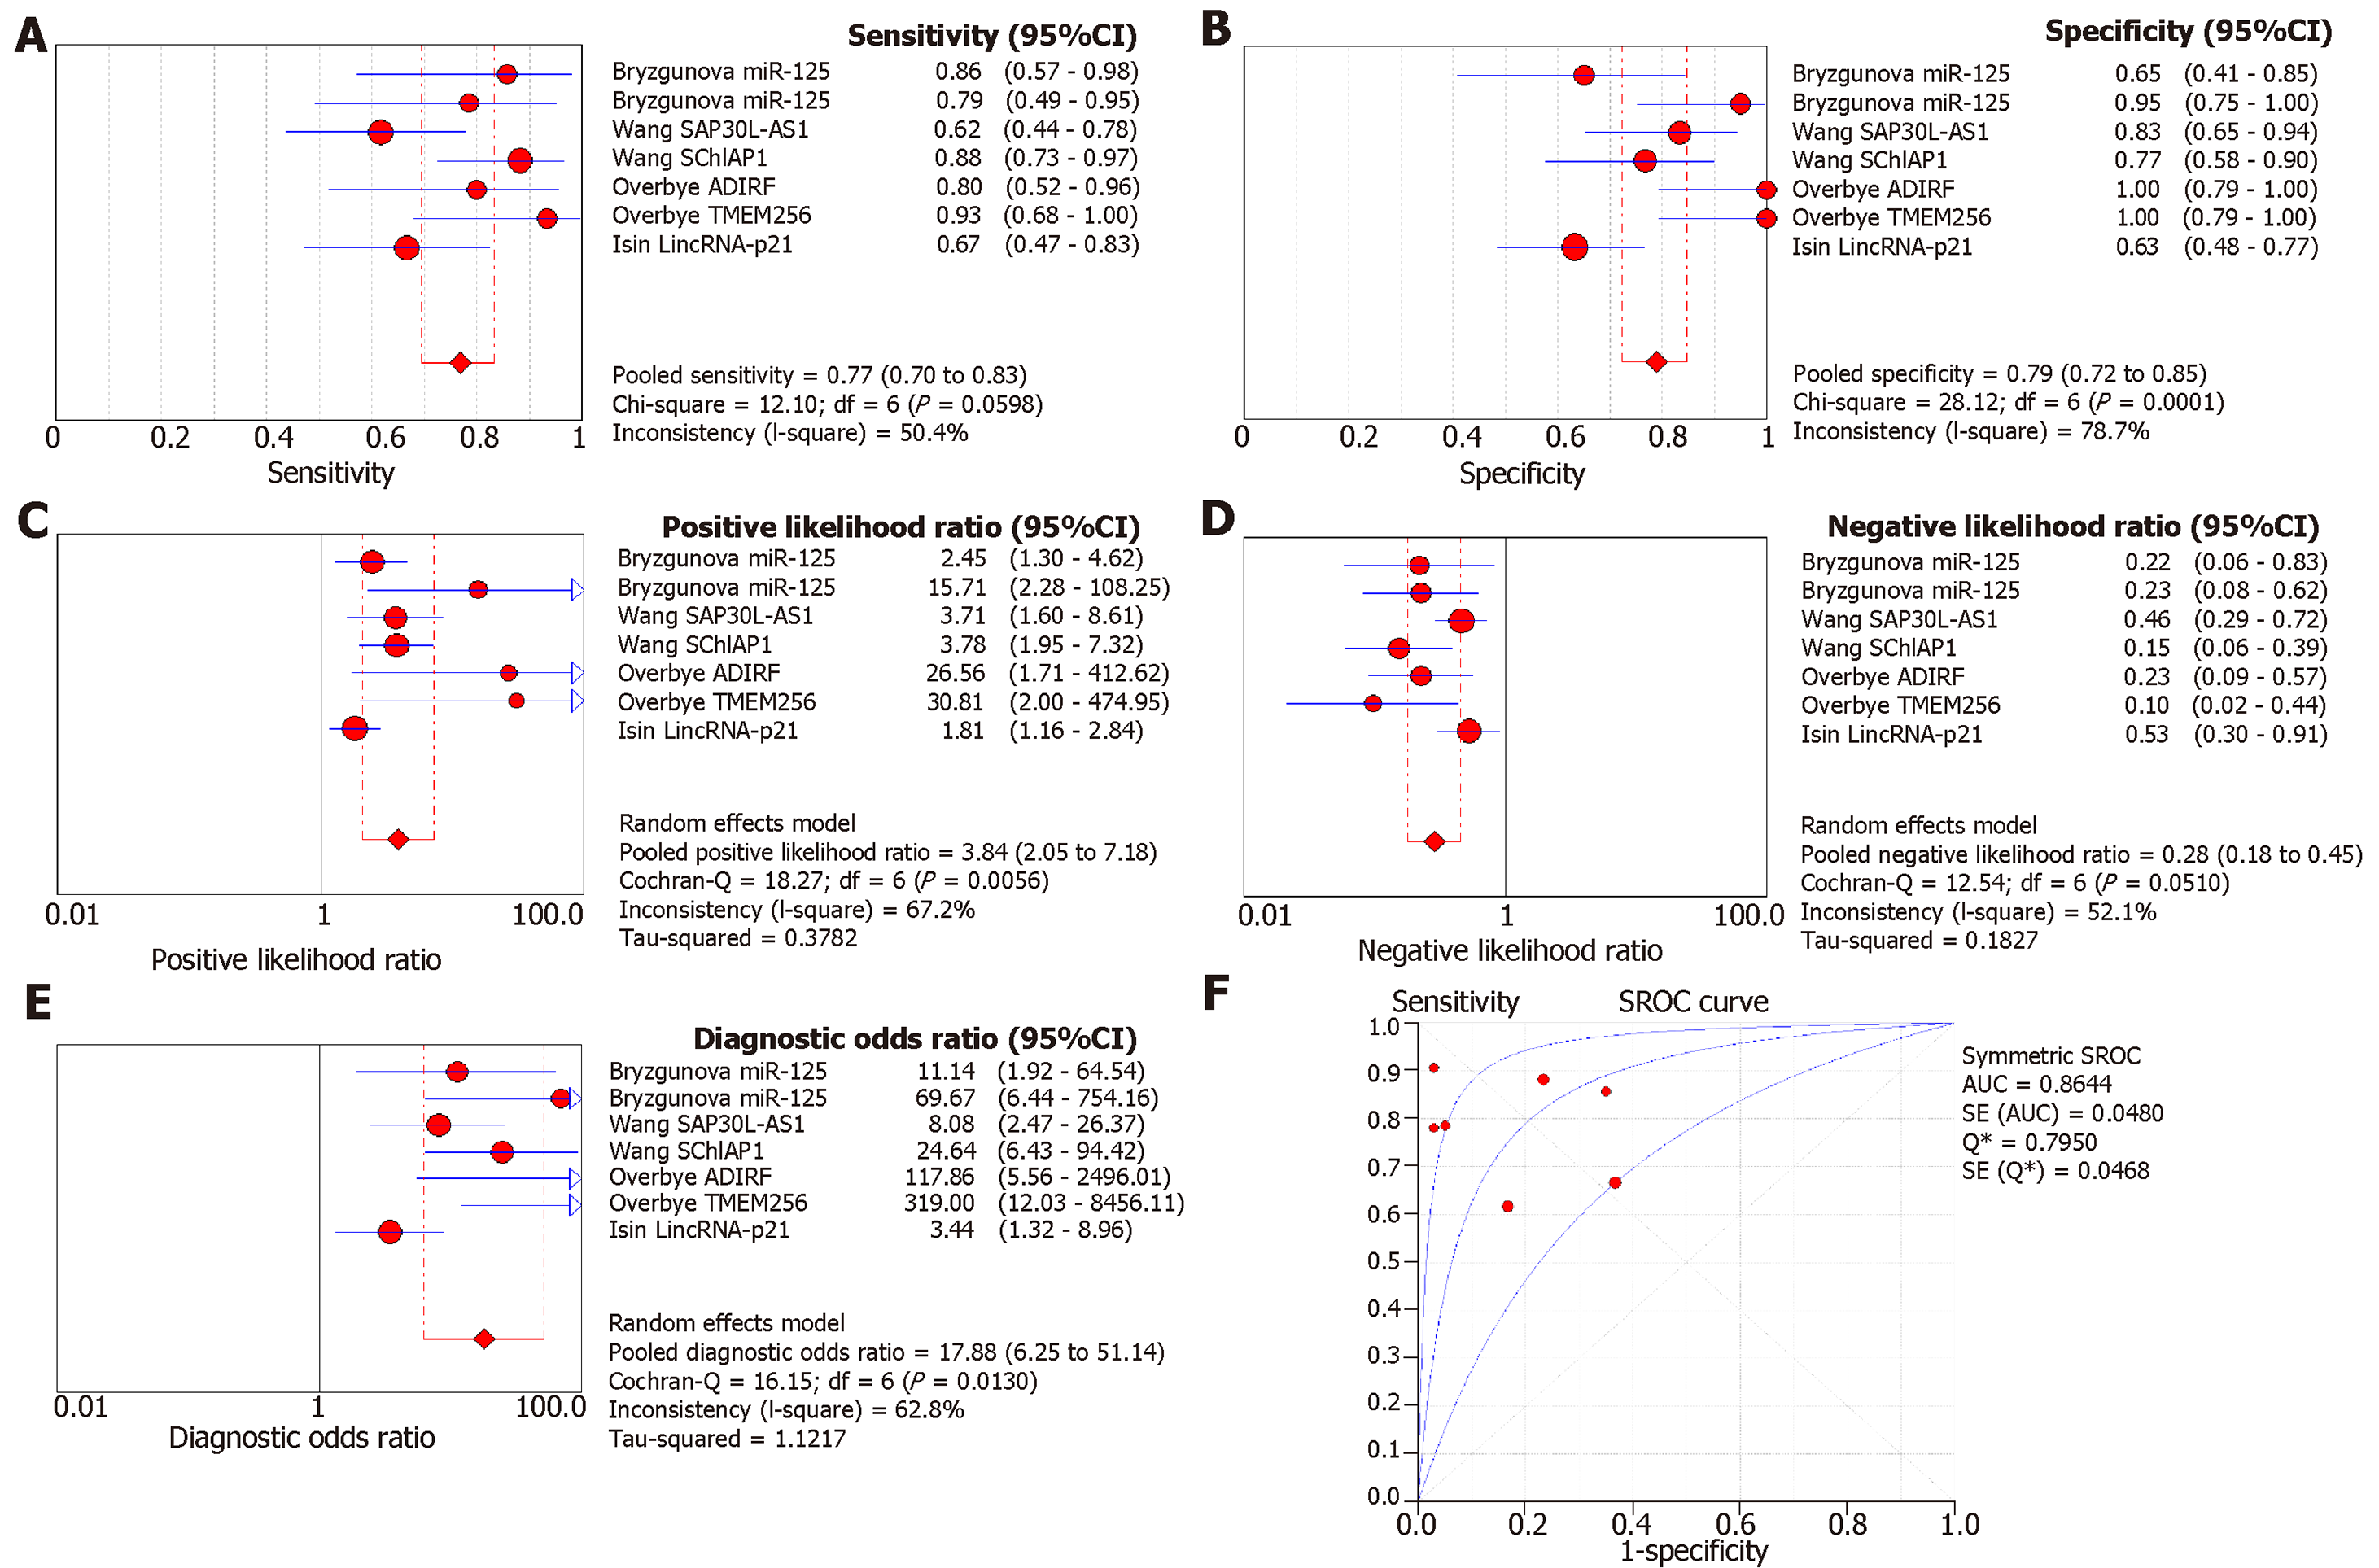
Figure 5 Forest plot of pooled (A) sensitivity, (B) specificity, (C) positive likelihood ratio, (D) negative likelihood ratio, (E) diagnostic odds ratio and (F) SROC curve of exosomal biomarkers in diagnosis of pancreatic cancer.
SROC: Summary receiver operating characteristic.
Figure 6 Forest plot of pooled (A) sensitivity, (B) specificity, (C) positive likelihood ratio, (D) negative likelihood ratio, (E) diagnostic odds ratio, and (F) SROC curve of exosomal biomarkers in diagnosis of liver cancers.
SROC: Summary receiver operating characteristic.
Figure 7 Forest plot of pooled (A) sensitivity, (B) specificity, (C) positive likelihood ratio, (D) negative likelihood ratio, (E) diagnostic odds ratio, and (F) SROC curve of exosomal biomarkers in diagnosis of prostate cancers.
SROC: Summary receiver operating characteristic.
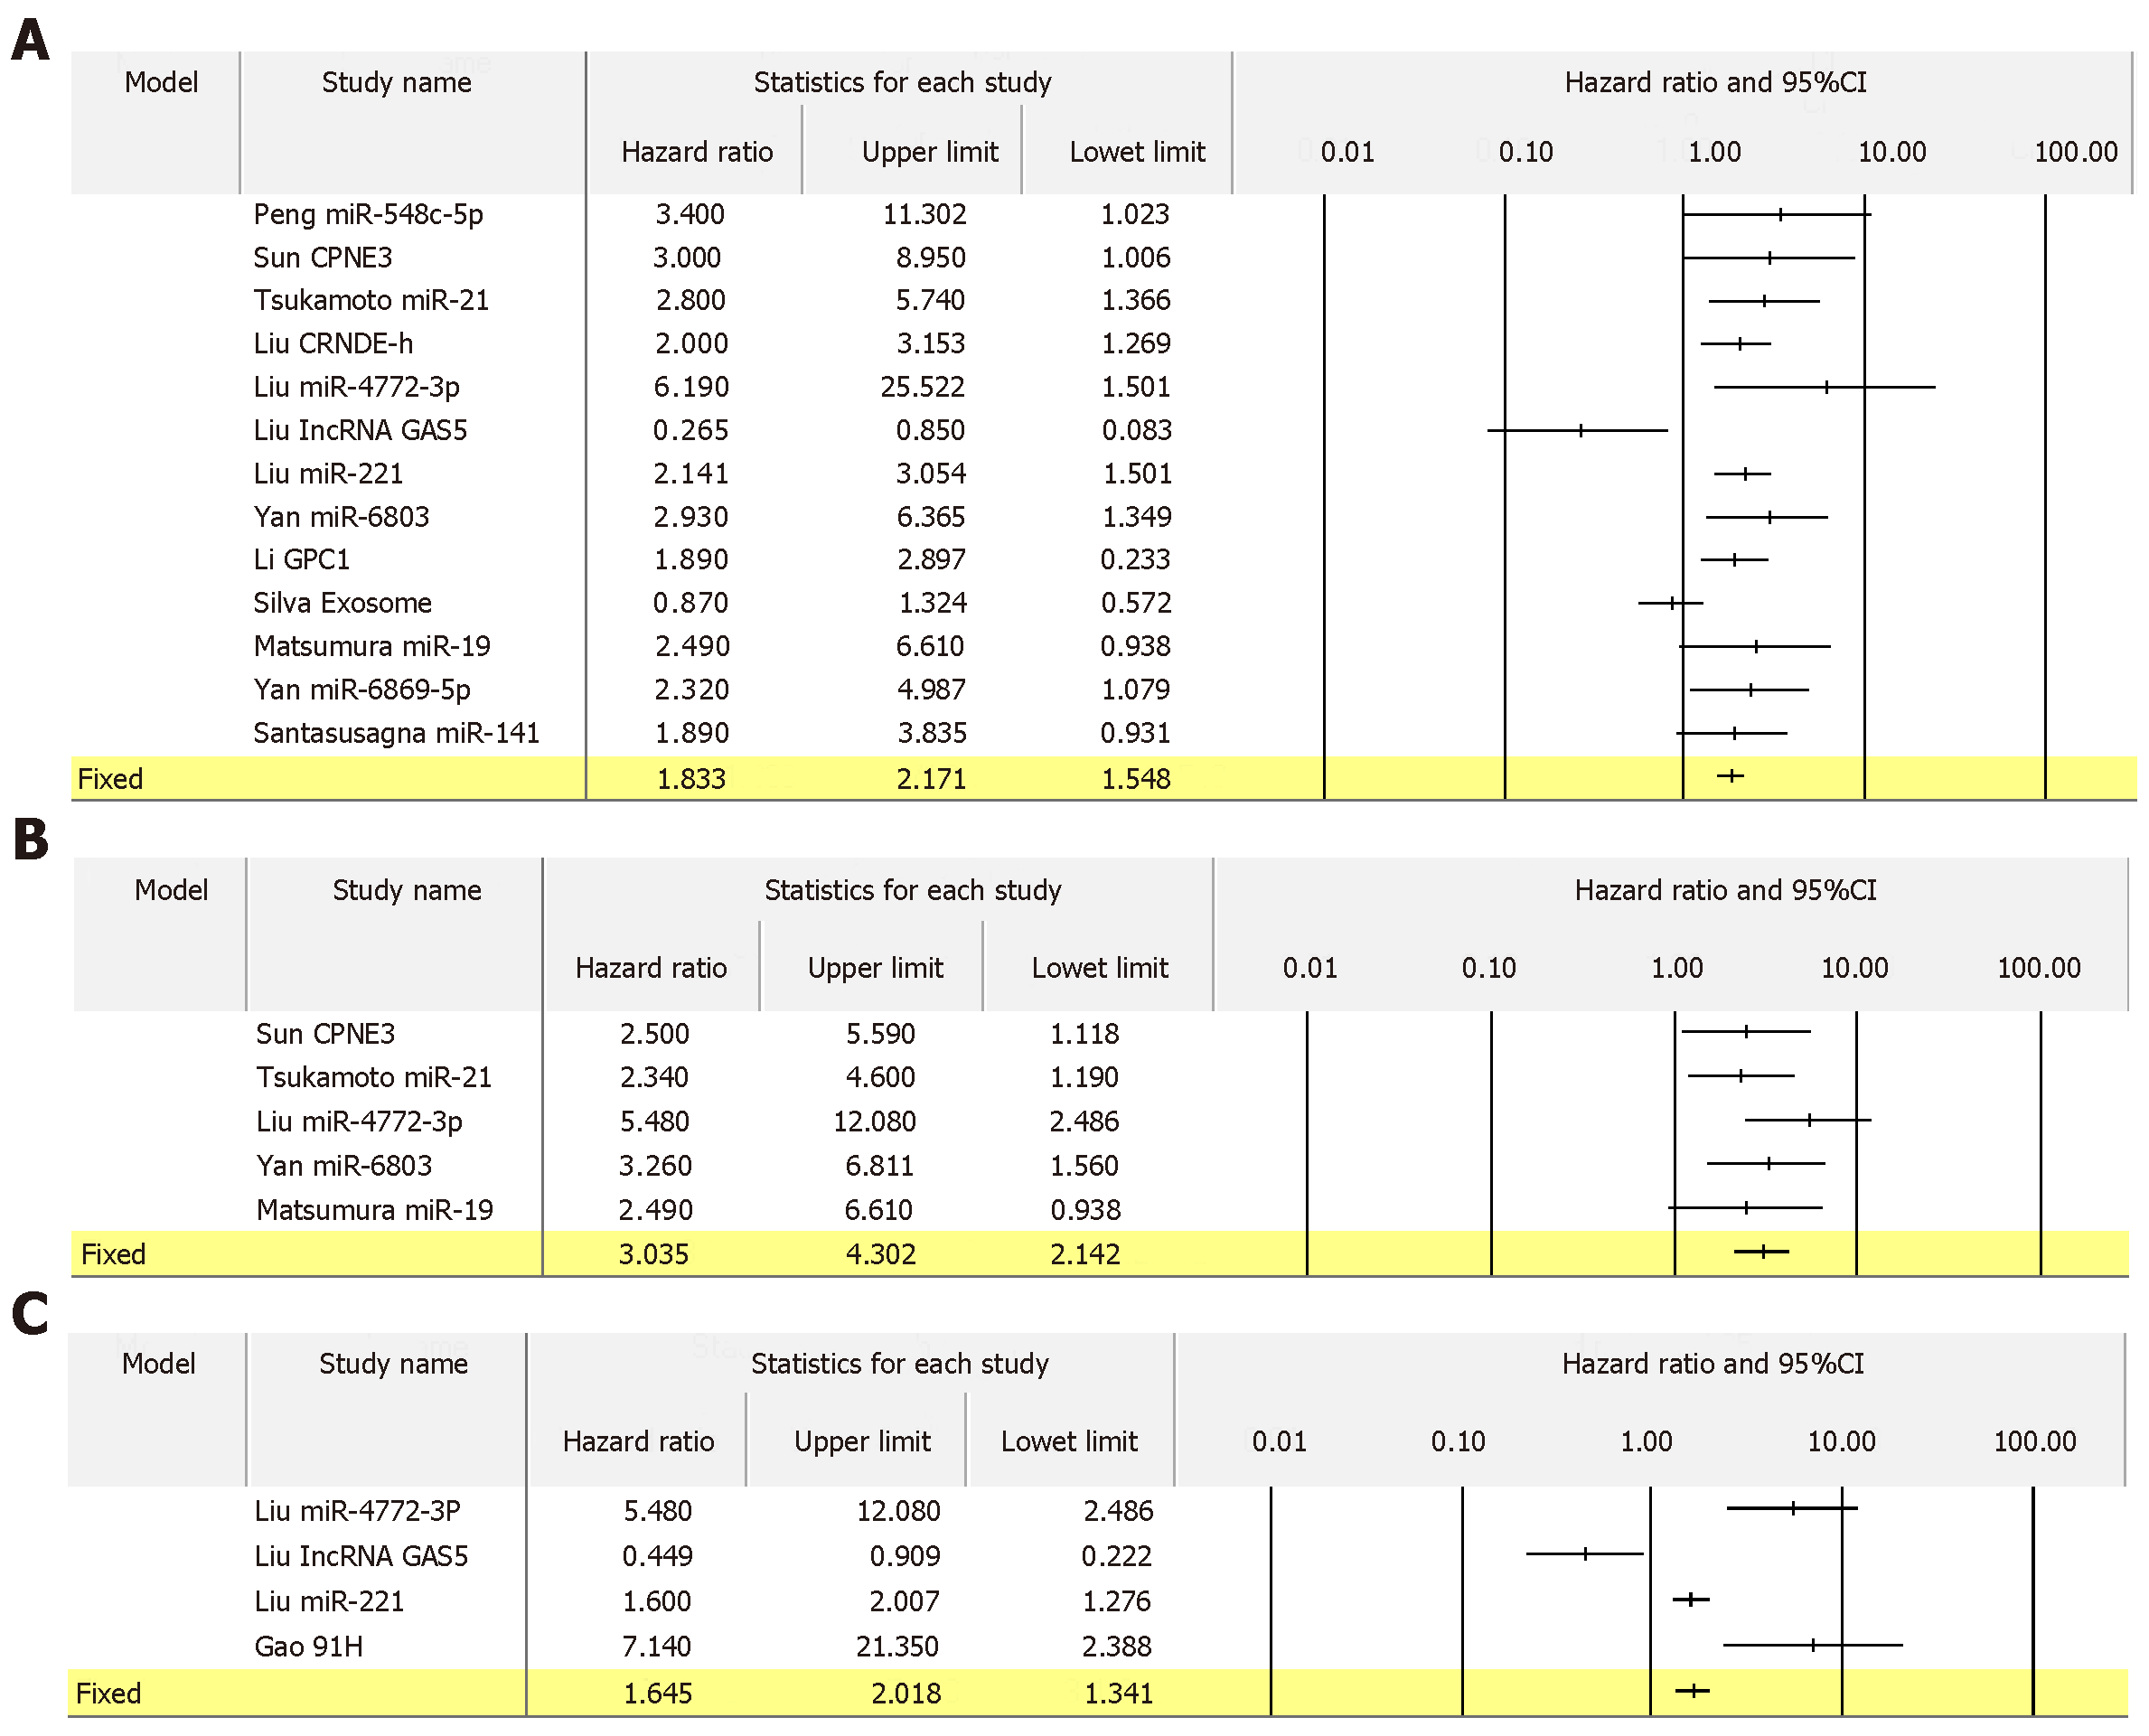
Figure 8 Forest plot evaluating the effect of exosomal markers on overall survival (A), disease-free survival (B), and (C) recurrence-free survival of patients with colon cancer.
Figure 9 Forest plot evaluating the effect of exosomal markers on overall survival of patients with gastric cancer.
Figure 10 Forest plot evaluating the effect of exosomal markers on overall survival of patients with pancreatic cancer.
Figure 11 Forest plot evaluating the effect of exosomal markers on overall survival of patients with liver cancer.
Figure 12 Forest plot evaluating the effect of exosomal markers on overall survival of patients with lung cancer.
- Citation: Wong CH, Chen YC. Clinical significance of exosomes as potential biomarkers in cancer. World J Clin Cases 2019; 7(2): 171-190
- URL: https://www.wjgnet.com/2307-8960/full/v7/i2/171.htm
- DOI: https://dx.doi.org/10.12998/wjcc.v7.i2.171


