Copyright
©The Author(s) 2019.
World J Clin Cases. Oct 6, 2019; 7(19): 2963-2975
Published online Oct 6, 2019. doi: 10.12998/wjcc.v7.i19.2963
Published online Oct 6, 2019. doi: 10.12998/wjcc.v7.i19.2963
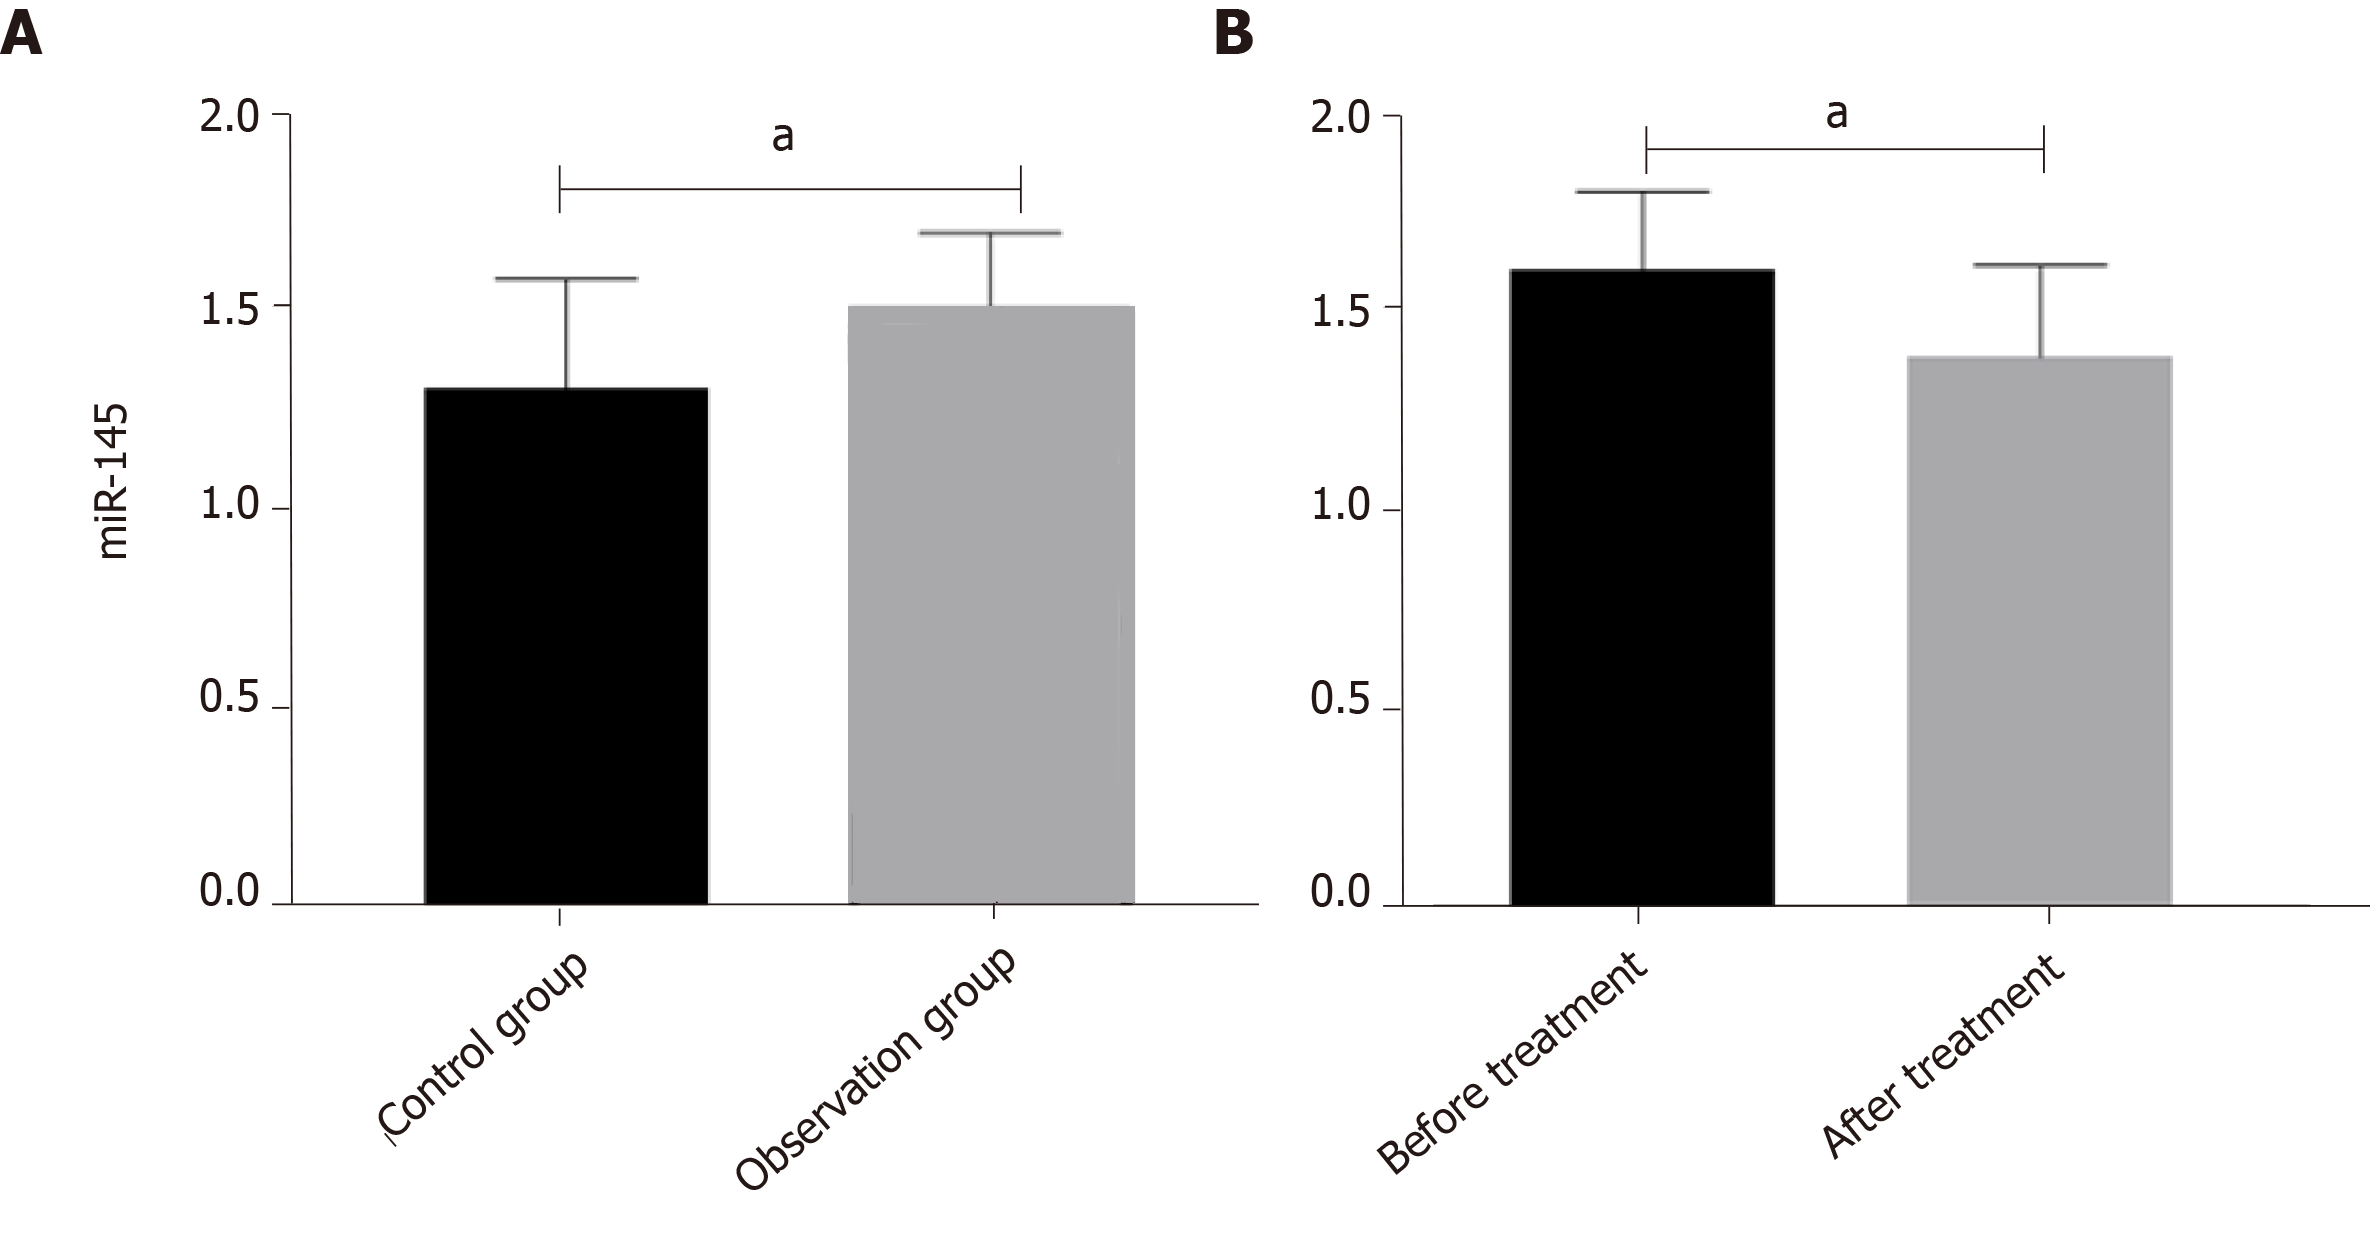
Figure 1 Expression levels of miR-145 in the peripheral blood of the two groups.
aP < 0.05.
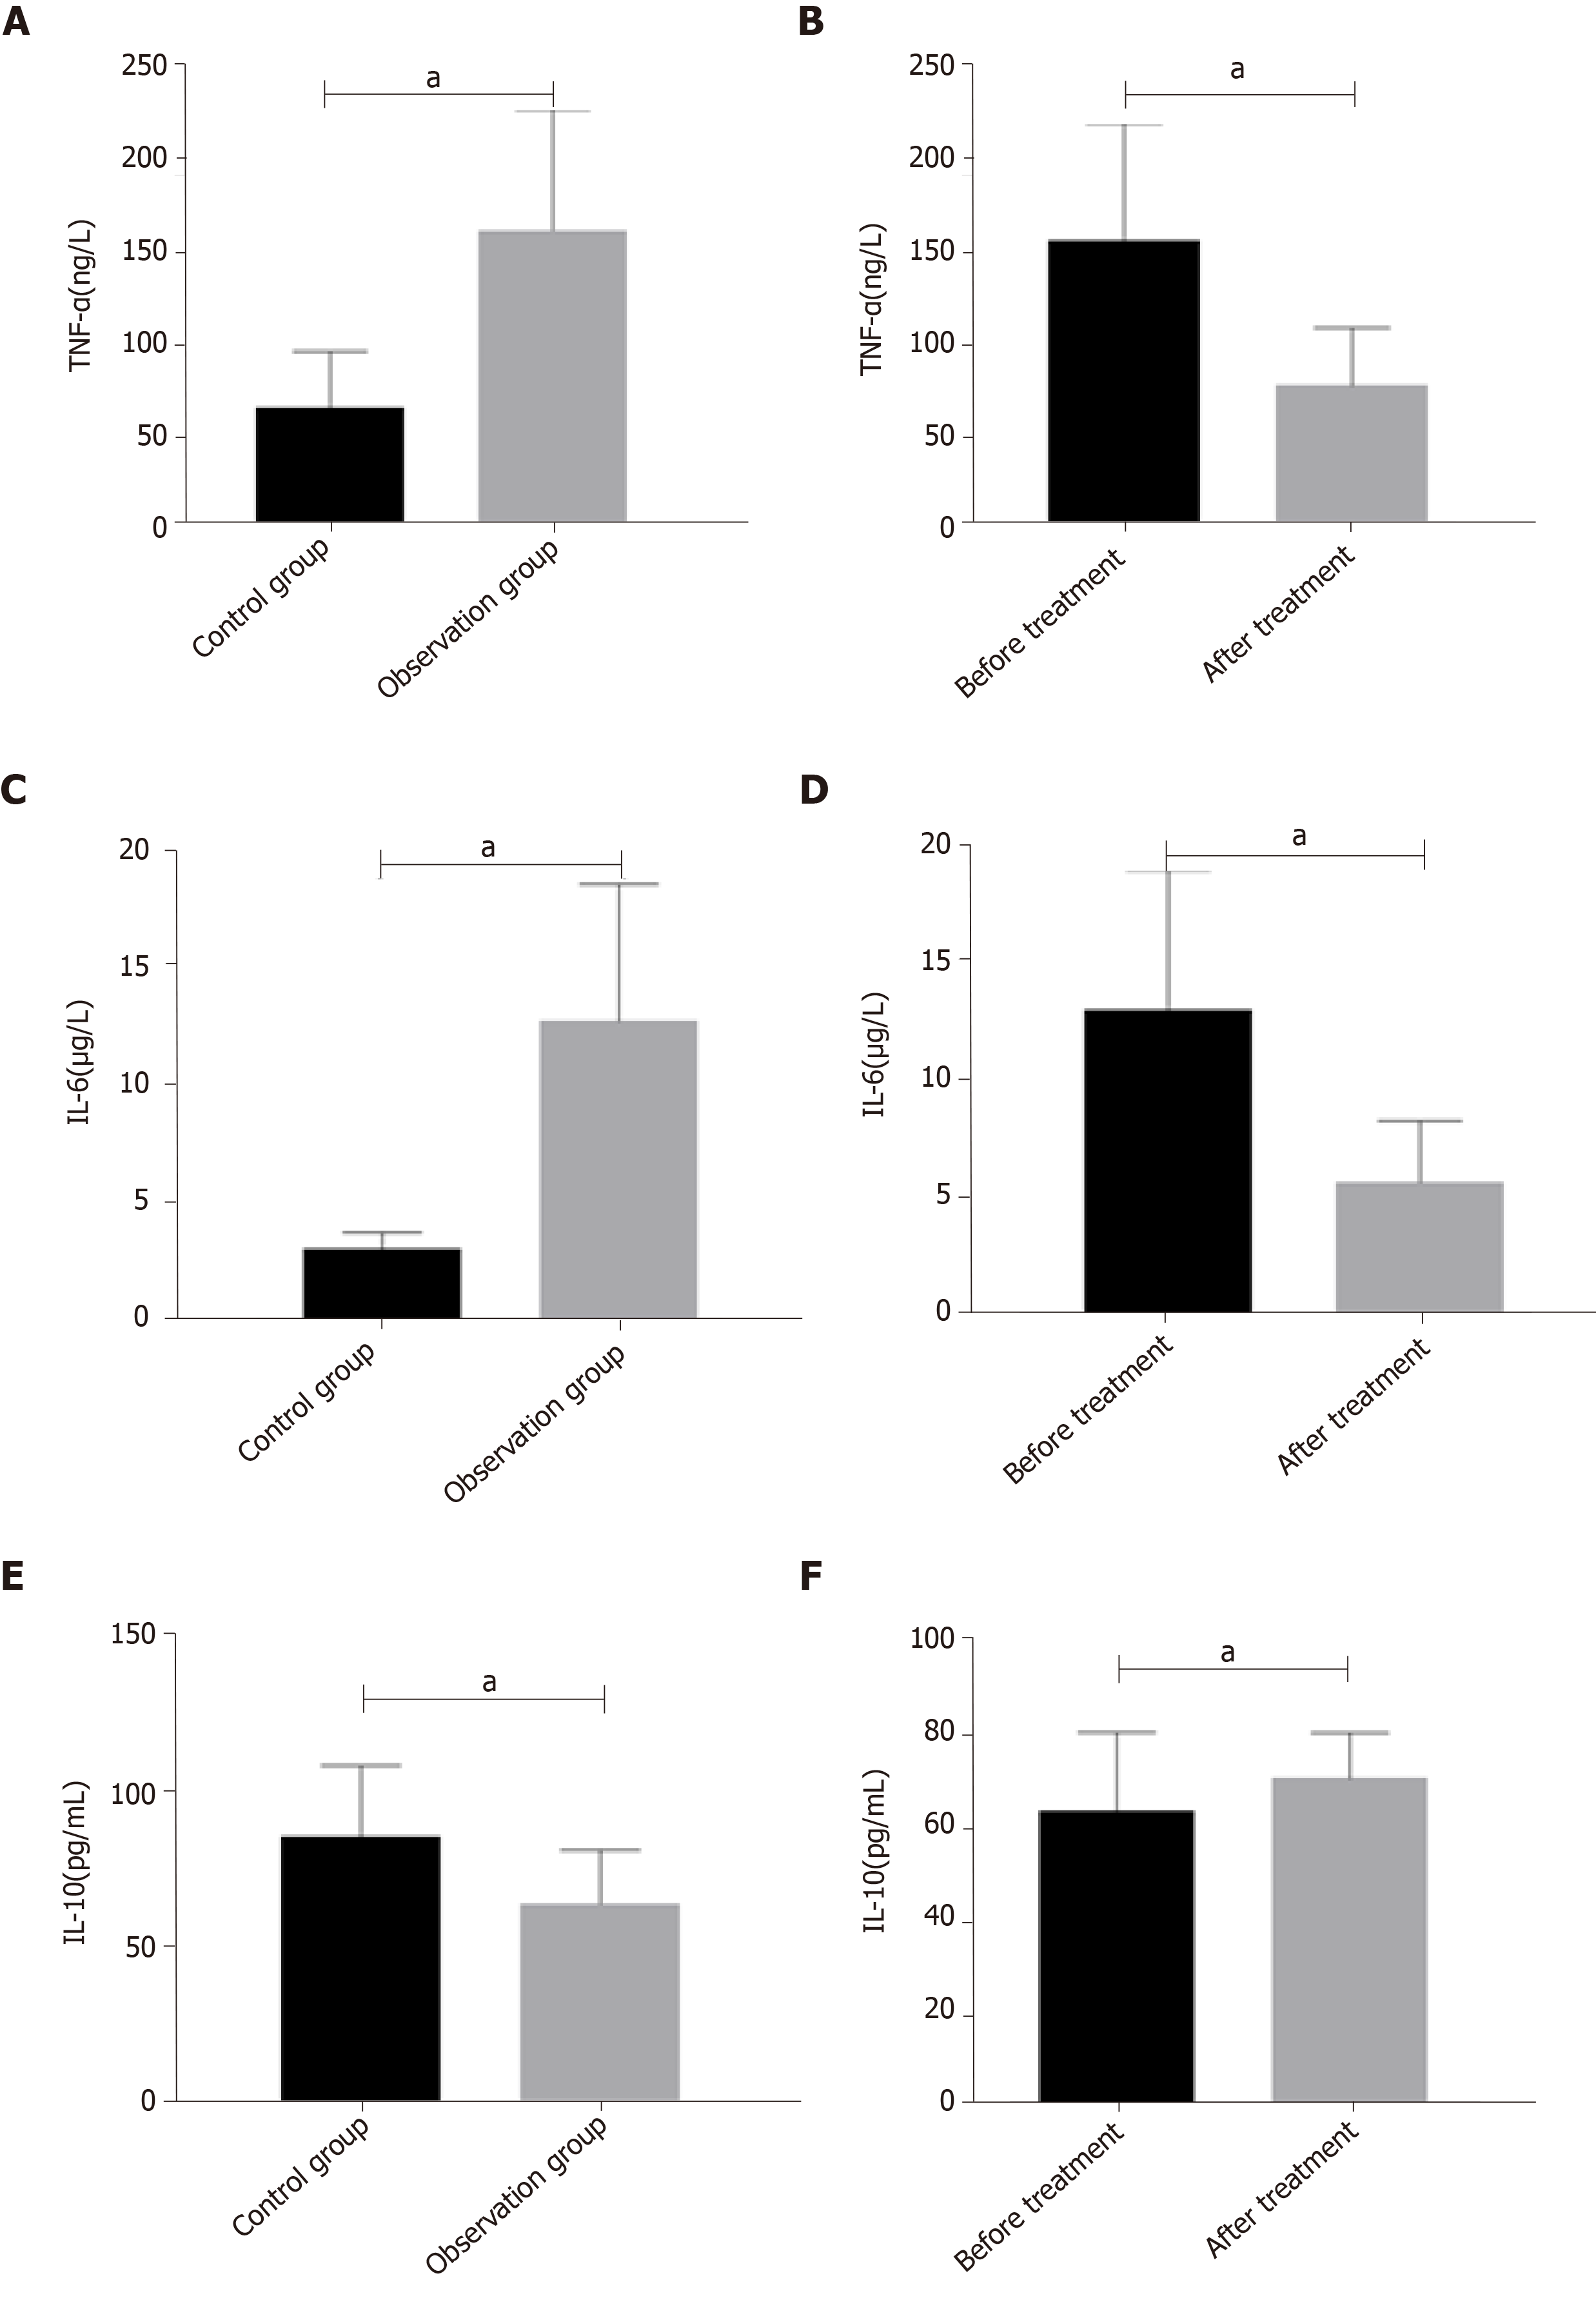
Figure 2 Levels of inflammatory factors in peripheral blood between the two groups.
aP < 0.05.
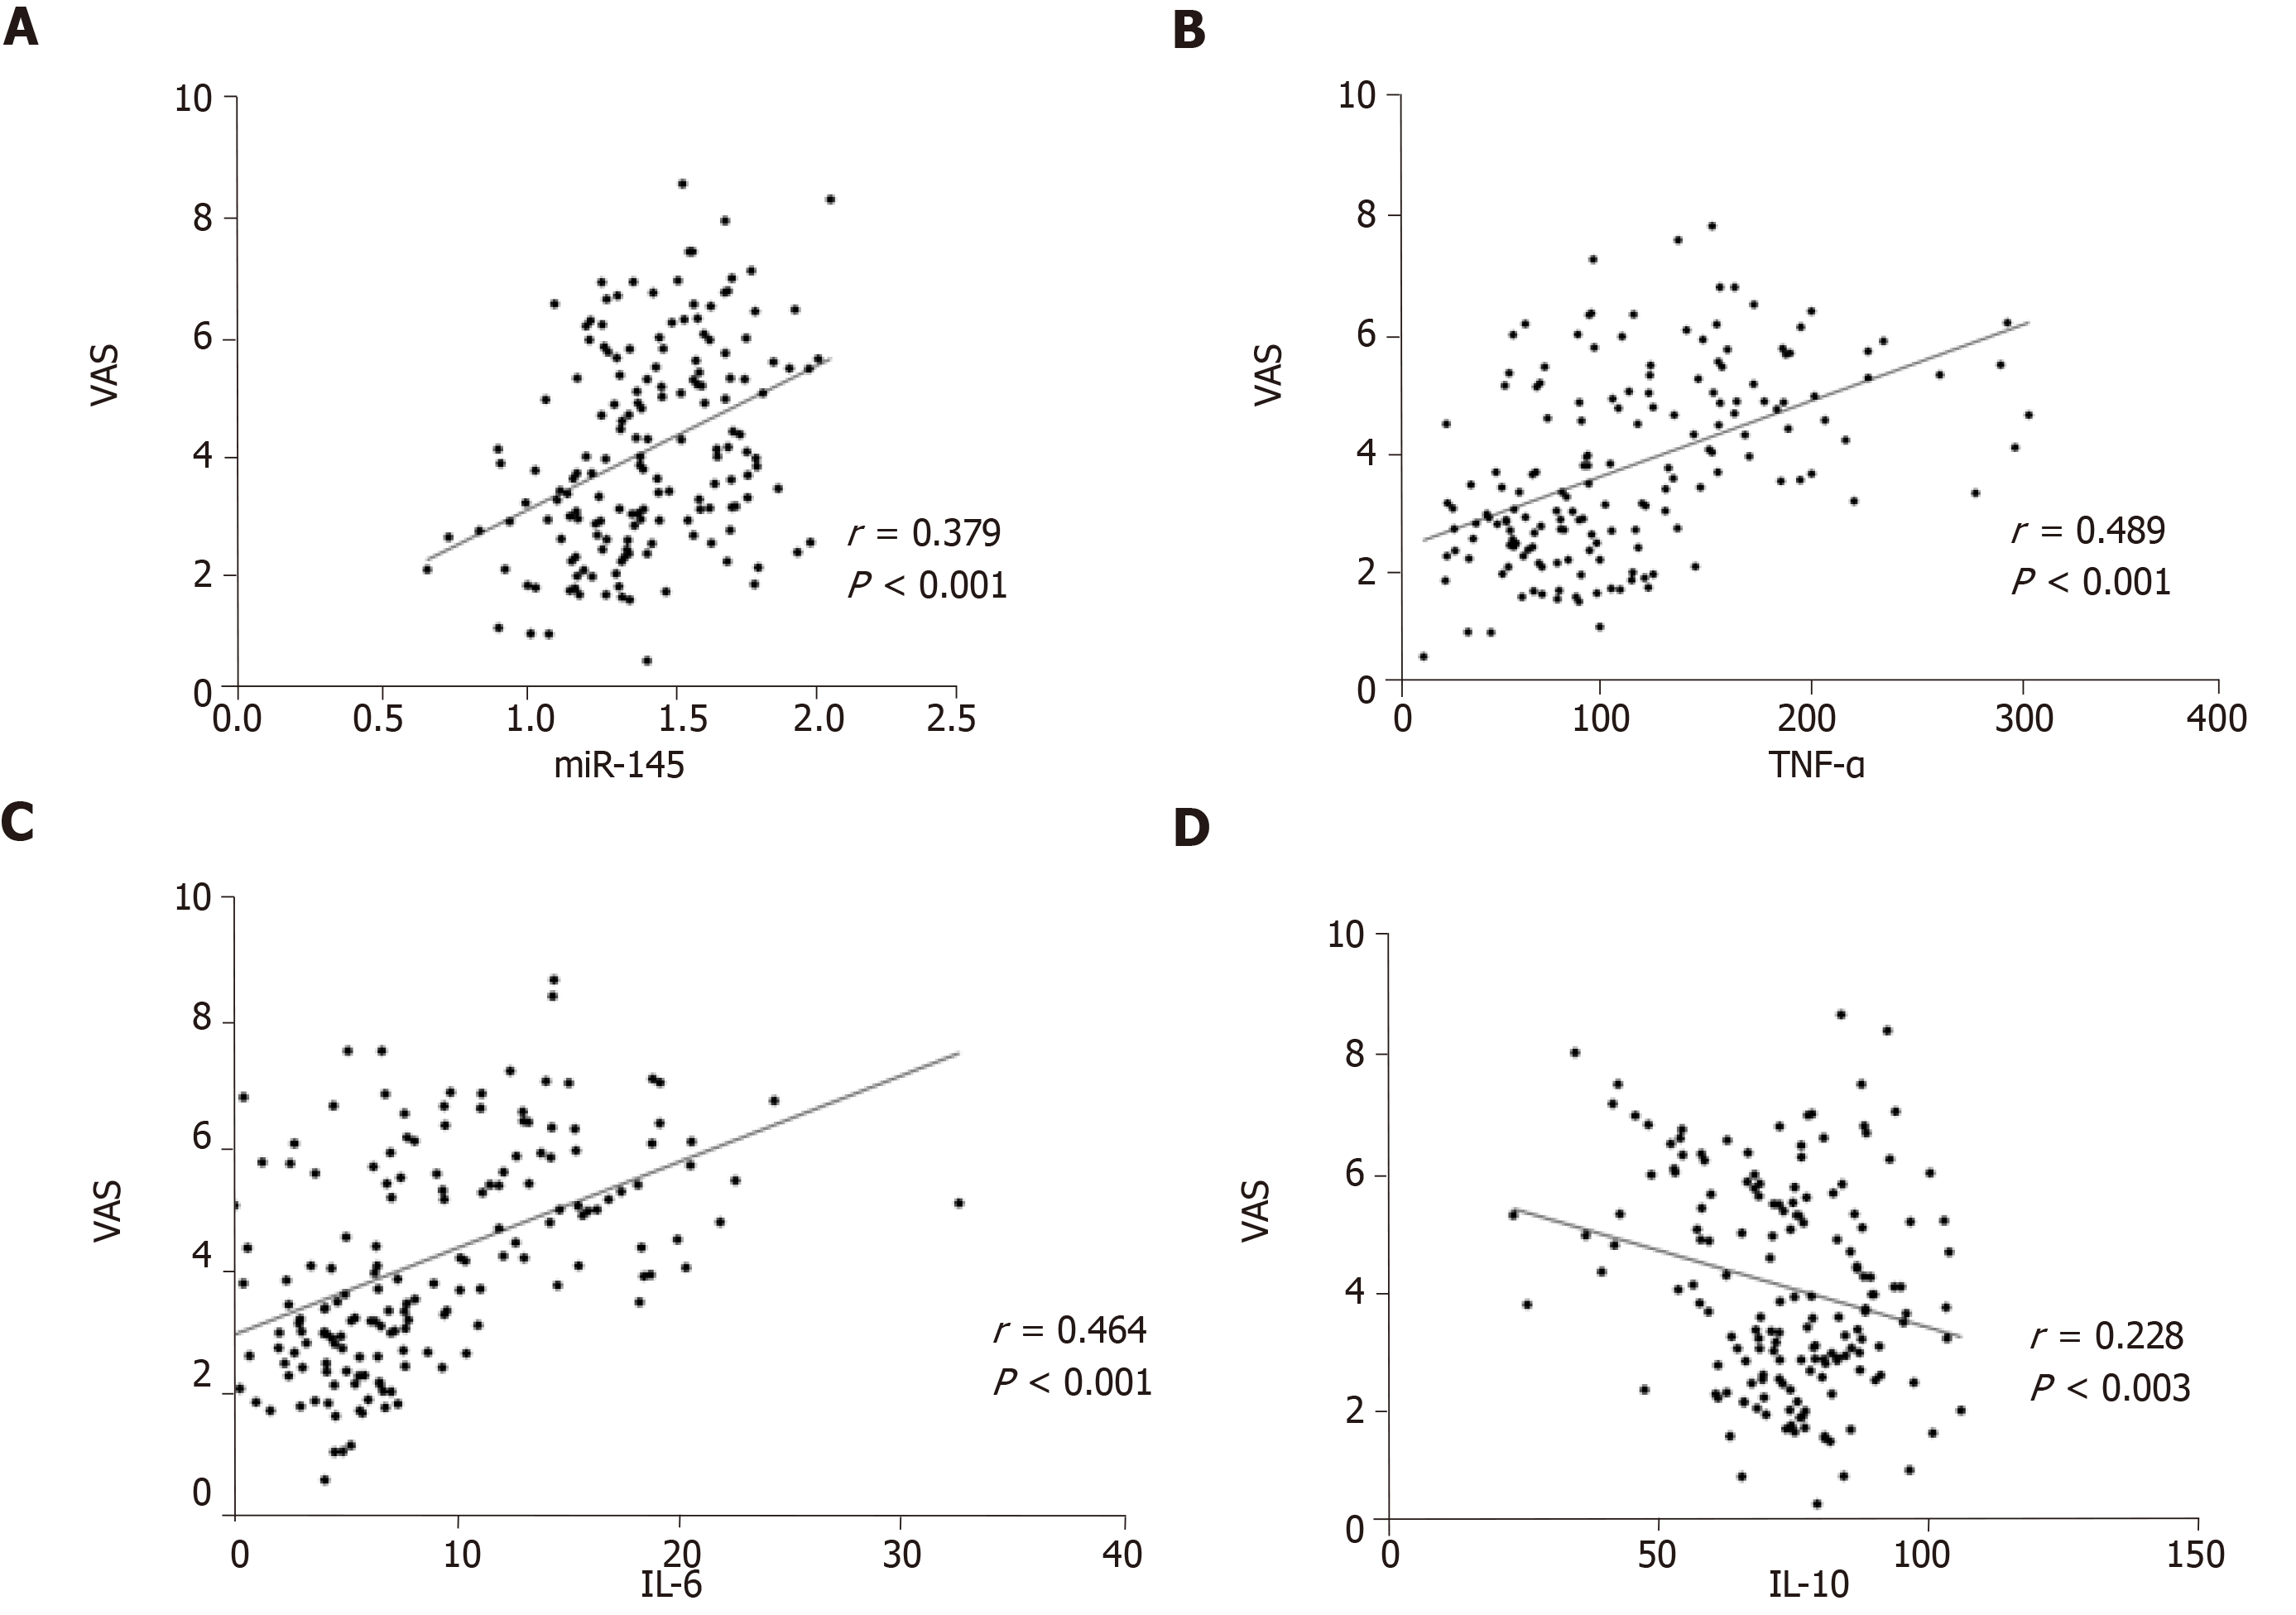
Figure 3 Correlation of miR-145 and inflammatory factors with VAS scores.
VAS scores were positively correlated with miR-145, TNF-α, and IL-6, and negatively correlated with IL-10 (P < 0.05). TNF: Tumor necrosis factor; IL: Interleukin.
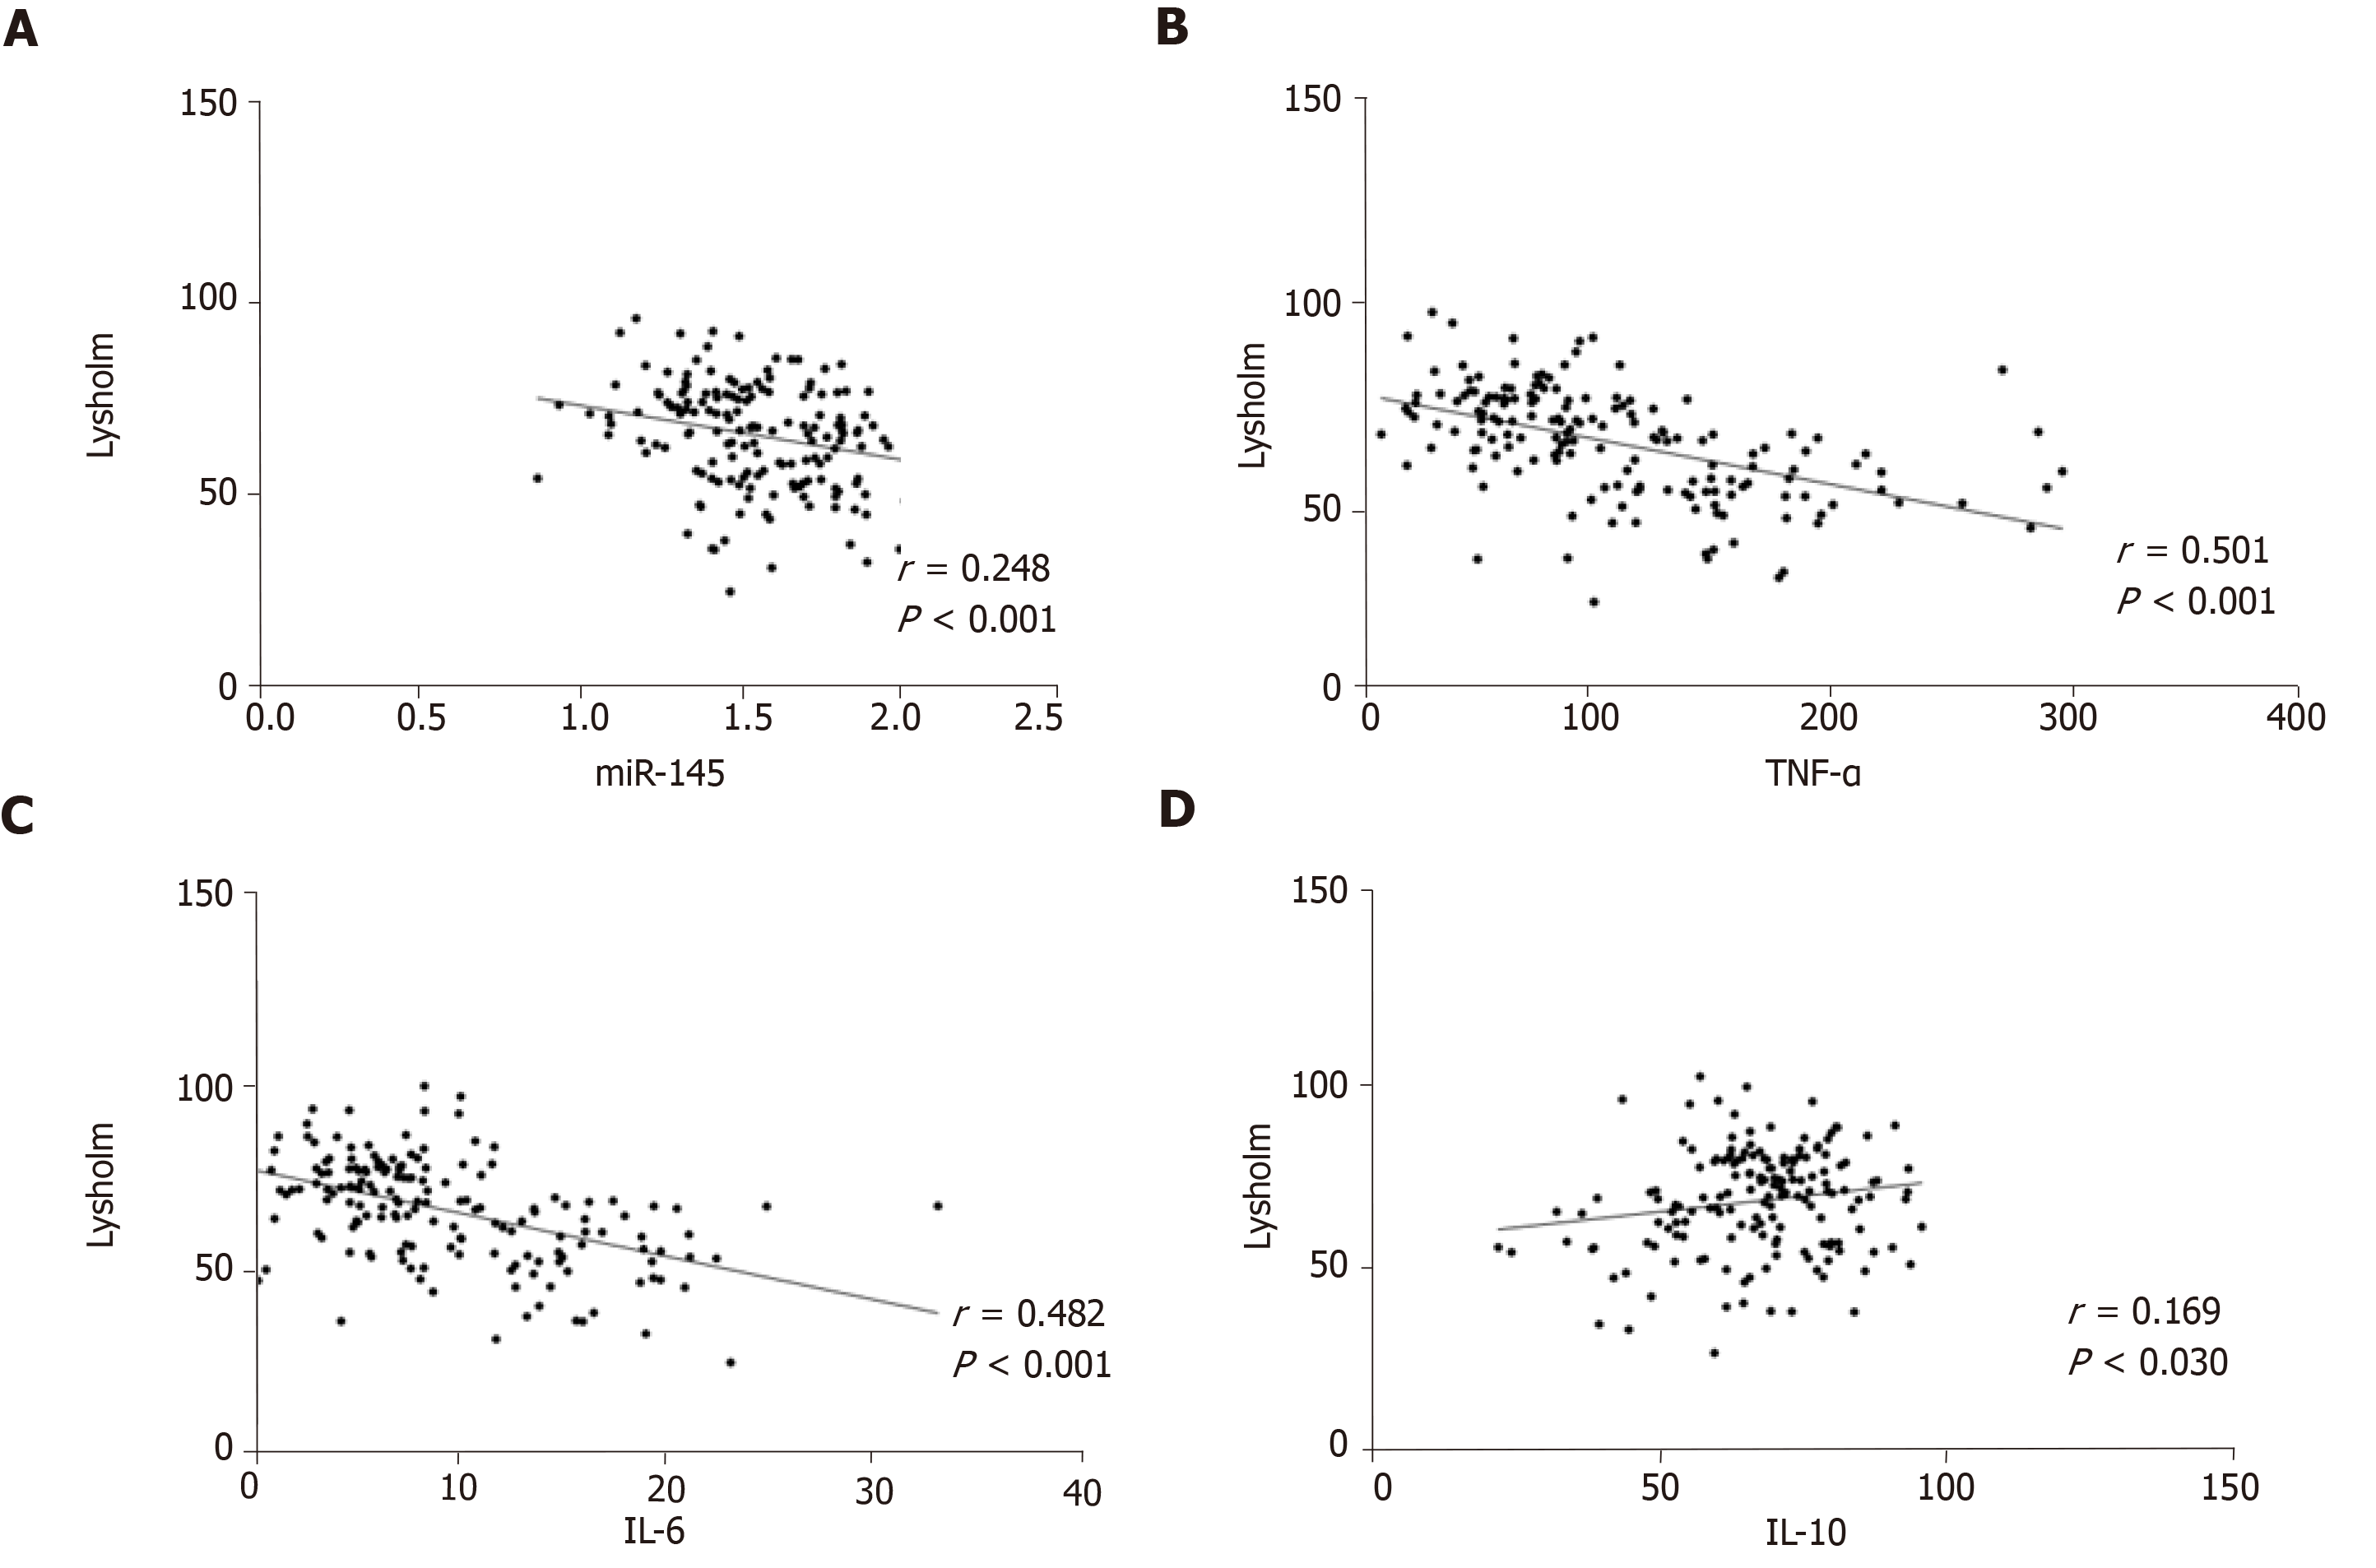
Figure 4 Relationship of miR-145 and inflammatory factors with Lysholm scores.
Lysholm scores were negatively correlated with miR-145, TNF-α, and IL-6, and positively correlated with IL-10 (P < 0.05). TNF: Tumor necrosis factor; IL: Interleukin.
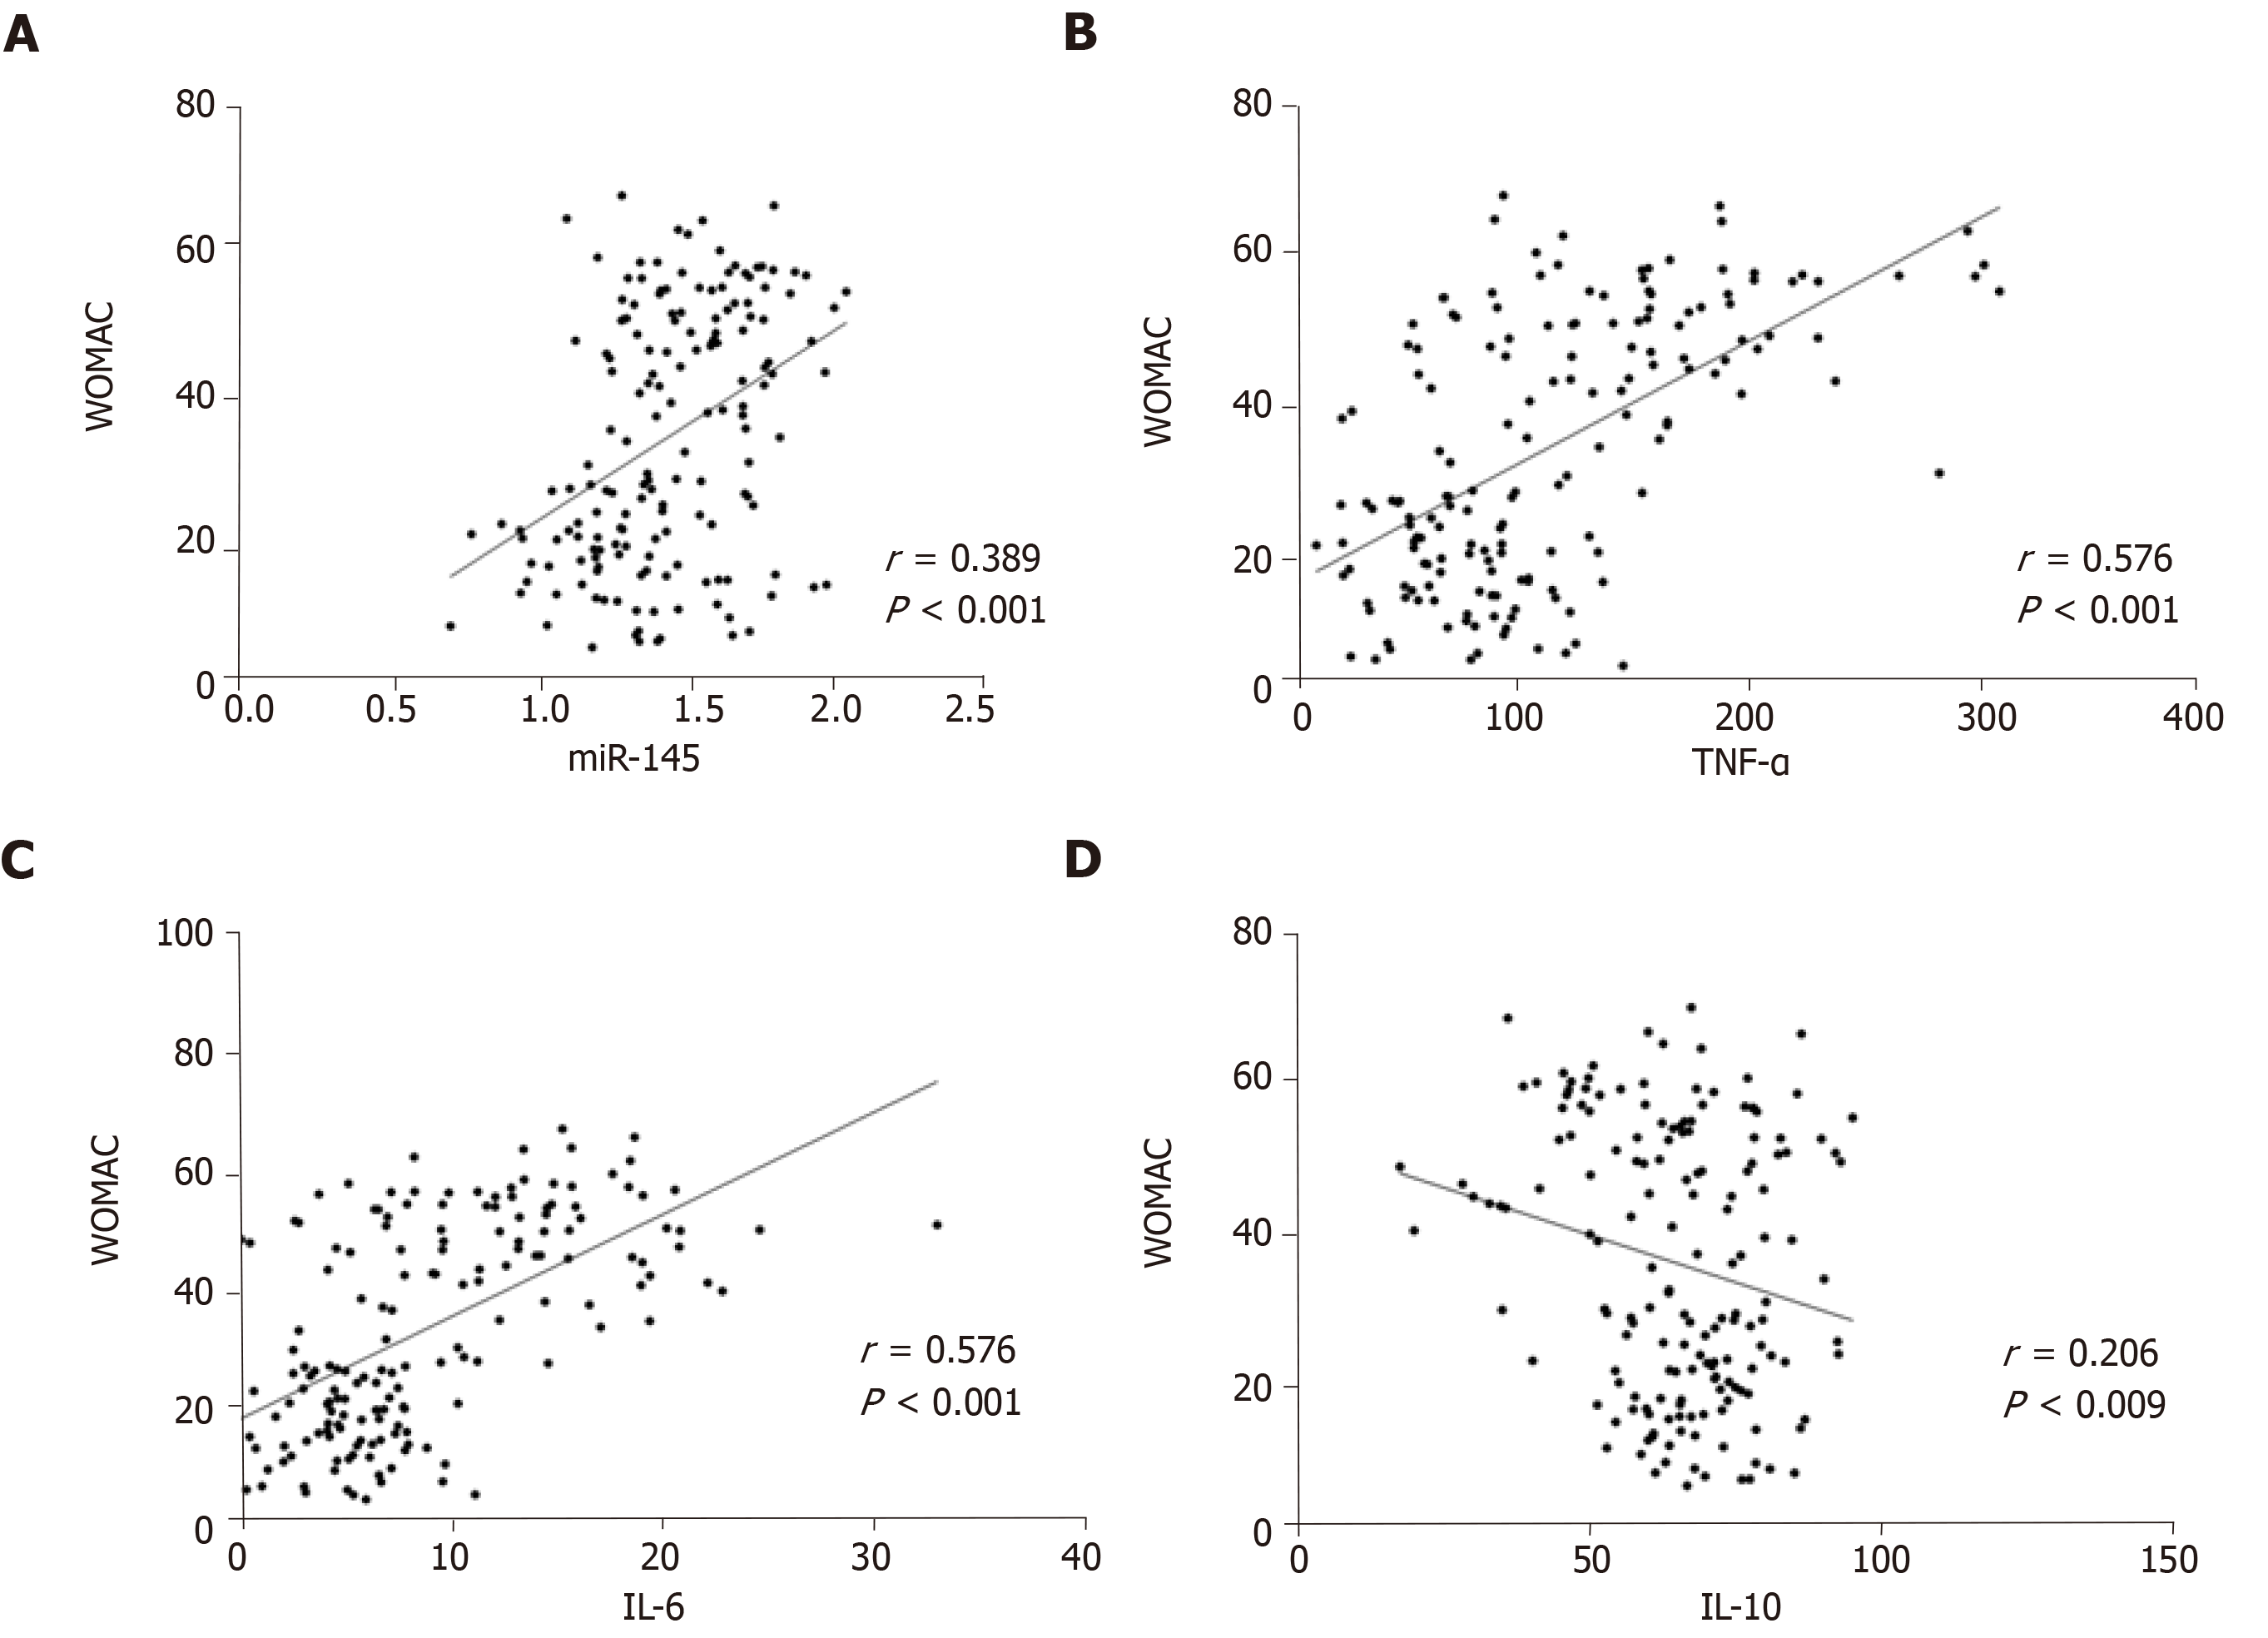
Figure 5 Correlation of miR-145 and inflammatory factors with WOMAC scores.
WOMAC scores were positively correlated with miR-145, TNF-α, and IL-6 (P < 0.05), and negatively correlated with IL-10 (P < 0.05). TNF: Tumor necrosis factor; IL: Interleukin.
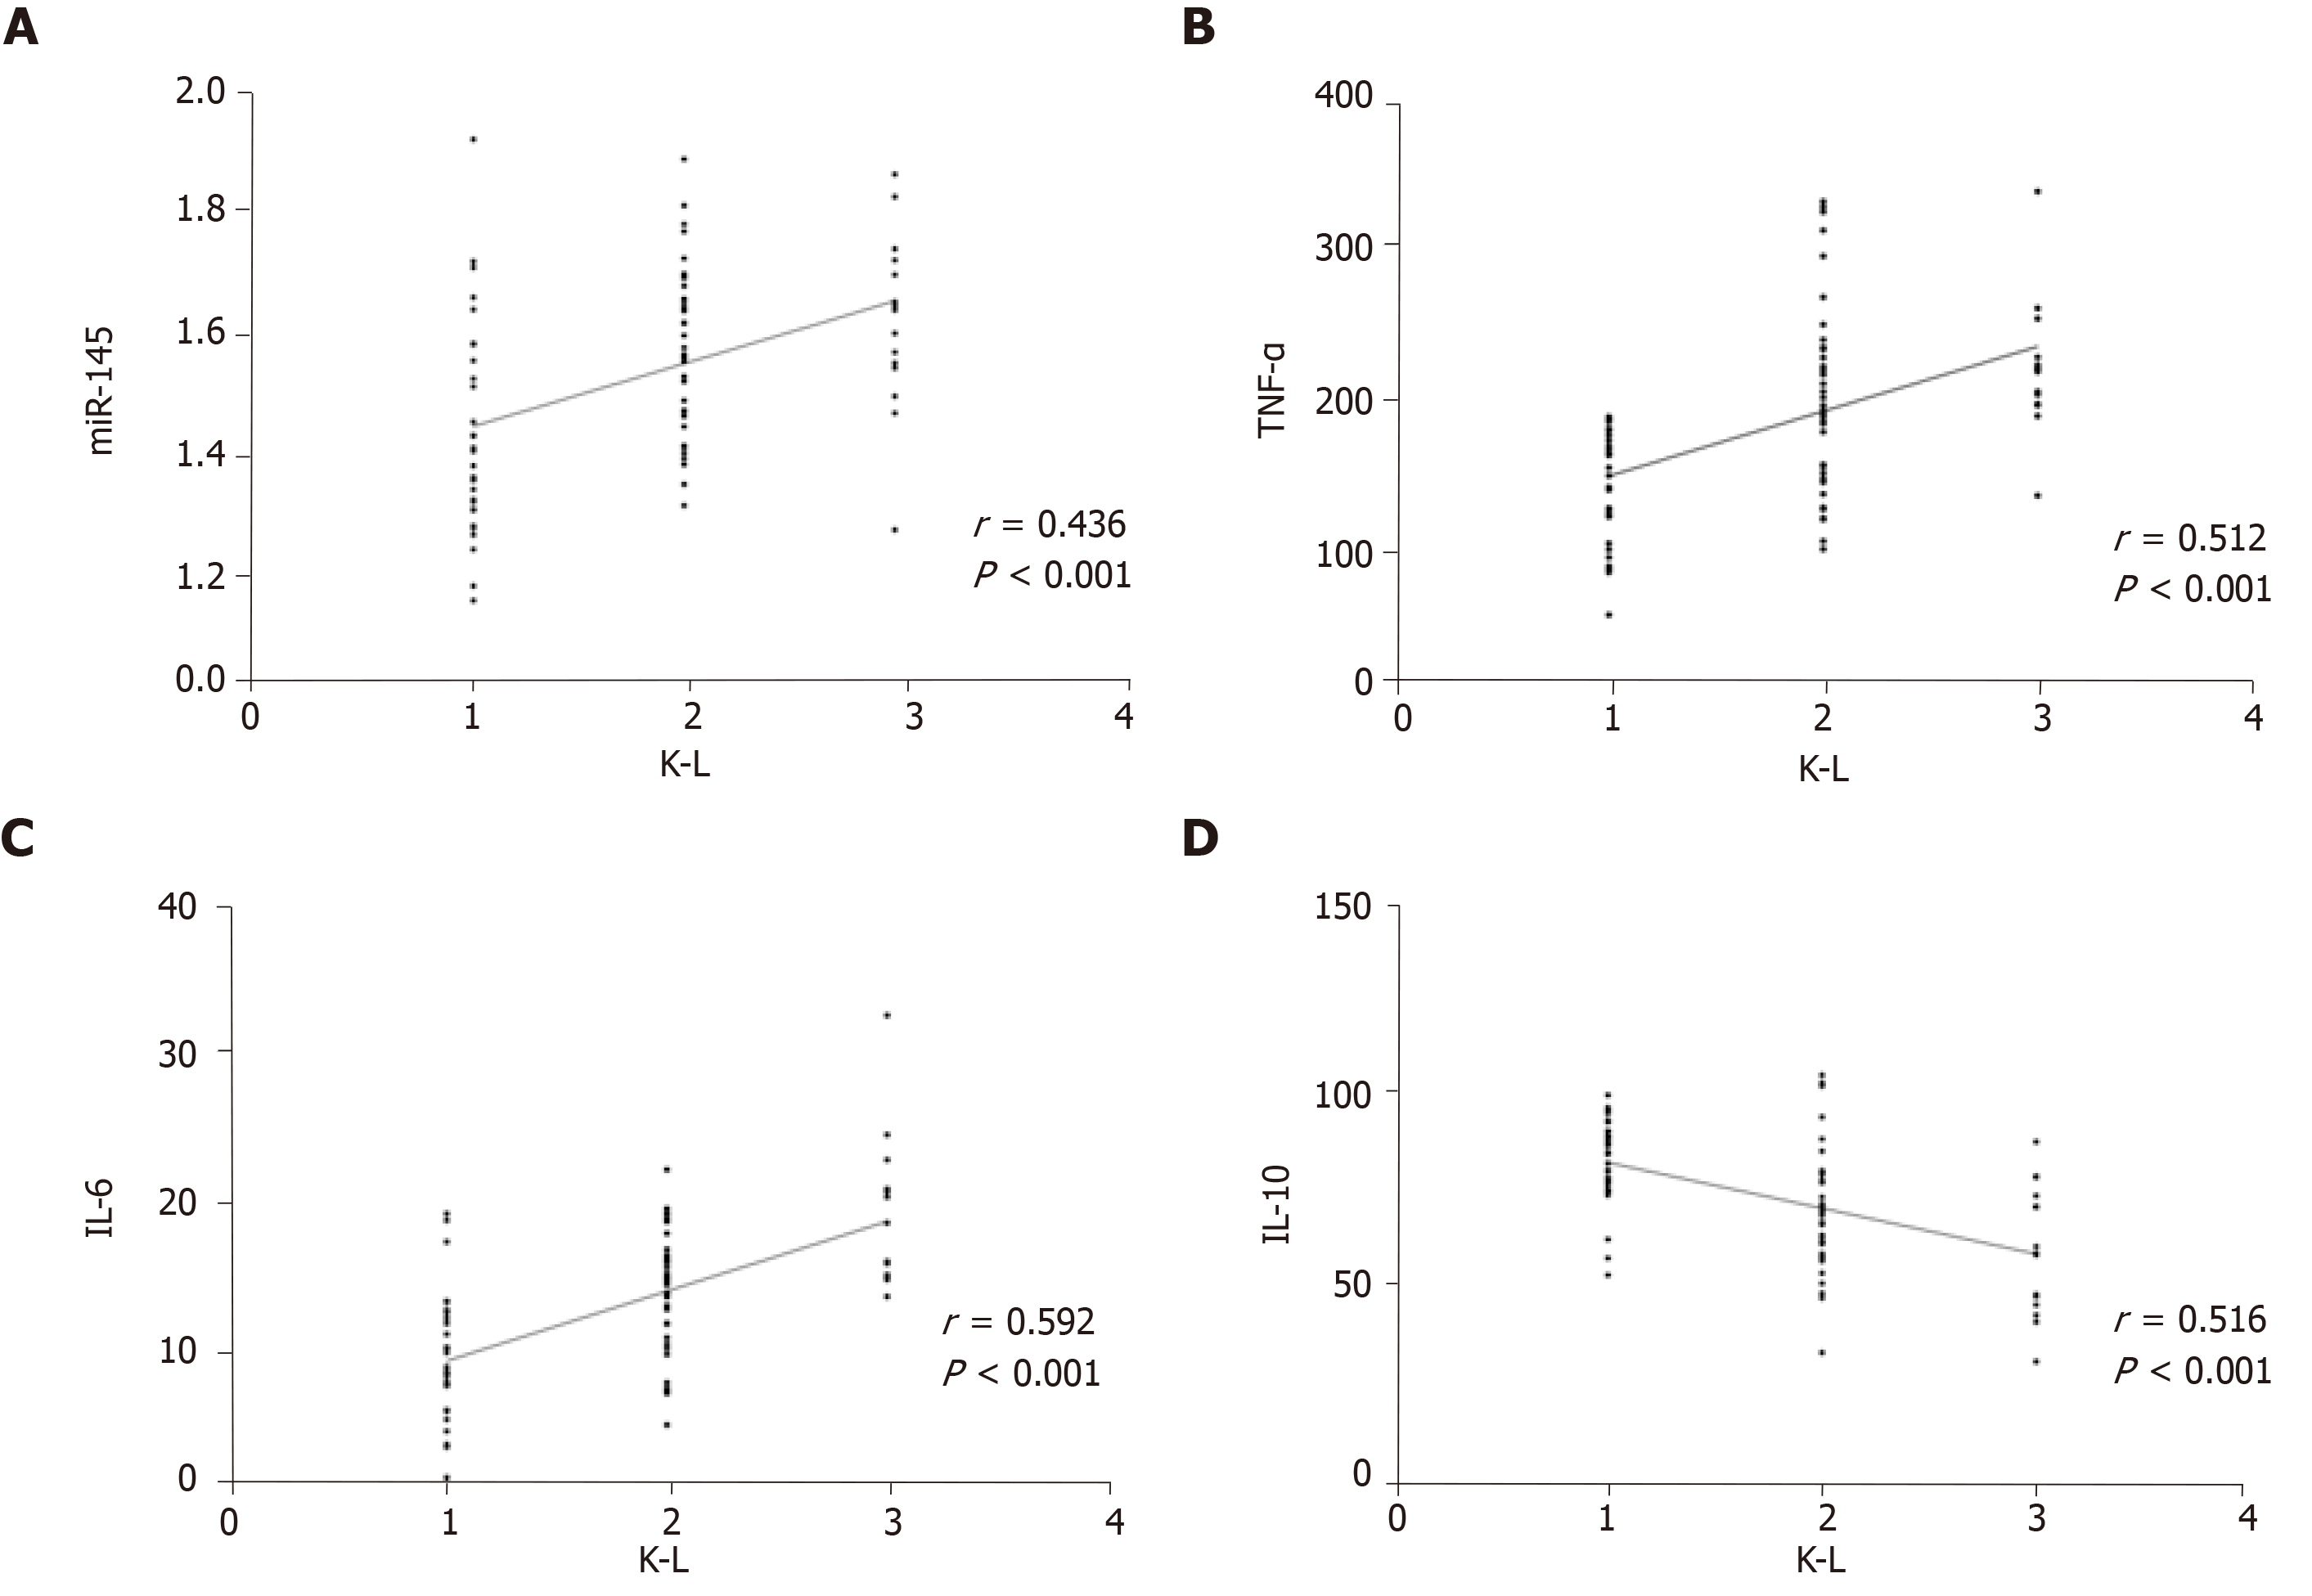
Figure 6 Correlation of miR-145 and inflammatory factors with Kellgren-Lawrence grades.
Kellgren-Lawrence grades were positively correlated with miR-145, TNF-α, and IL-6 (P < 0.05), and negatively correlated with IL-10 (P < 0.05). TNF: Tumor necrosis factor; IL: Interleukin.
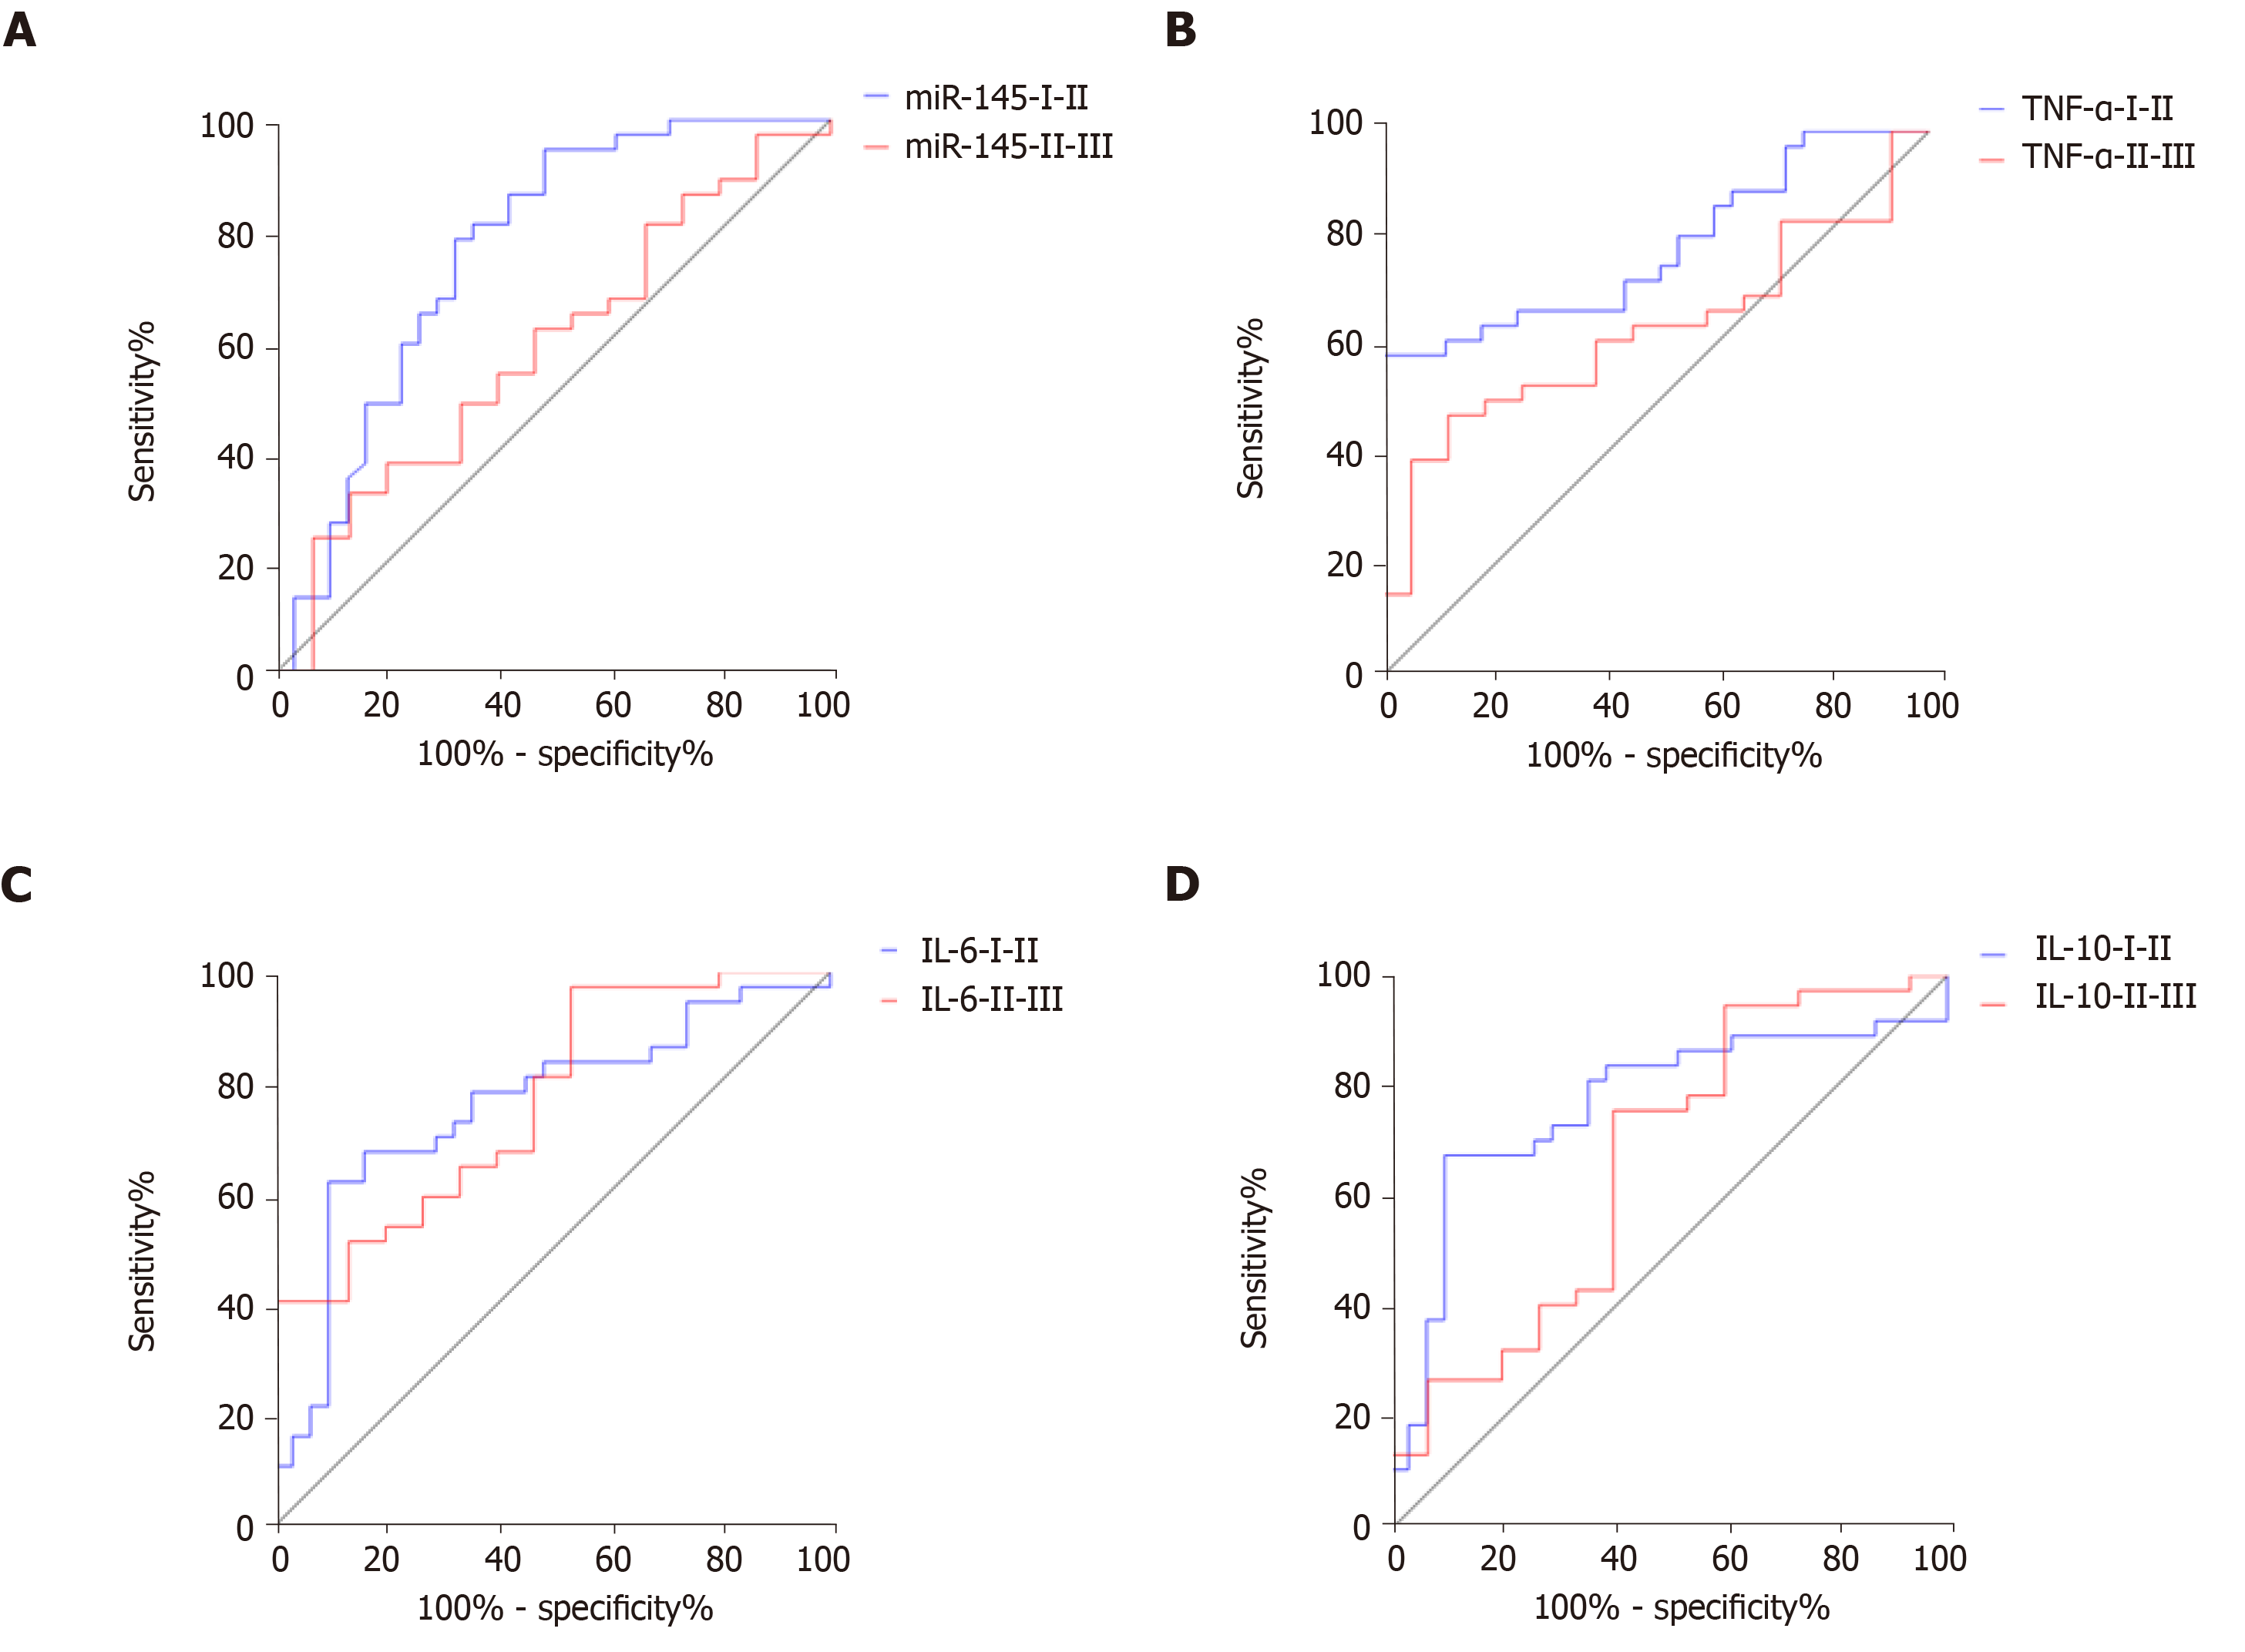
Figure 7 Receiver operating characteristic curve analysis of miR-145 and inflammatory factors in differentiating Kellgren-Lawrence grades.
- Citation: Wang XZ, Li WX. Changes of serum inflammatory factors and miR-145 expression in patients with osteoarthritis before and after treatment and their clinical value. World J Clin Cases 2019; 7(19): 2963-2975
- URL: https://www.wjgnet.com/2307-8960/full/v7/i19/2963.htm
- DOI: https://dx.doi.org/10.12998/wjcc.v7.i19.2963


