Copyright
©The Author(s) 2019.
World J Clin Cases. Jun 6, 2019; 7(11): 1302-1314
Published online Jun 6, 2019. doi: 10.12998/wjcc.v7.i11.1302
Published online Jun 6, 2019. doi: 10.12998/wjcc.v7.i11.1302
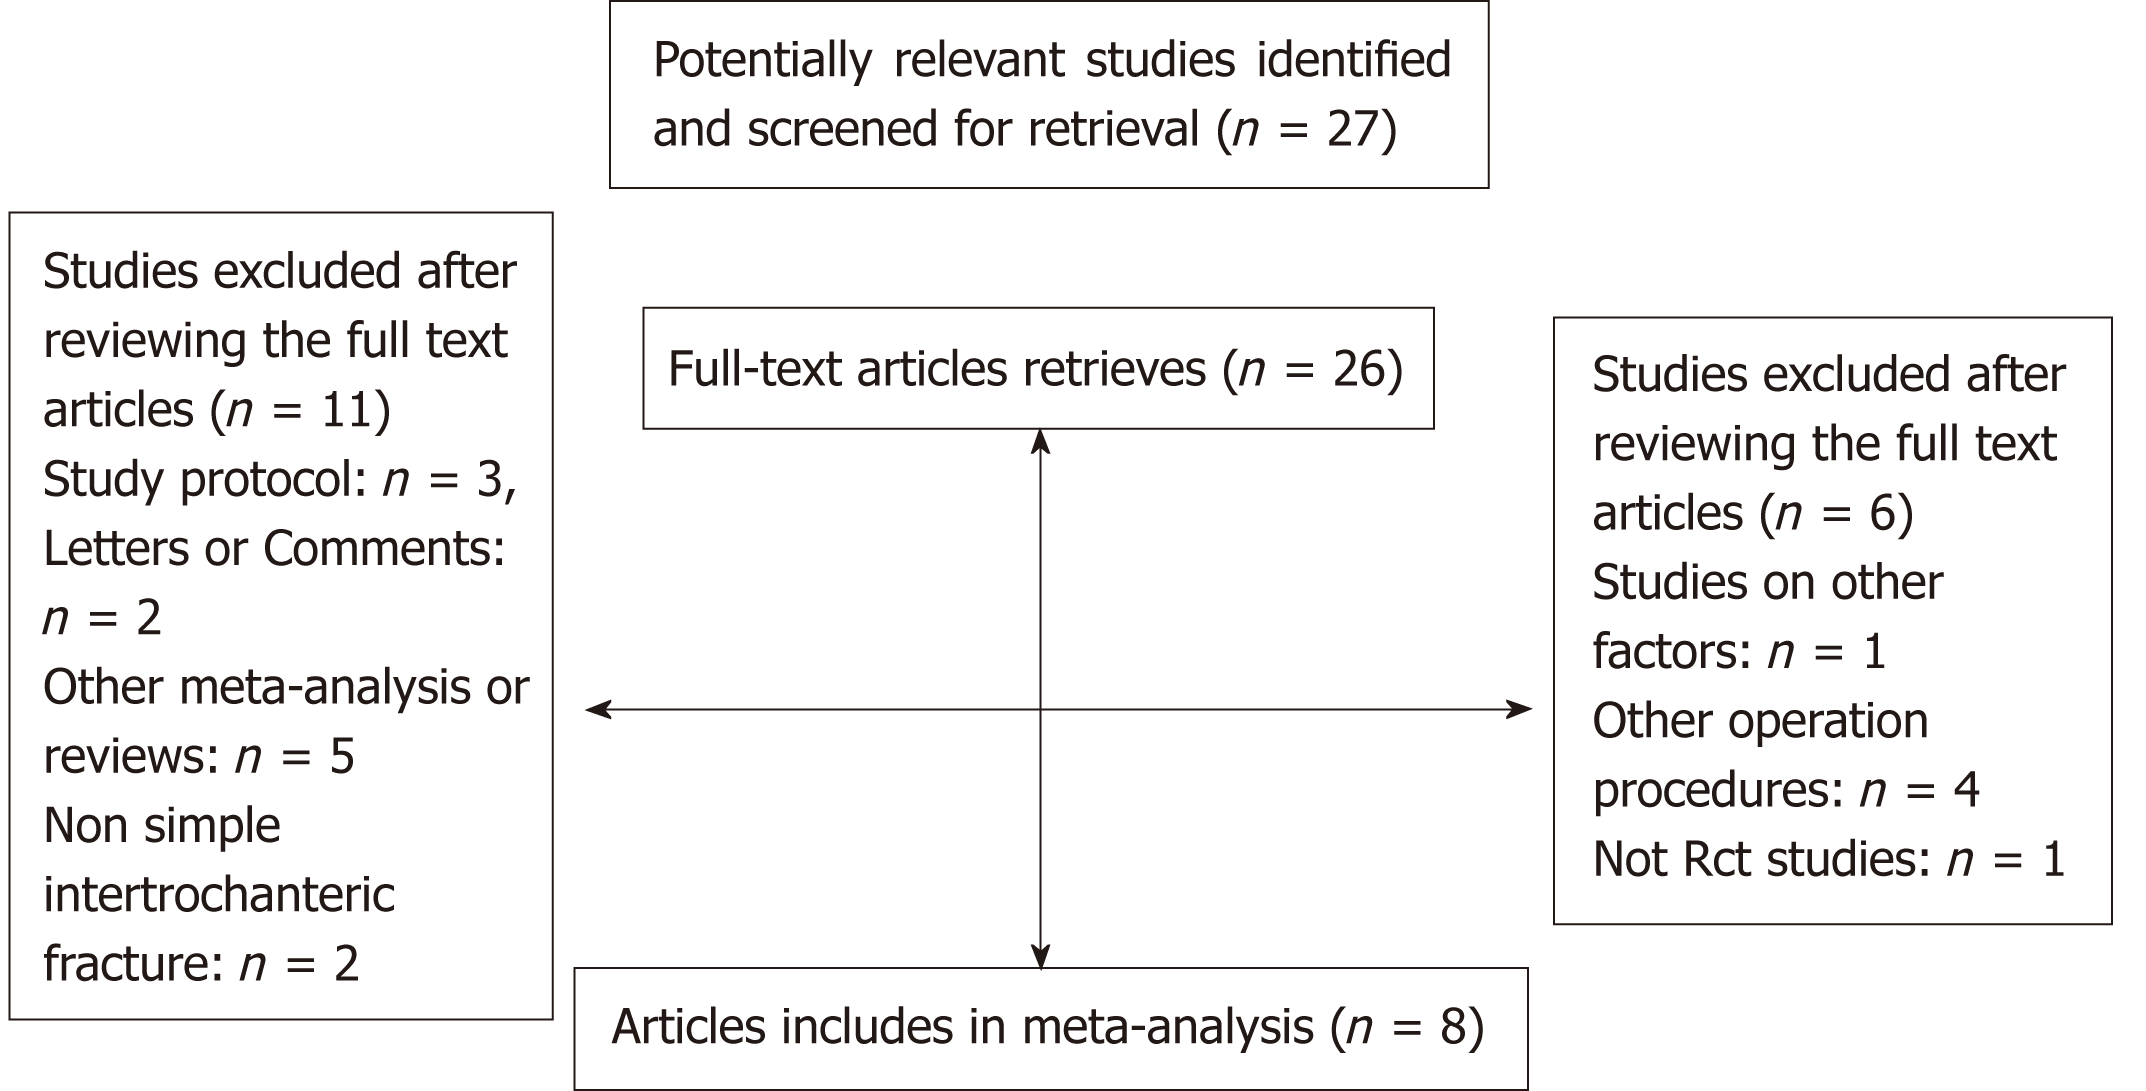
Figure 1 Flow chart of included and excluded studies.
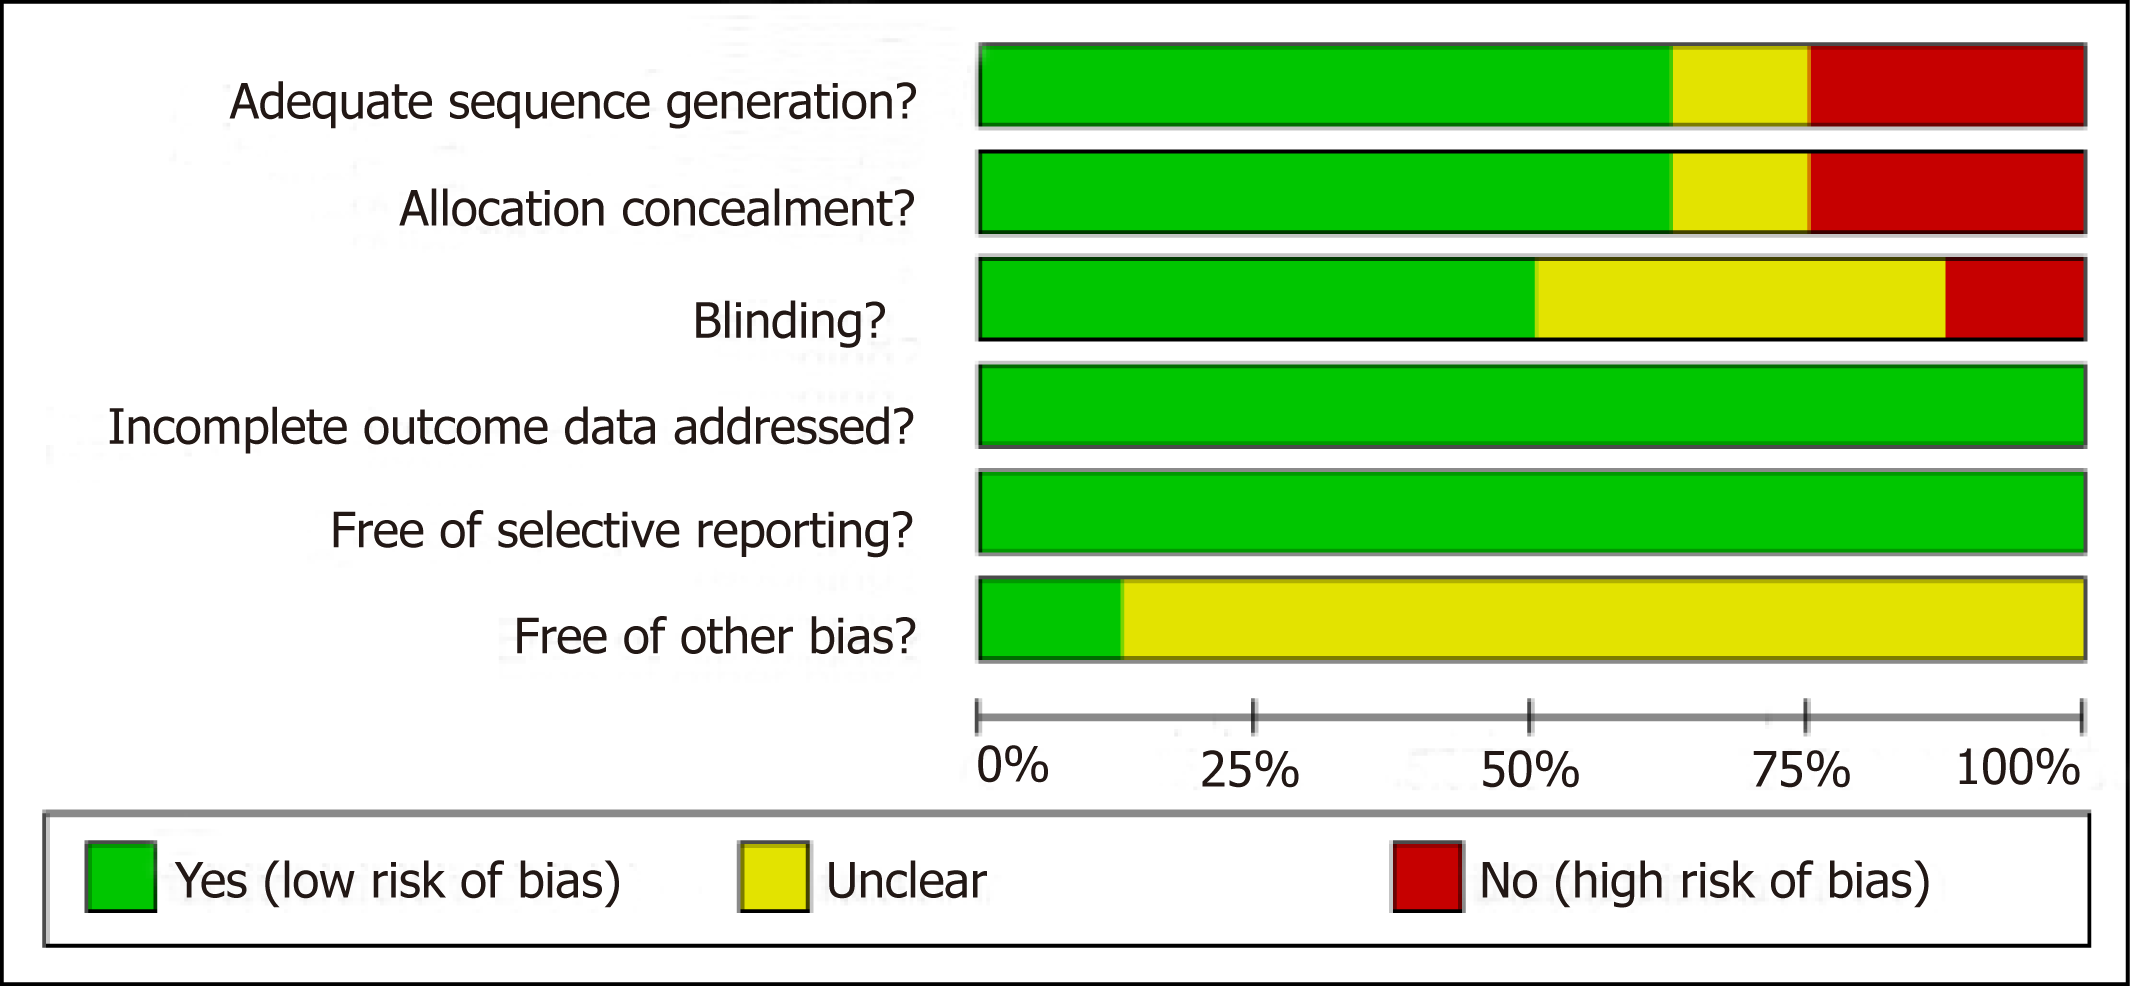
Figure 2 Risk of bias graph: Review authors' judgements about each risk of bias item presented as percentages across all included studies.
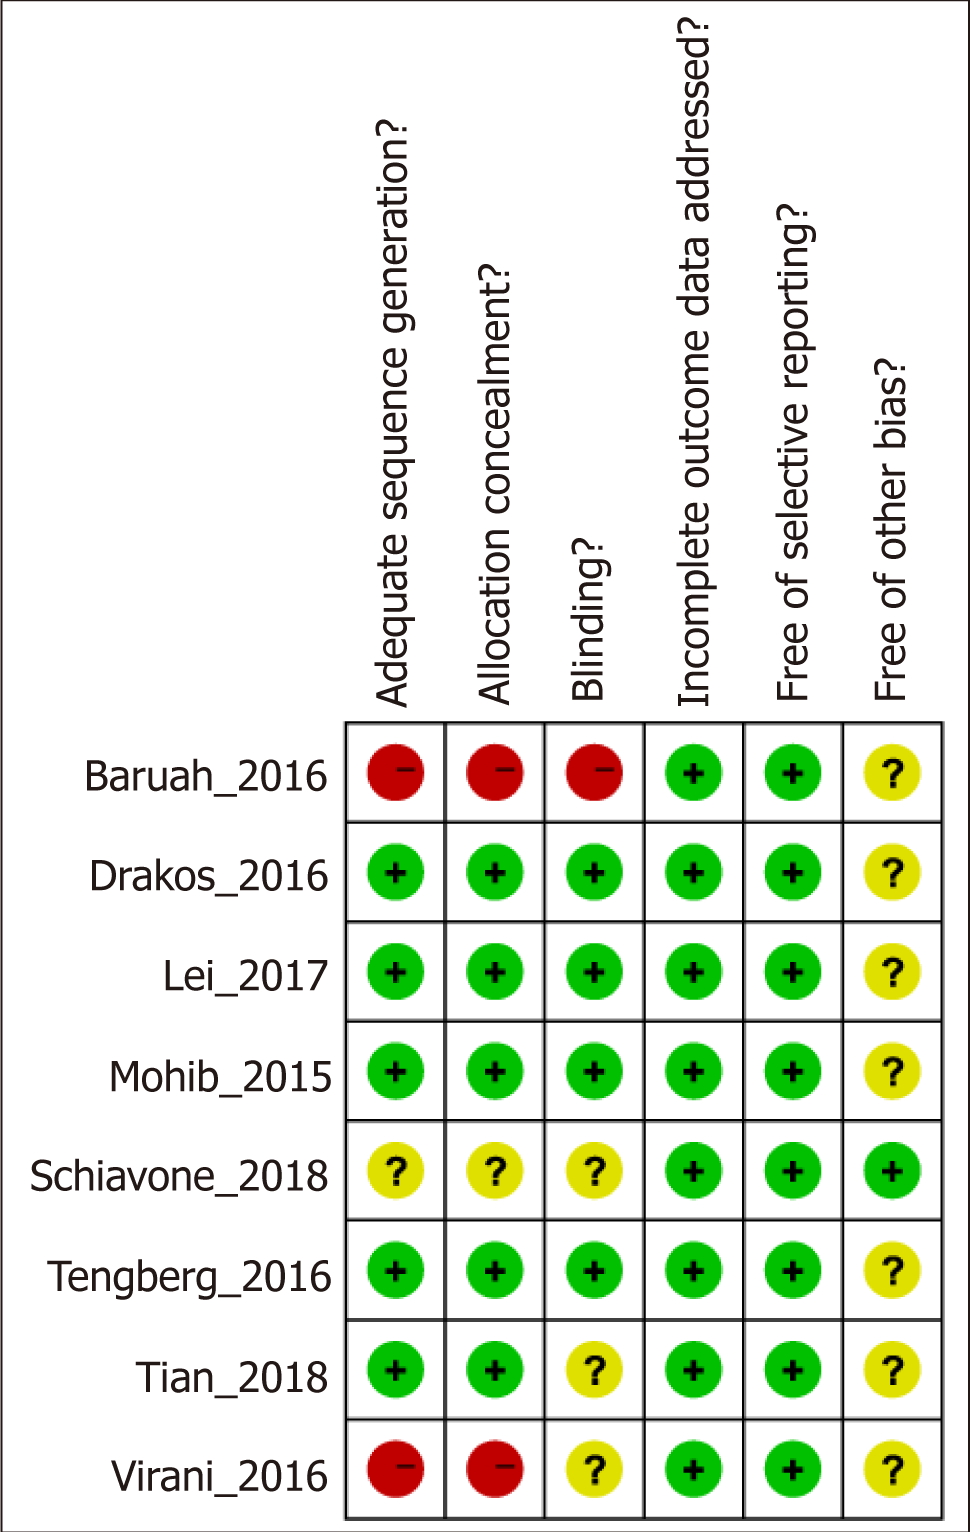
Figure 3 Risk of bias summary: Review authors' judgements about each risk of bias item for each included study.
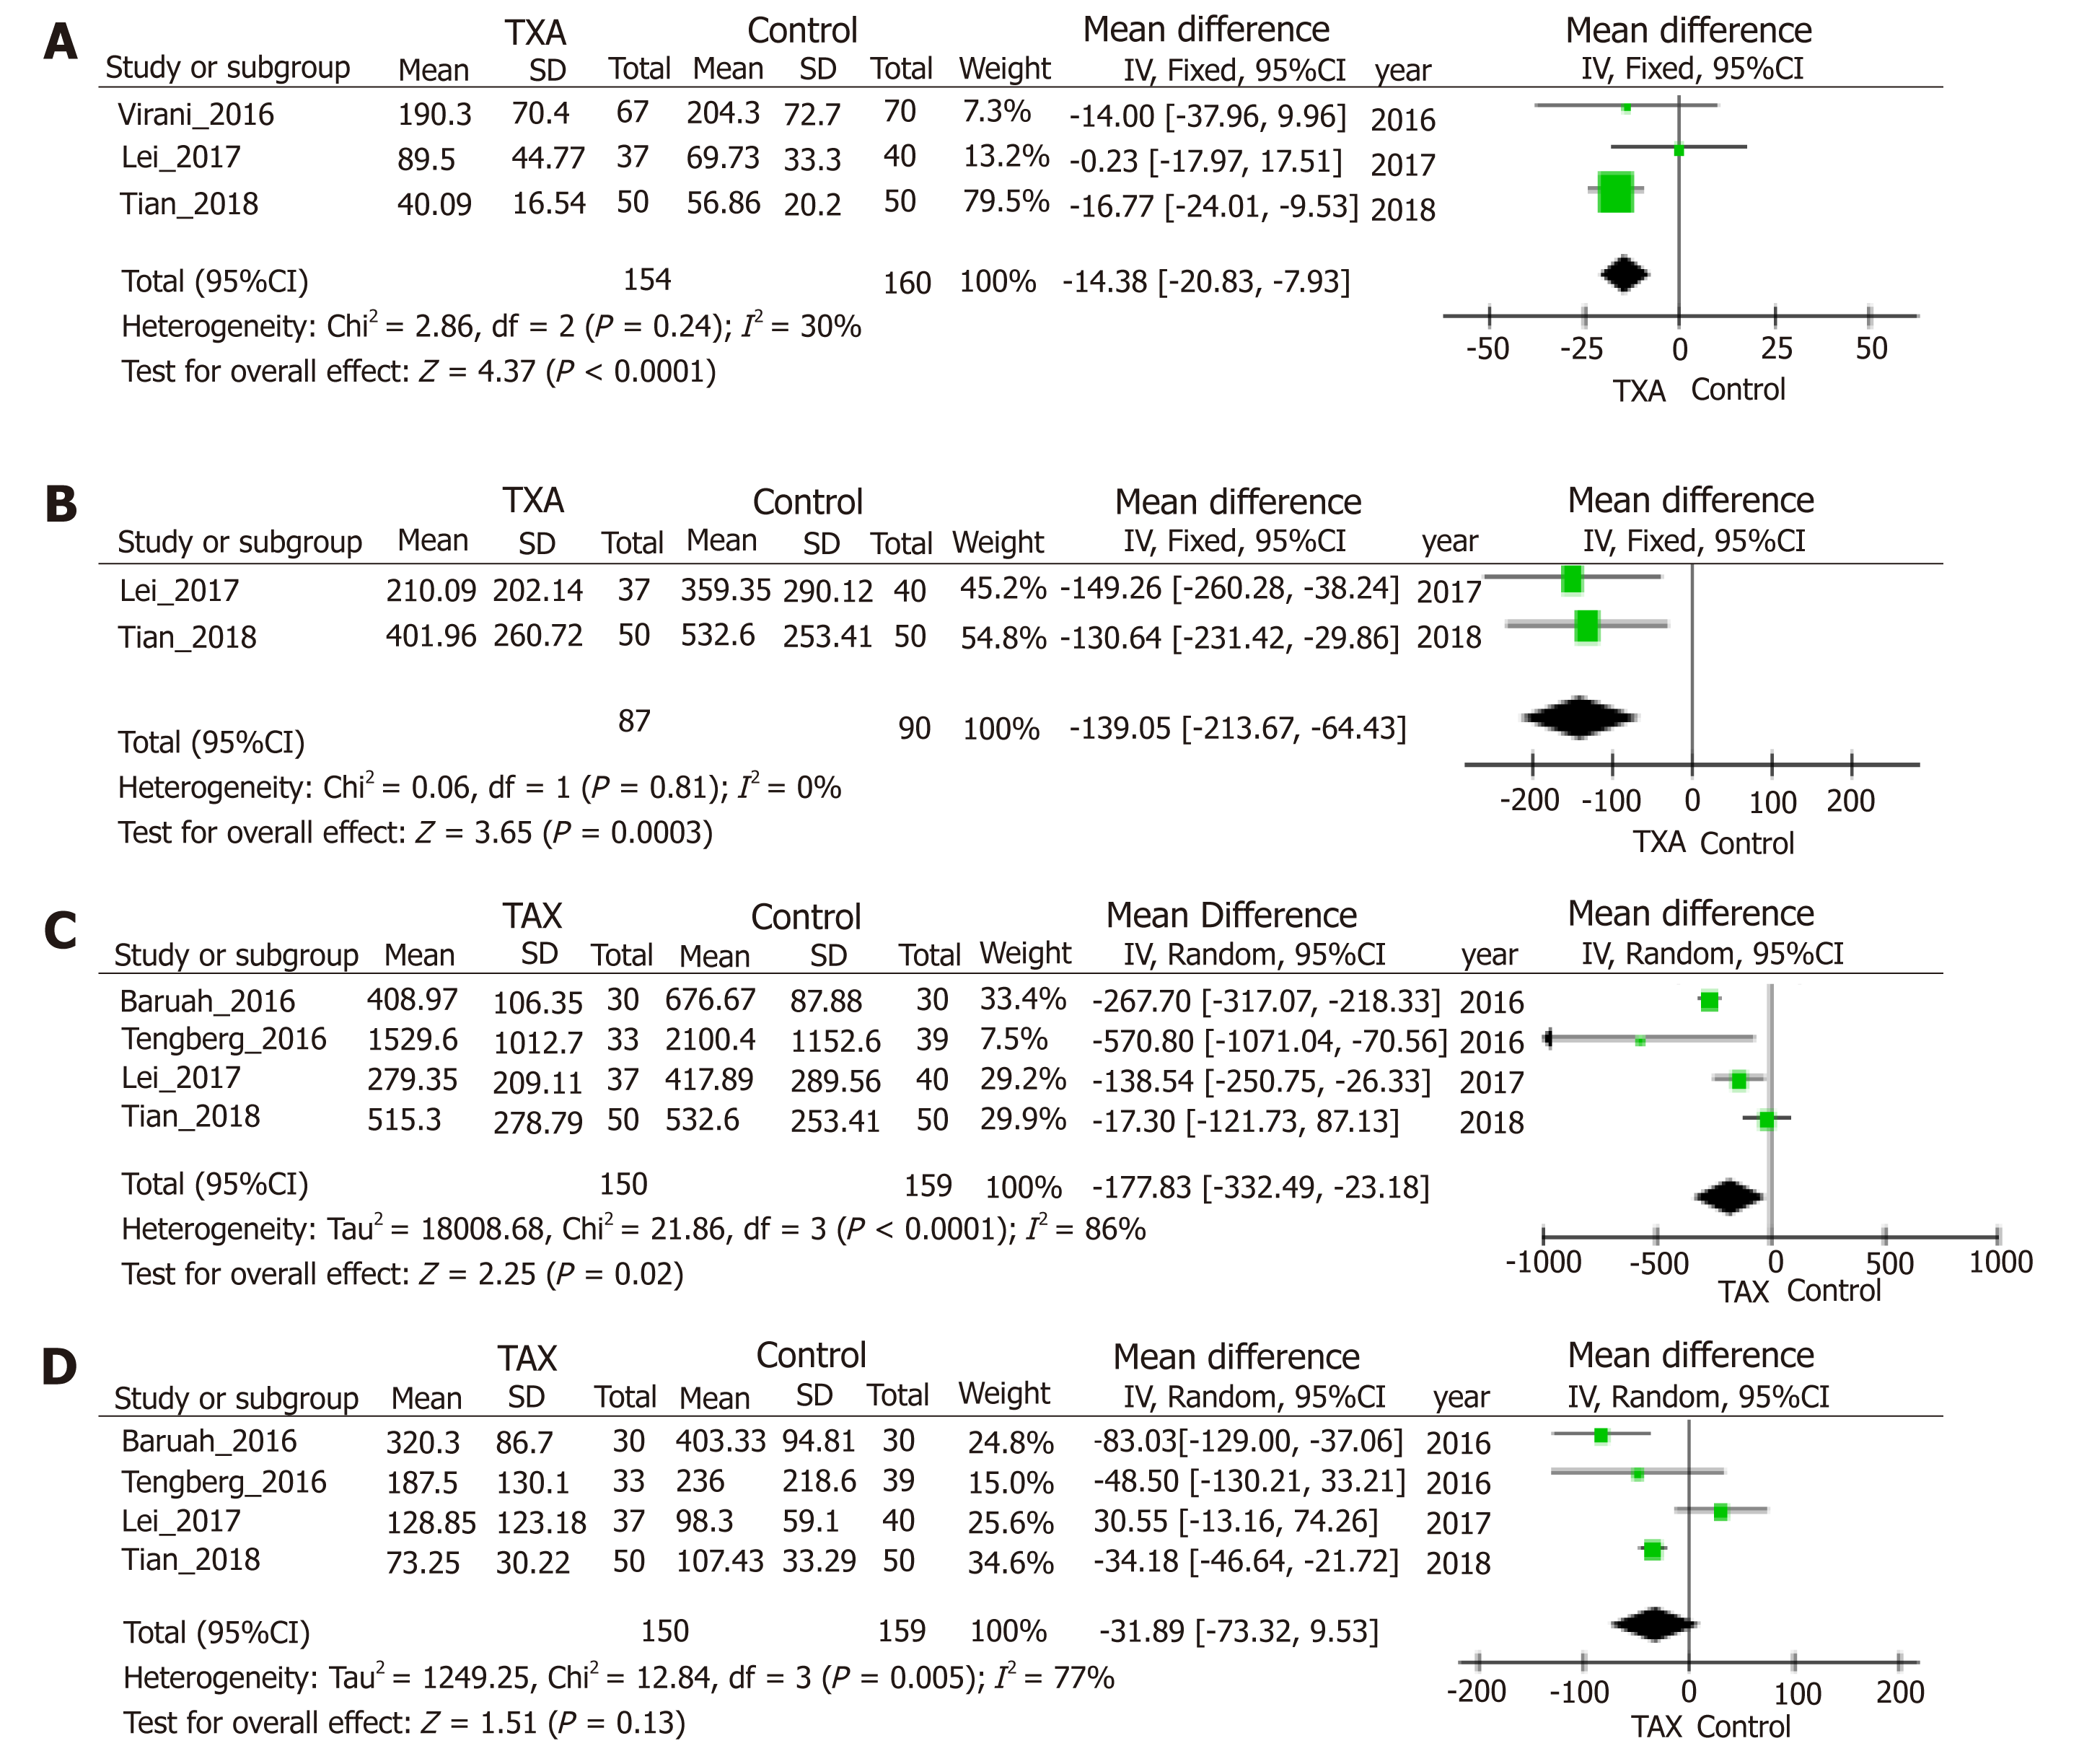
Figure 4 Forest plot diagram showing the effect of tranexamic acid on postoperative blood loss (A), hidden blood loss (B), total blood loss (C), and intraoperative blood loss (D).
TXA: Tranexamic acid; CI: Confidence interval; SD: Standard deviation; IV: Inverse variance; df: Degree of freedom.
Figure 5 Forest plot diagram showing the effect of tranexamic acid on deep venous thrombosis.
TXA: Tranexamic acid; CI: Confidence interval; df: Degree of freedom.
Figure 6 Forest plot diagram showing the effect of tranexamic acid on the number of patients who needed homologous transfusion.
TXA: Tranexamic acid; CI: Confidence interval; df: Degree of freedom.
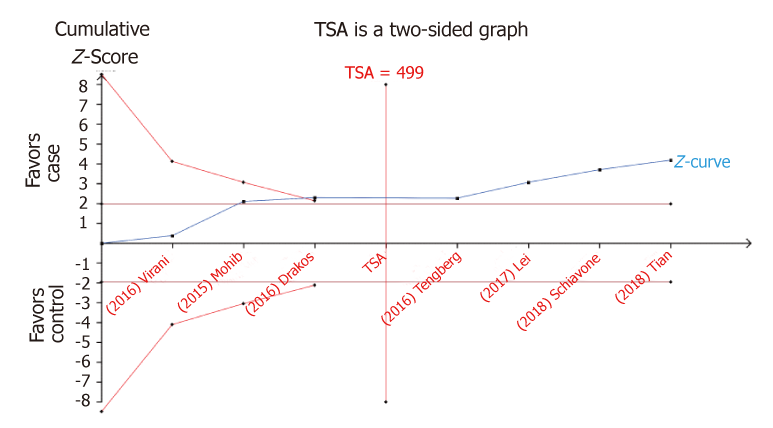
Figure 7 Trial sequential analysis of tranexamic acid on risk of intertrochanteric fractures.
The diversity-adjusted required information size was calculated using α = 0.05 (two sided), β = 0.20 (power 80%), and a relative risk reduction of 20%; the blue cumulative Z-curve was carried out using a random-effects model.
- Citation: Zhou XD, Li J, Fan GM, Huang Y, Xu NW. Efficacy and safety of tranexamic acid in elderly patients with intertrochanteric fracture: An updated meta-analysis. World J Clin Cases 2019; 7(11): 1302-1314
- URL: https://www.wjgnet.com/2307-8960/full/v7/i11/1302.htm
- DOI: https://dx.doi.org/10.12998/wjcc.v7.i11.1302


