Copyright
©The Author(s) 2018.
World J Clin Cases. Dec 6, 2018; 6(15): 995-1006
Published online Dec 6, 2018. doi: 10.12998/wjcc.v6.i15.995
Published online Dec 6, 2018. doi: 10.12998/wjcc.v6.i15.995
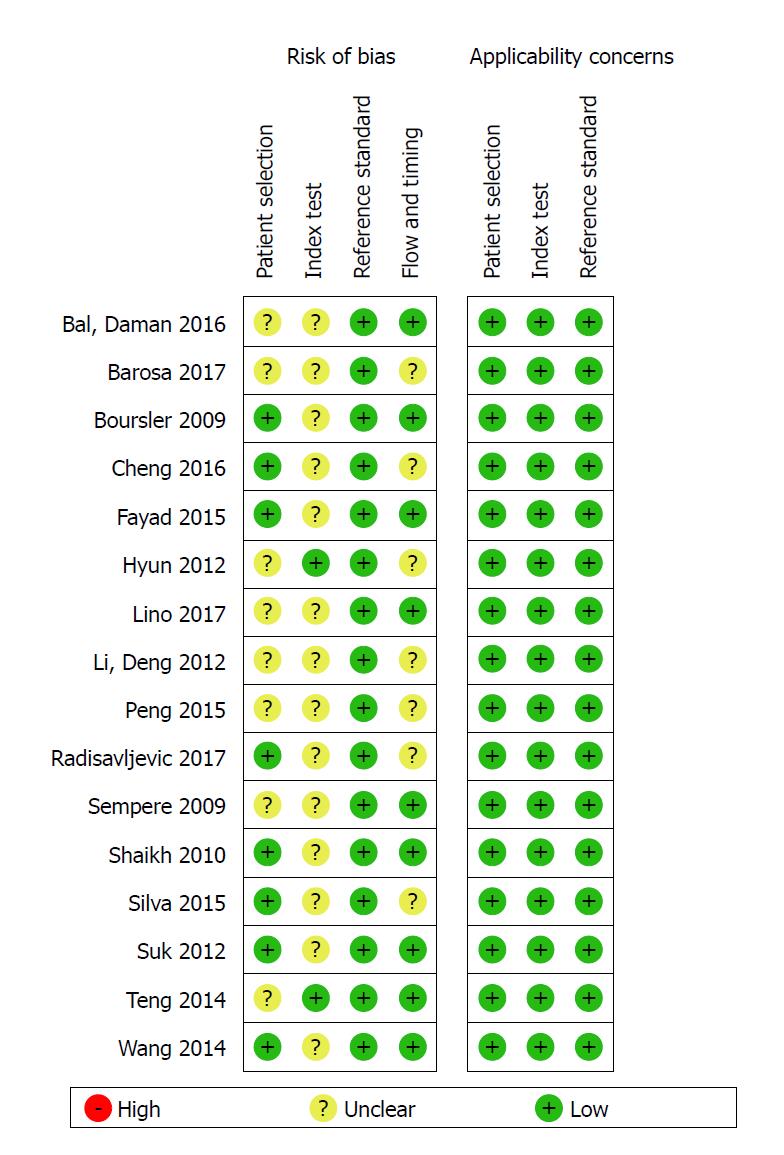
Figure 1 Results of quality assessment of the included studies using the Quality Assessment of Diagnostic Accuracy Studies 2 scale.
Figure 2 The overall quality of the included studies.
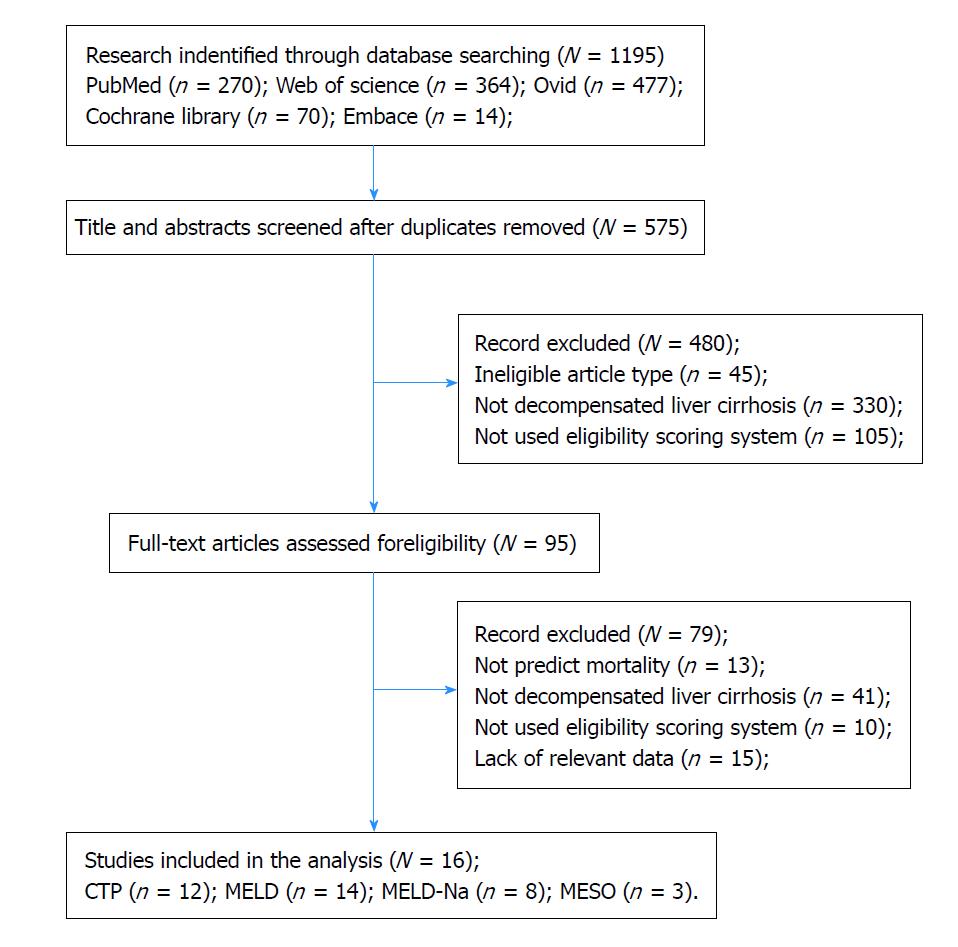
Figure 3 Flow diagram of study selection.
CTP: Child-Turcotte-Pugh; MELD: Model for End-stage Liver Disease score; MESO: MELD to Serum Sodium ratio.
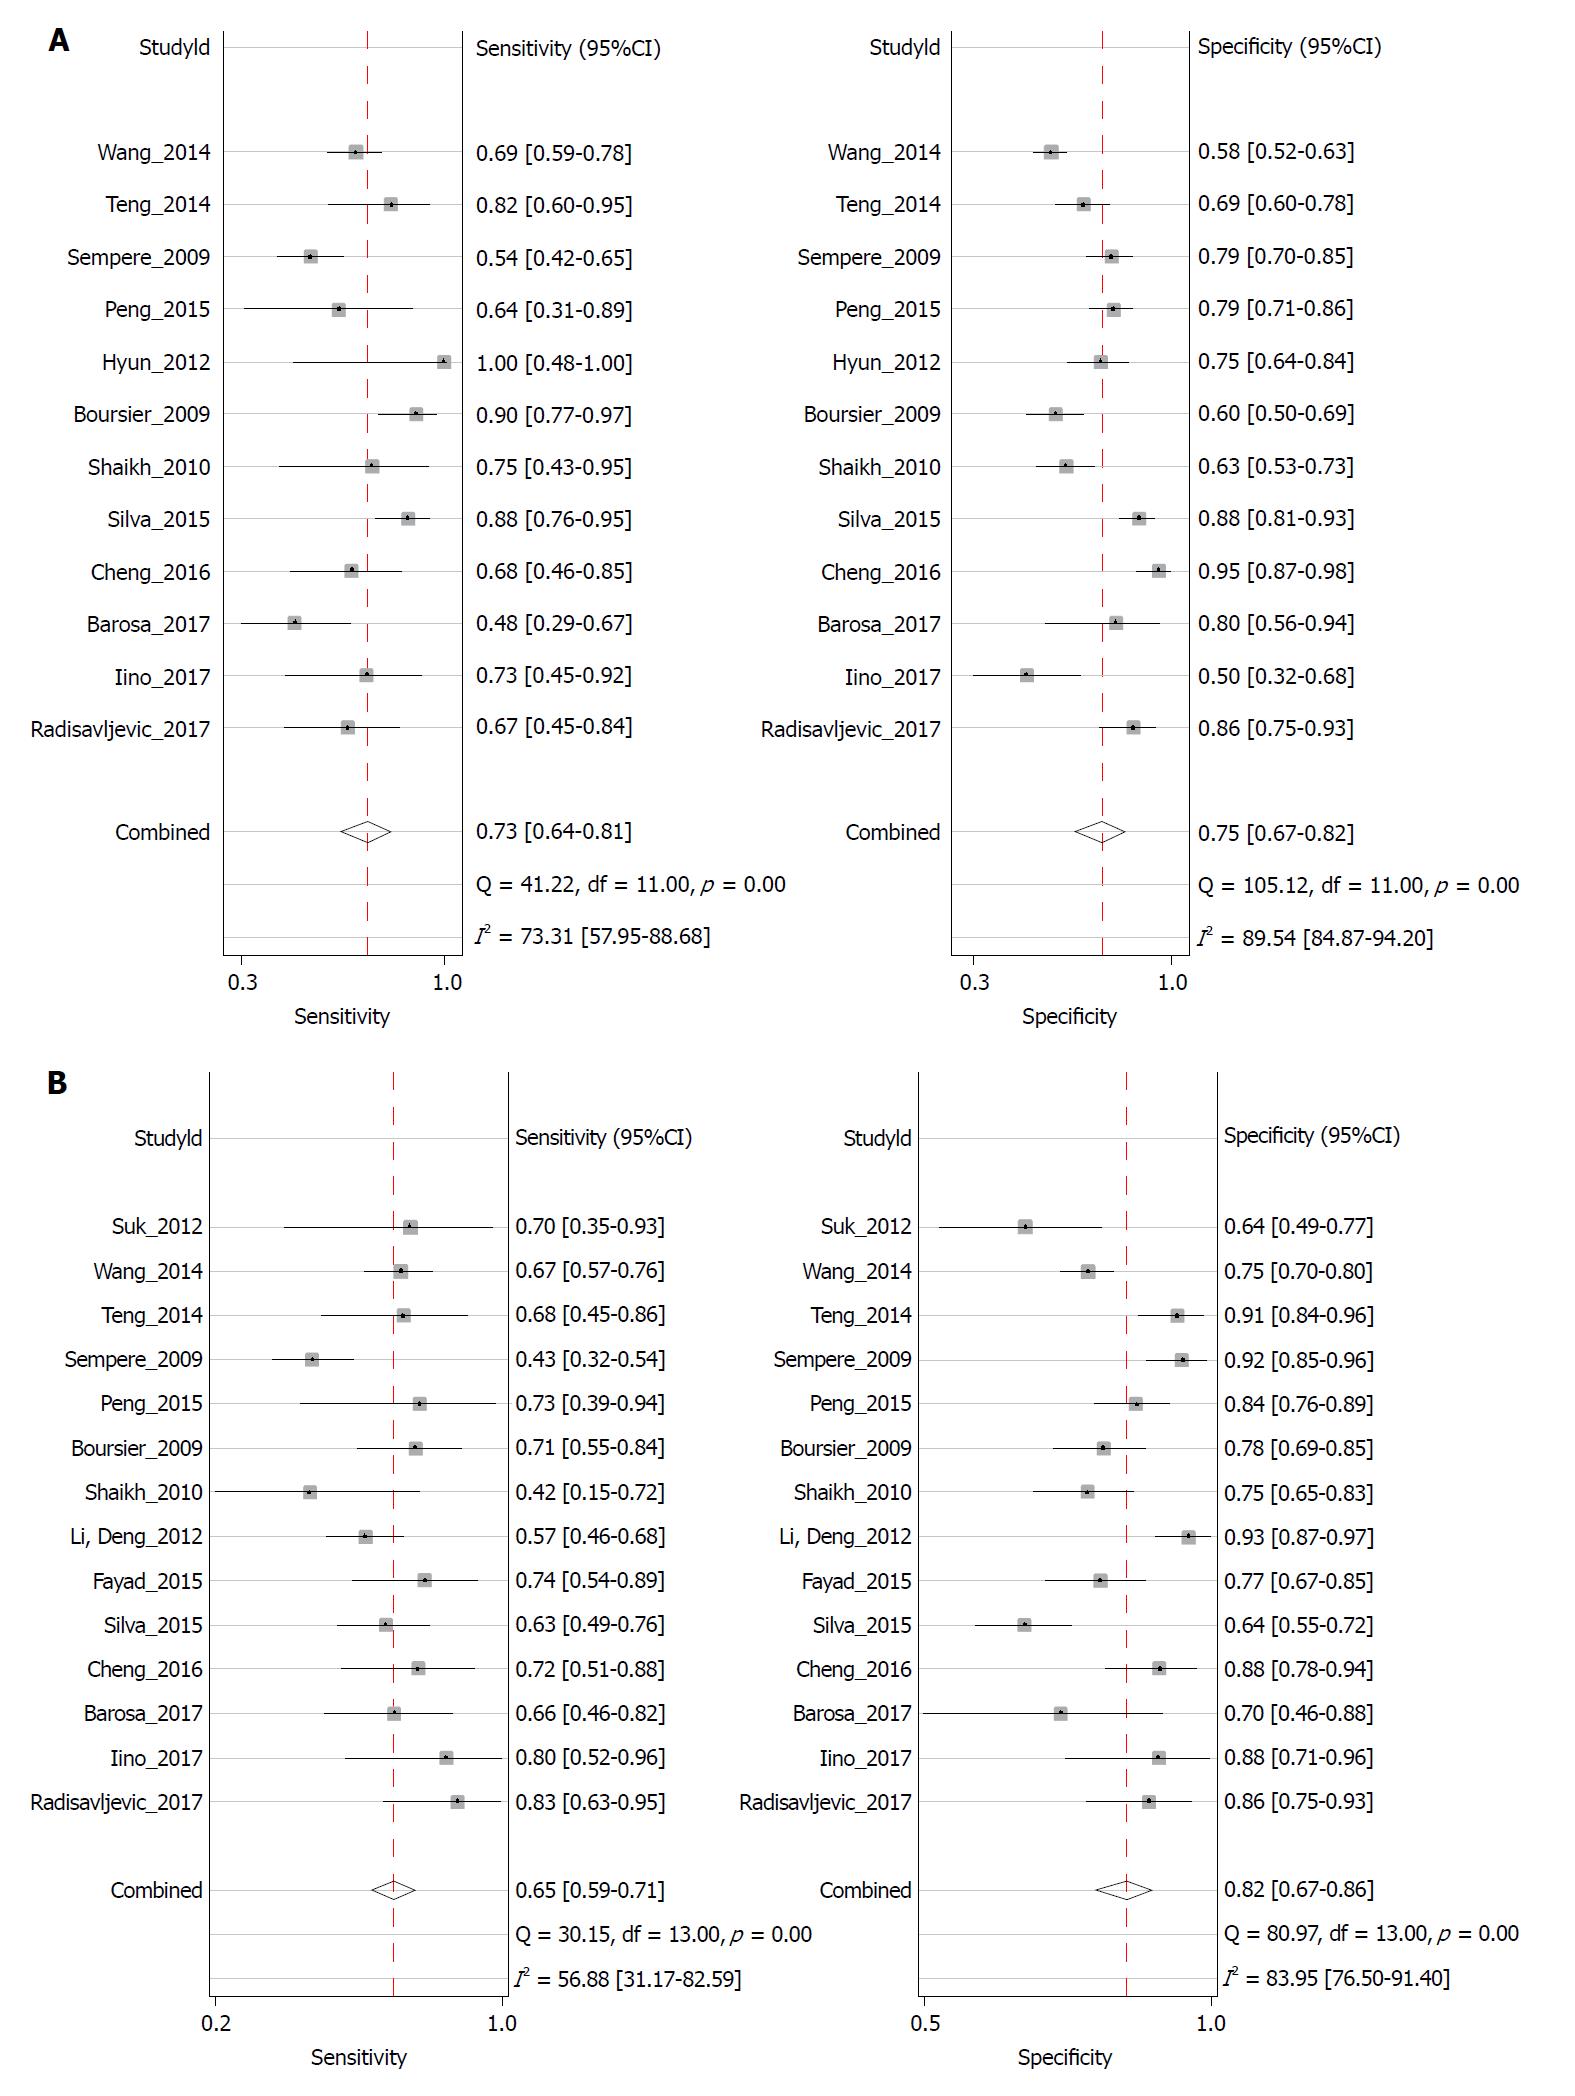
Figure 4 Forest plots of pooled results of different scoring systems.
A: Child-Turcotte-Pugh score; B: Model for End-stage Liver Disease score.
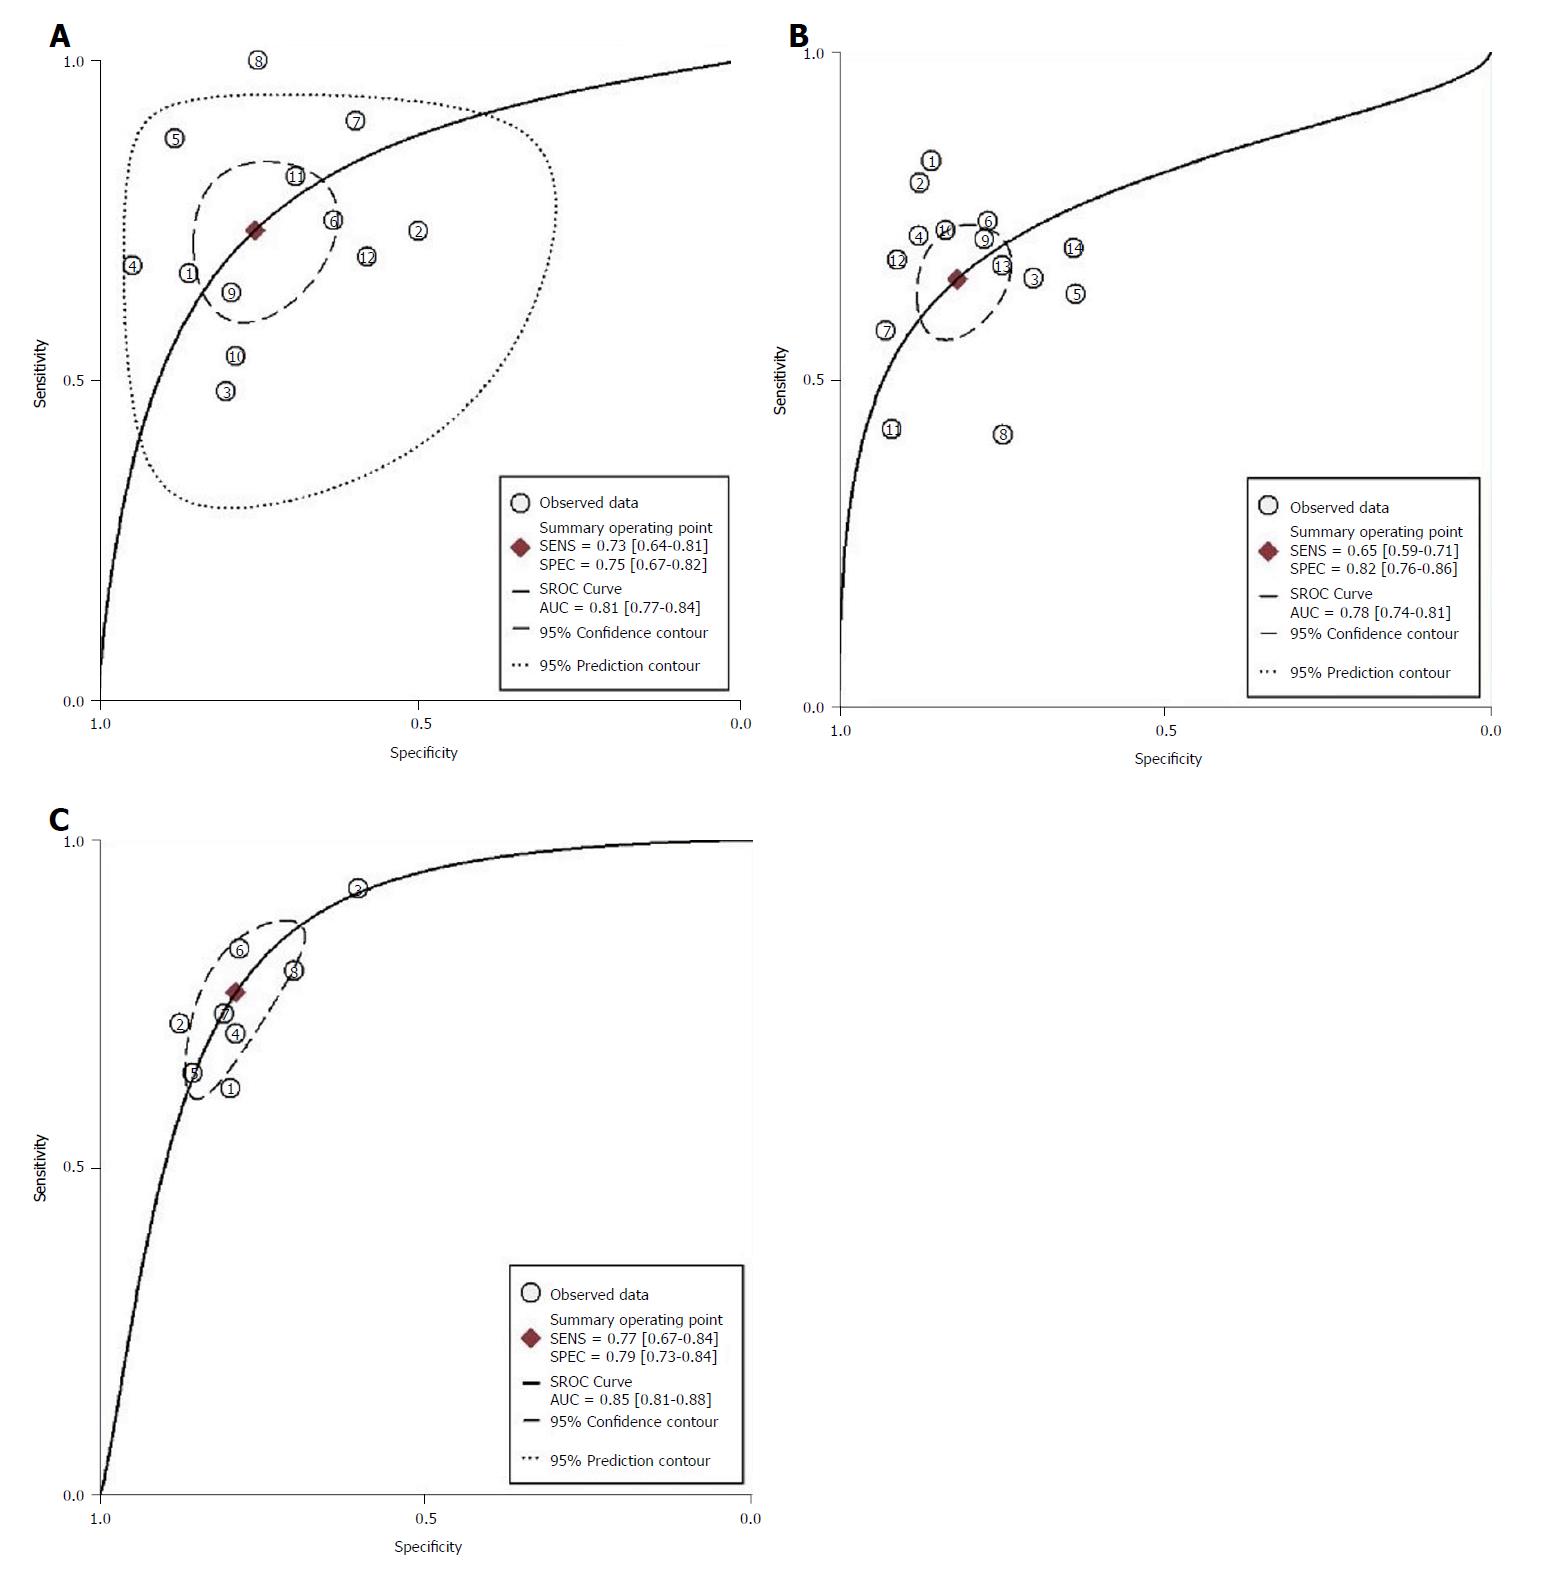
Figure 5 Summary receiver operating characteristic curves of different scoring systems.
A: Child-Turcotte-Pugh; B: Model for End-stage Liver Disease (MELD) score; C: MELD-Na.
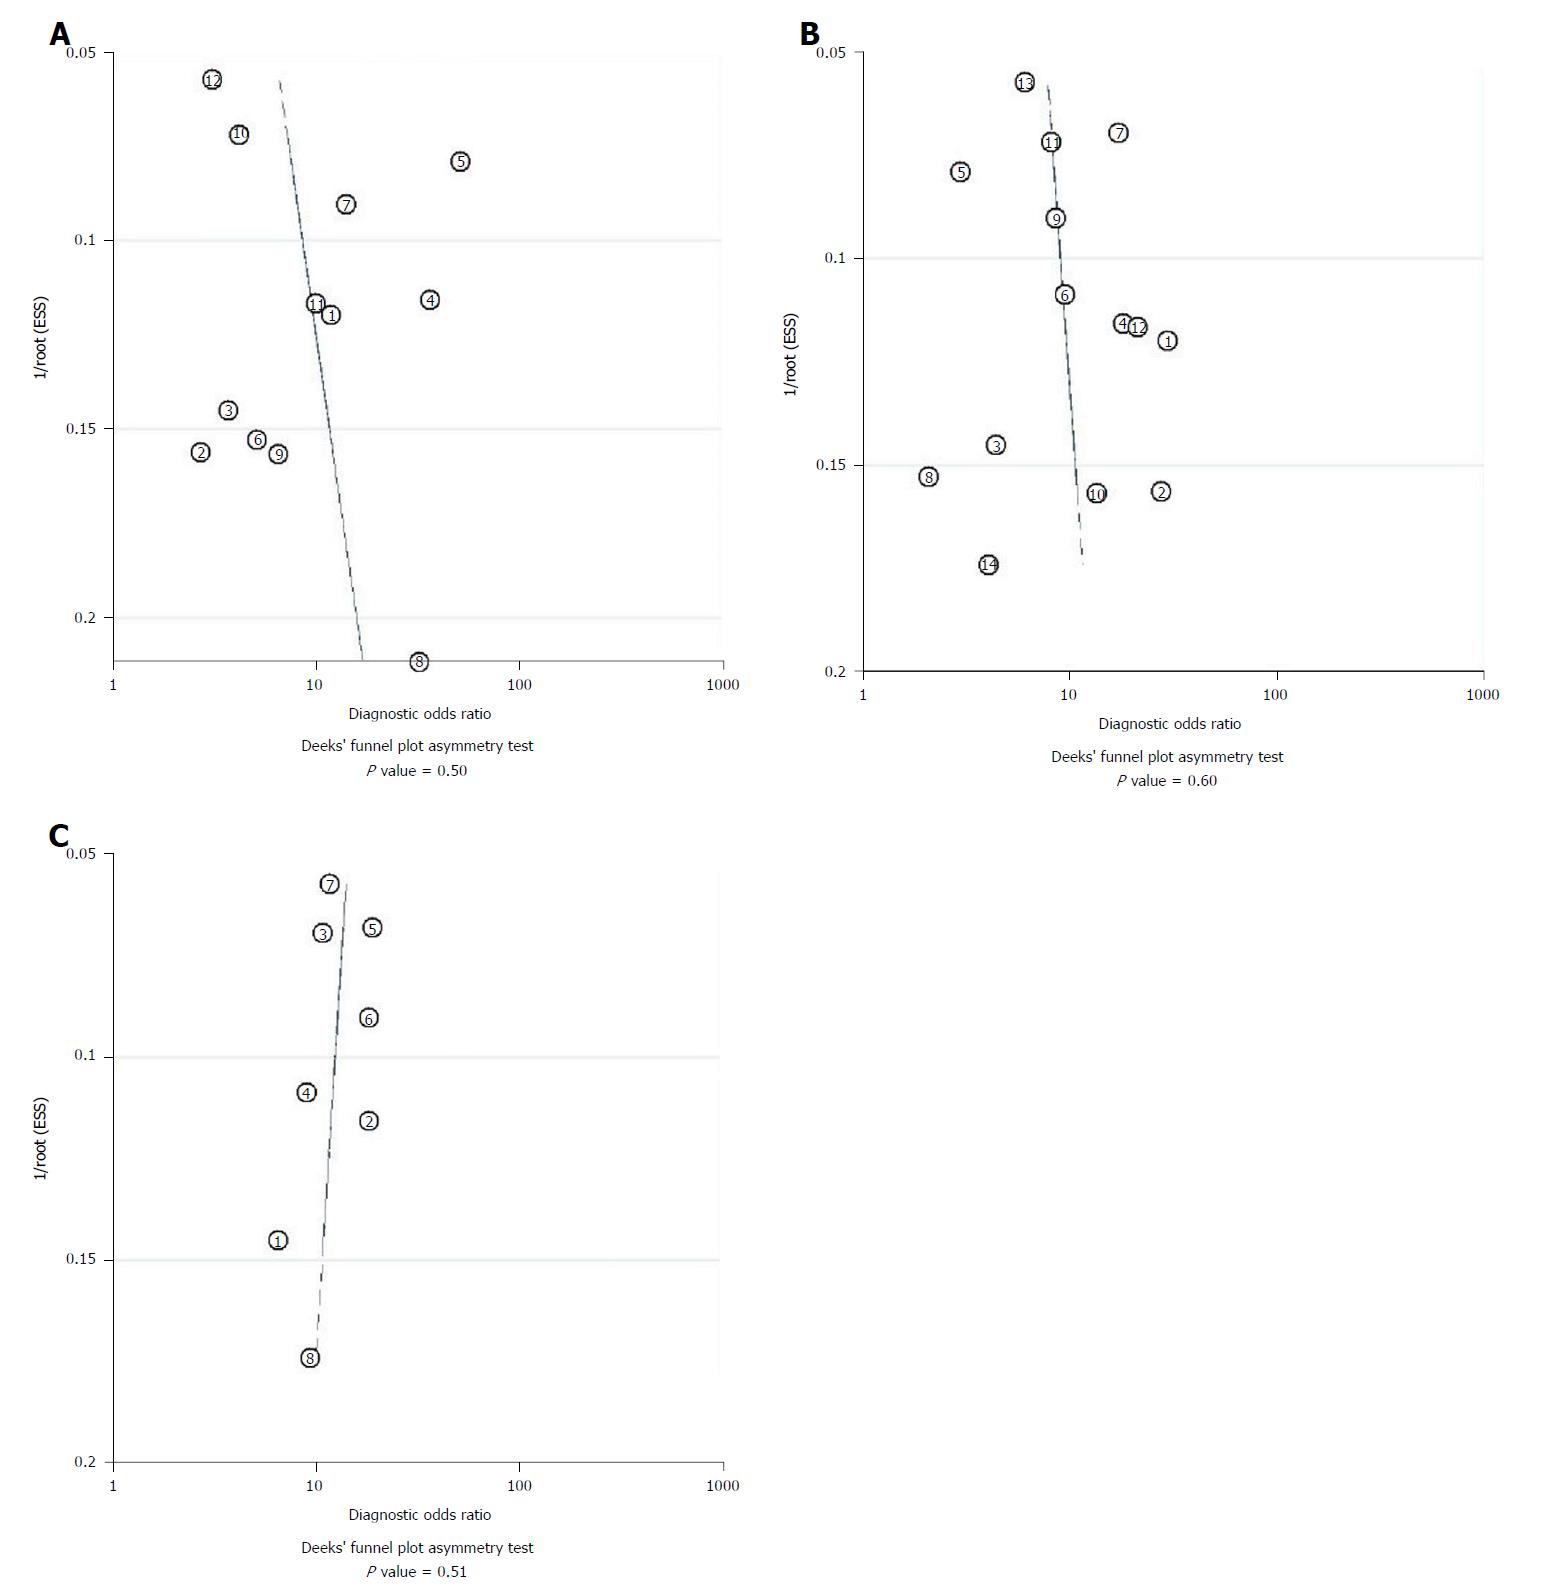
Figure 6 Results of linear regression test of funnel plot asymmetry for publication bias.
A: Child-Turcotte-Pugh; B: Model for End-stage Liver Disease (MELD) score; C: MELD-Na.
- Citation: Wu SL, Zheng YX, Tian ZW, Chen MS, Tan HZ. Scoring systems for prediction of mortality in decompensated liver cirrhosis: A meta-analysis of test accuracy. World J Clin Cases 2018; 6(15): 995-1006
- URL: https://www.wjgnet.com/2307-8960/full/v6/i15/995.htm
- DOI: https://dx.doi.org/10.12998/wjcc.v6.i15.995


