Copyright
©2014 Baishideng Publishing Group Co.
World J Clin Cases. Apr 16, 2014; 2(4): 90-93
Published online Apr 16, 2014. doi: 10.12998/wjcc.v2.i4.90
Published online Apr 16, 2014. doi: 10.12998/wjcc.v2.i4.90
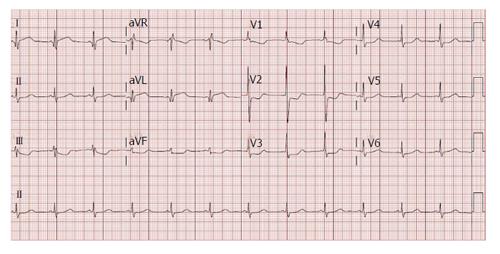
Figure 1 Electrocardiogram shows 1.
5 to 2 mm ST elevation in I, aVL, 1 to 2 mm ST depression in II , aVF, V1 to V4, and R/S ratio > 1 in V1 and V2.
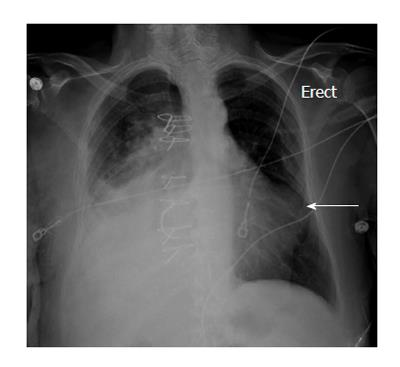
Figure 2 Chest X-ray: Convexity on the lateral wall of the cardiac silhouette (white arrow).
Figure 3 Transthoracic echocardiogram: Apical modified 4/5 chamber view showing bidirectional shunt through the left ventricular wall (white arrow).
Figure 4 Transesophageal echocardiogram: 2 chamber view confirming the to and fro flow between left ventricle and the pseudo aneurysm (white arrow).
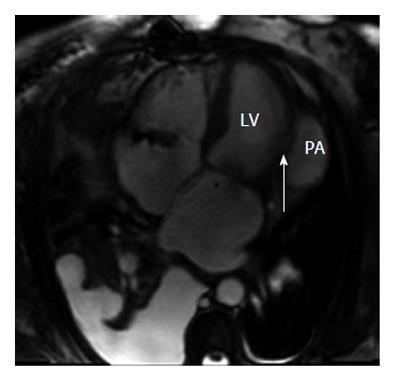
Figure 5 Cardiac magnetic resonance imaging: 4 chamber view showing the connection between the left ventricular cavity and the left ventricular pseudo aneurysm (white arrow).
LV: Left ventricular; PA: Pseudoaneurysm.
- Citation: Alapati L, Chitwood WR, Cahill J, Mehra S, Movahed A. Left ventricular pseudoaneurysm: A case report and review of the literature. World J Clin Cases 2014; 2(4): 90-93
- URL: https://www.wjgnet.com/2307-8960/full/v2/i4/90.htm
- DOI: https://dx.doi.org/10.12998/wjcc.v2.i4.90


