©The Author(s) 2025.
World J Clin Cases. Sep 26, 2025; 13(27): 108391
Published online Sep 26, 2025. doi: 10.12998/wjcc.v13.i27.108391
Published online Sep 26, 2025. doi: 10.12998/wjcc.v13.i27.108391
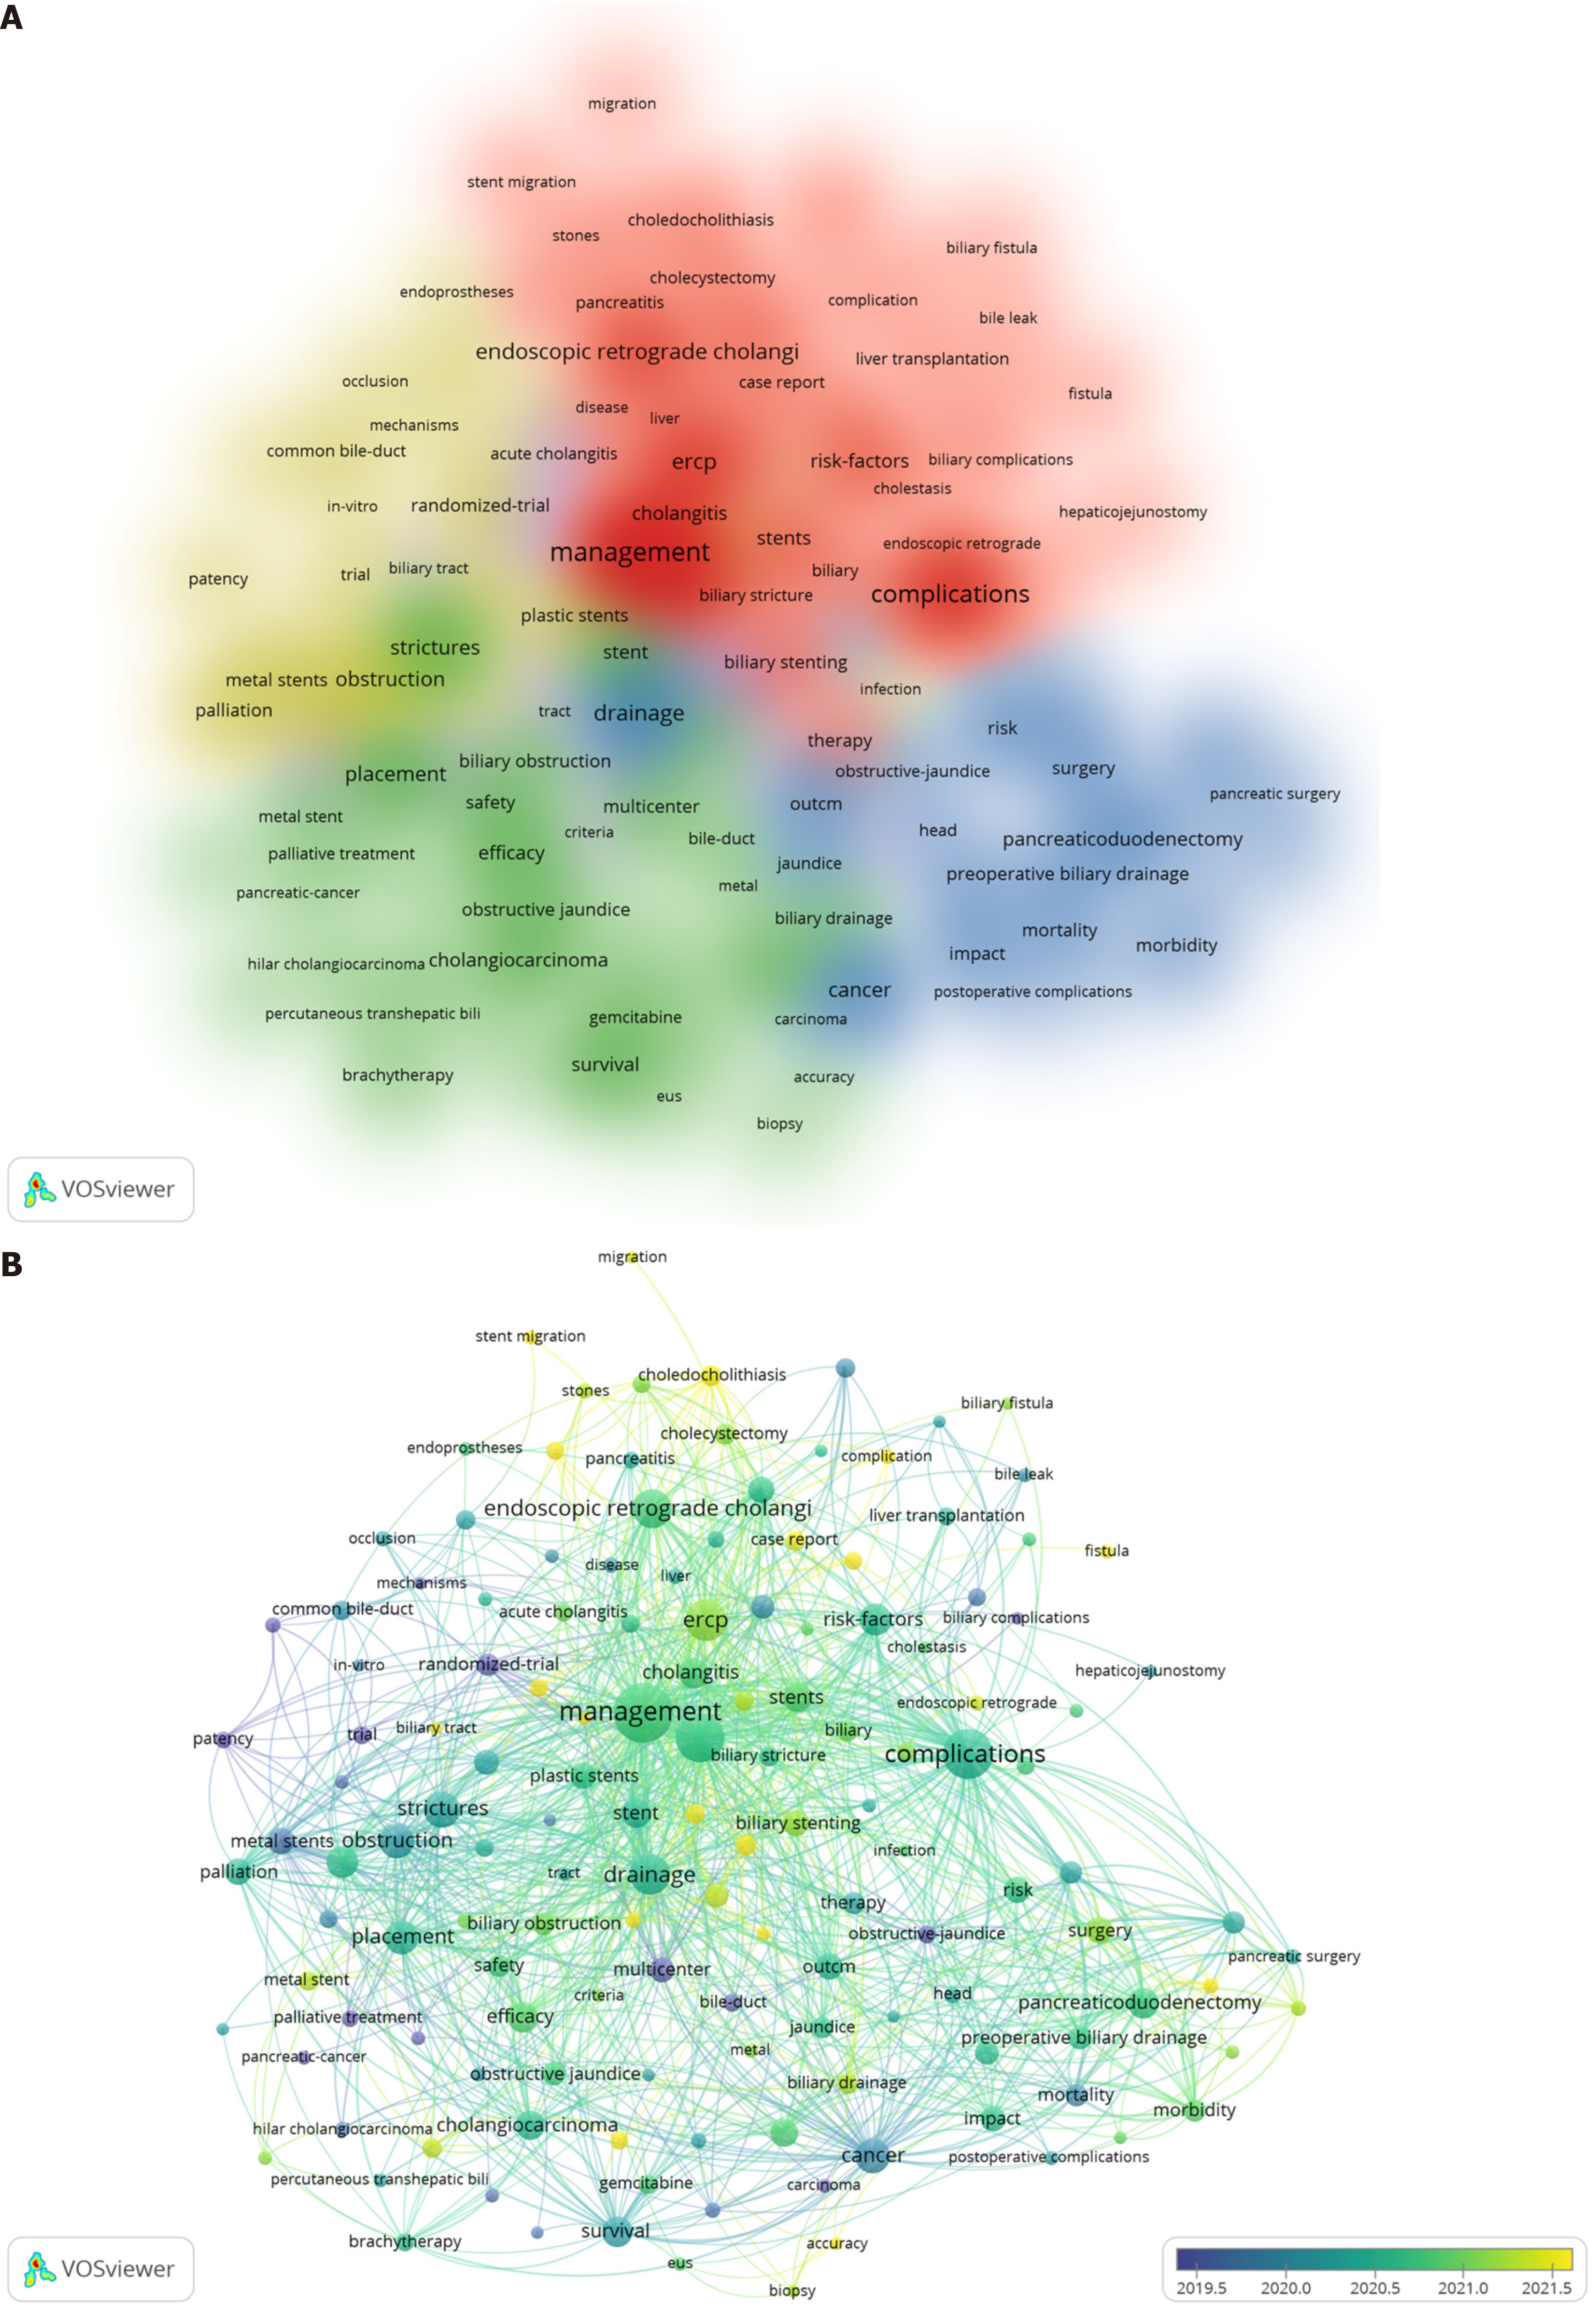
Figure 1 Keyword analysis based on VOSviewer.
A: Biliary Stent Clustering Diagram; B: Timeline of Biliary Stent Development. The statistical density (quantity) of high-frequency keywords represents research hotspots. In the map, the size of the nodes indicates the number of occurrences—the larger the node, the greater the total number of times the keyword or topic appears. The thickness of the connecting lines between nodes represents the degree of association between each keyword or topic.
- Citation: Zhang LB, Wang Y, Yang XJ. Bioresorbable biliary stents: A step forward. World J Clin Cases 2025; 13(27): 108391
- URL: https://www.wjgnet.com/2307-8960/full/v13/i27/108391.htm
- DOI: https://dx.doi.org/10.12998/wjcc.v13.i27.108391


