Copyright
©The Author(s) 2024.
World J Clin Cases. Dec 6, 2024; 12(34): 6721-6727
Published online Dec 6, 2024. doi: 10.12998/wjcc.v12.i34.6721
Published online Dec 6, 2024. doi: 10.12998/wjcc.v12.i34.6721
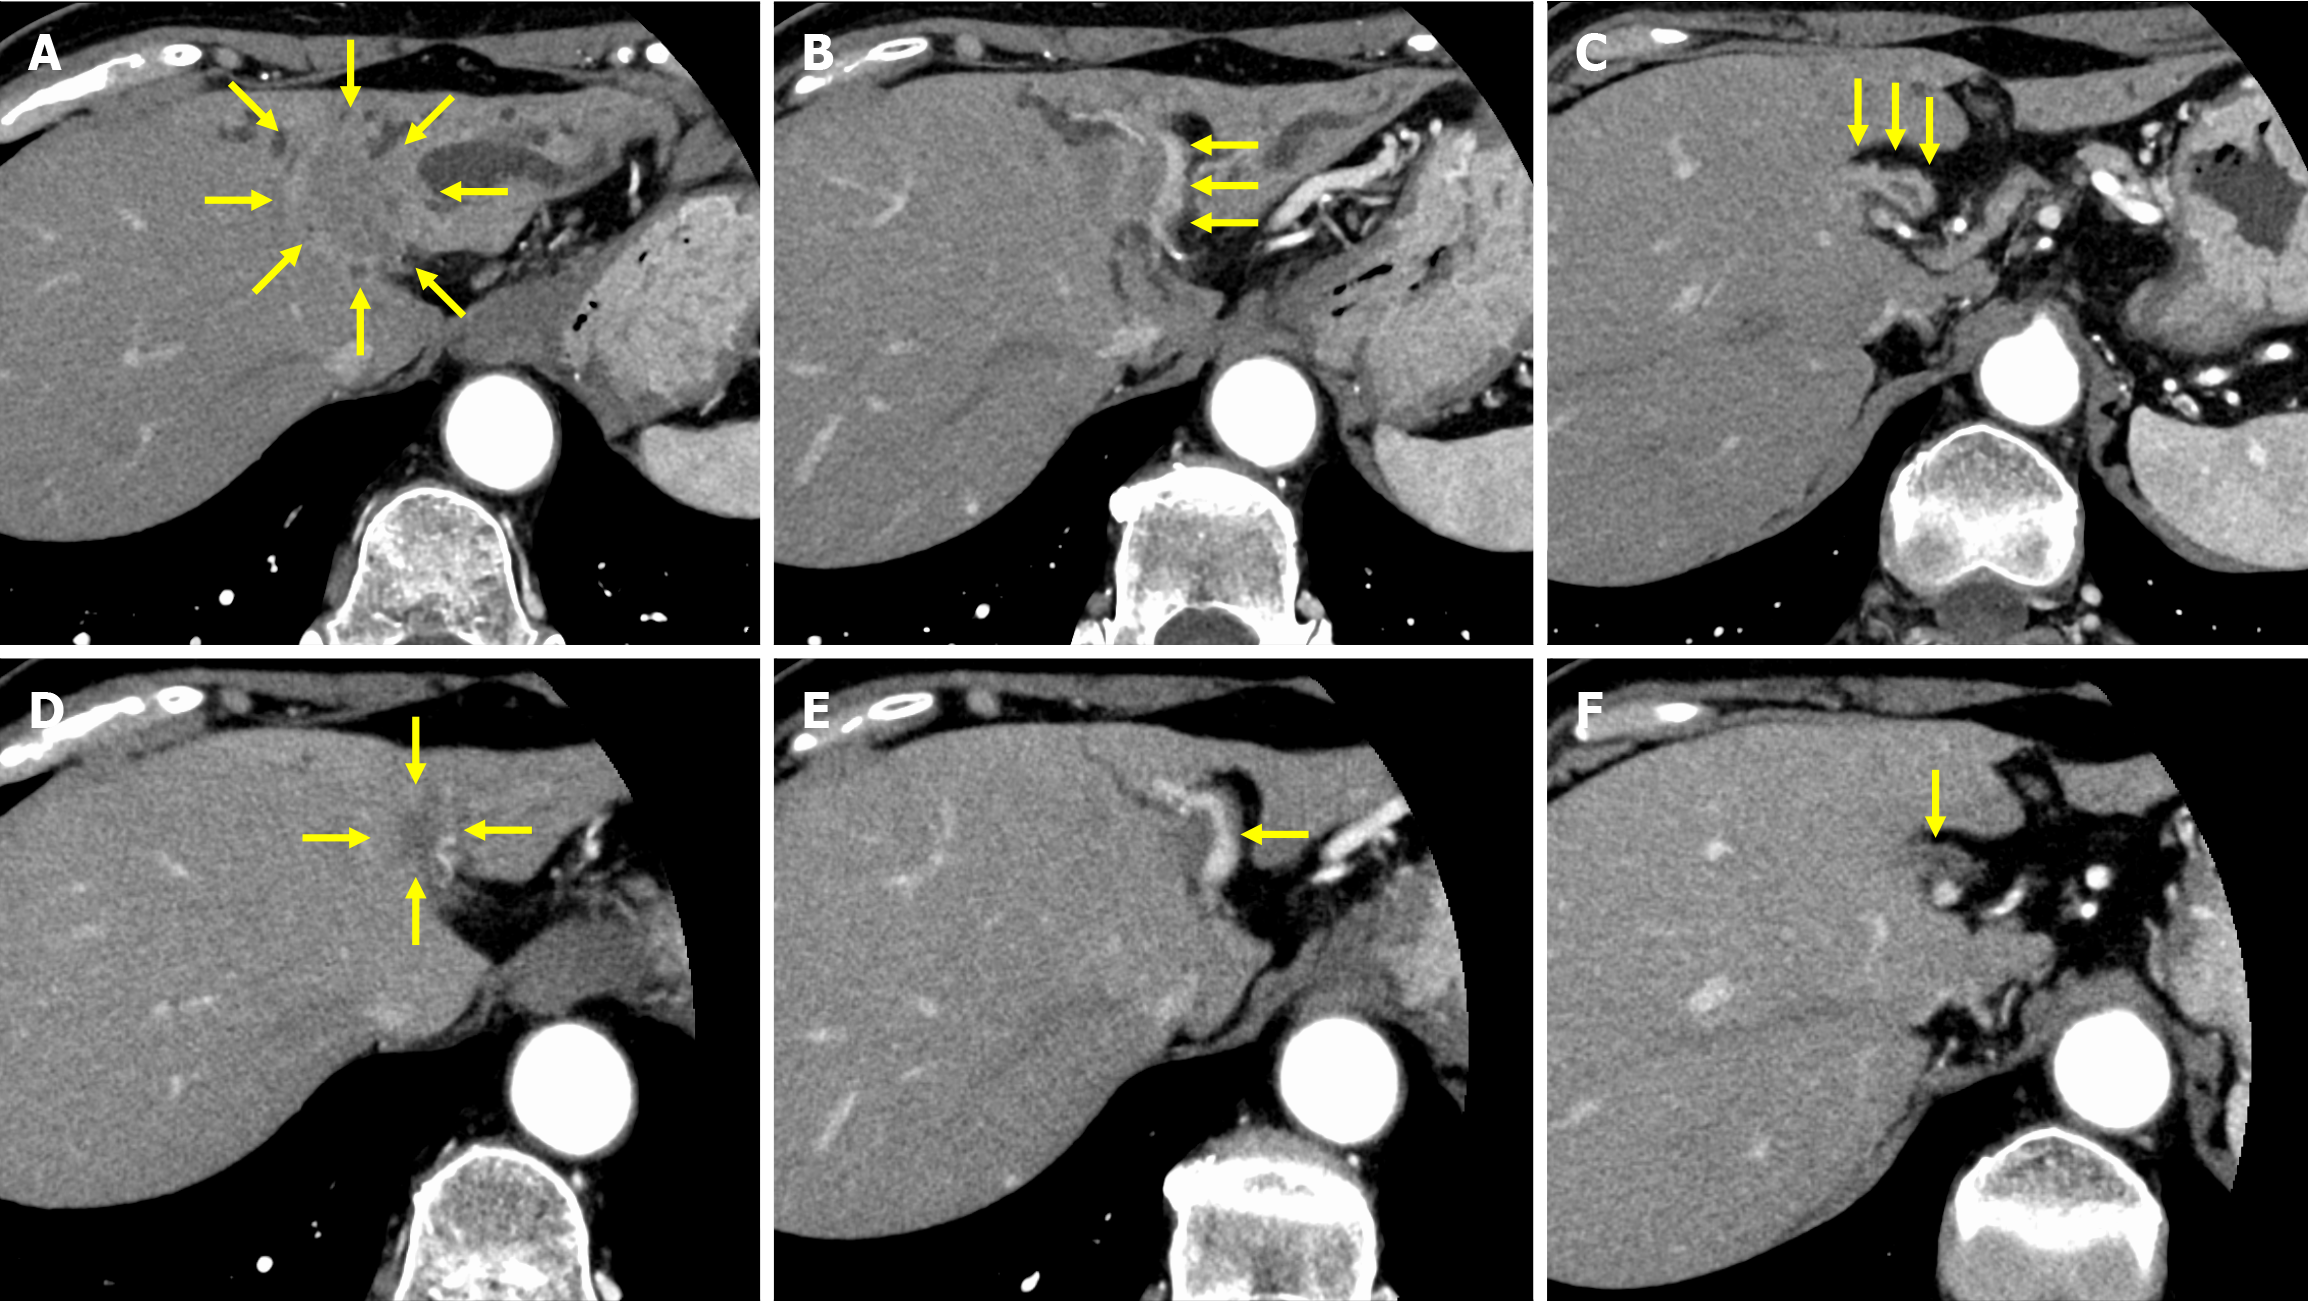
Figure 1 Dynamic computed tomography before and after eight courses of gemcitabine and cisplatin plus durvalumab.
A: Advanced intrahepatic cholangiocarcinoma at the left hepatic duct; B: Tumor invasion of the umbilical portion of the portal vein; C: Suspected direct invasion of the extrahepatic bile duct. Bile duct wall enhancement continuous from the tumor extended to the anterior and posterior sectoral duct; D: Tumor showing remarkable shrinkage; E: Amelioration of the dilation of the intrahepatic bile duct; F: Bile duct wall enhancement showing significant decrease at the anterior and posterior sectoral duct. Yellow arrows indicate the following findings.
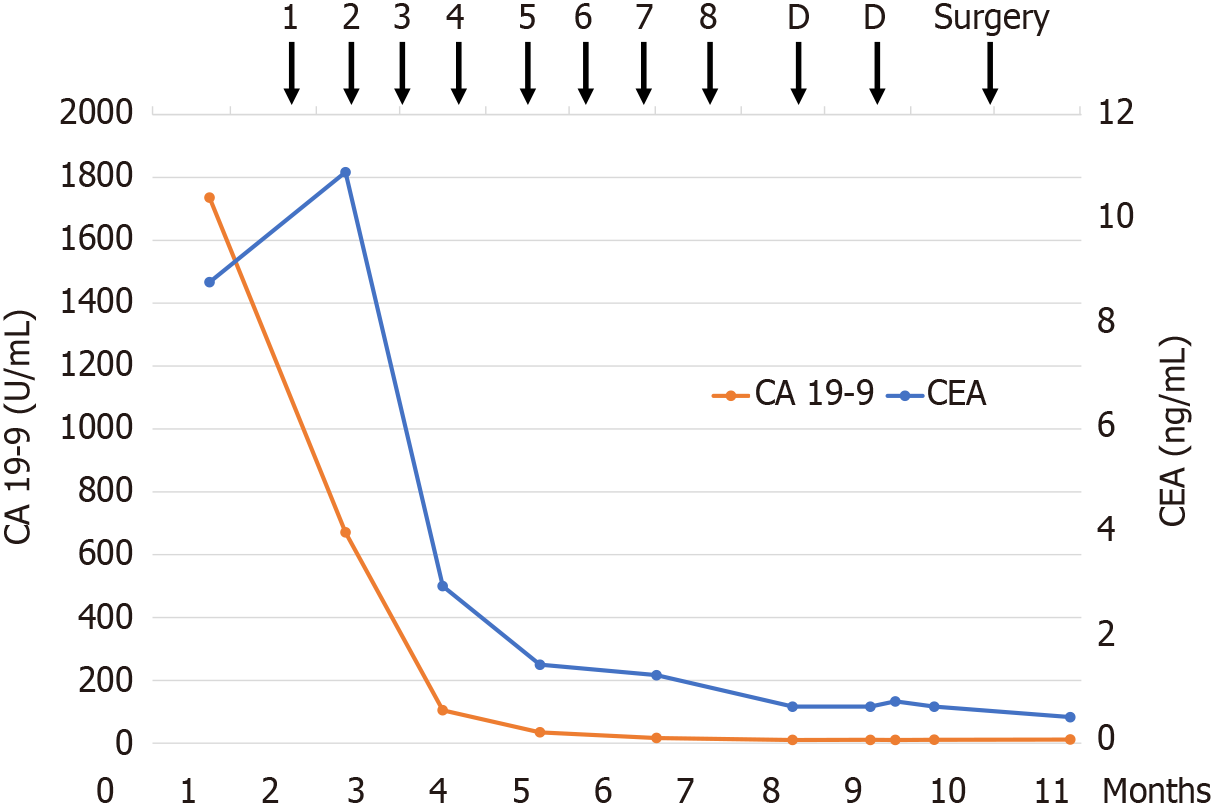
Figure 2 Changes in carcinoembryonic antigen and carbohydrate antigen 19-9 tumor marker levels and timeline of the gemcitabine and cisplatin plus durvalumab regimen.
Numbers 1–8 indicate the treatment cycle. “D” indicates durvalumab maintenance therapy. CA 19-9: Carbohydrate antigen 19-9; CEA: Carcinoembryonic antigen.
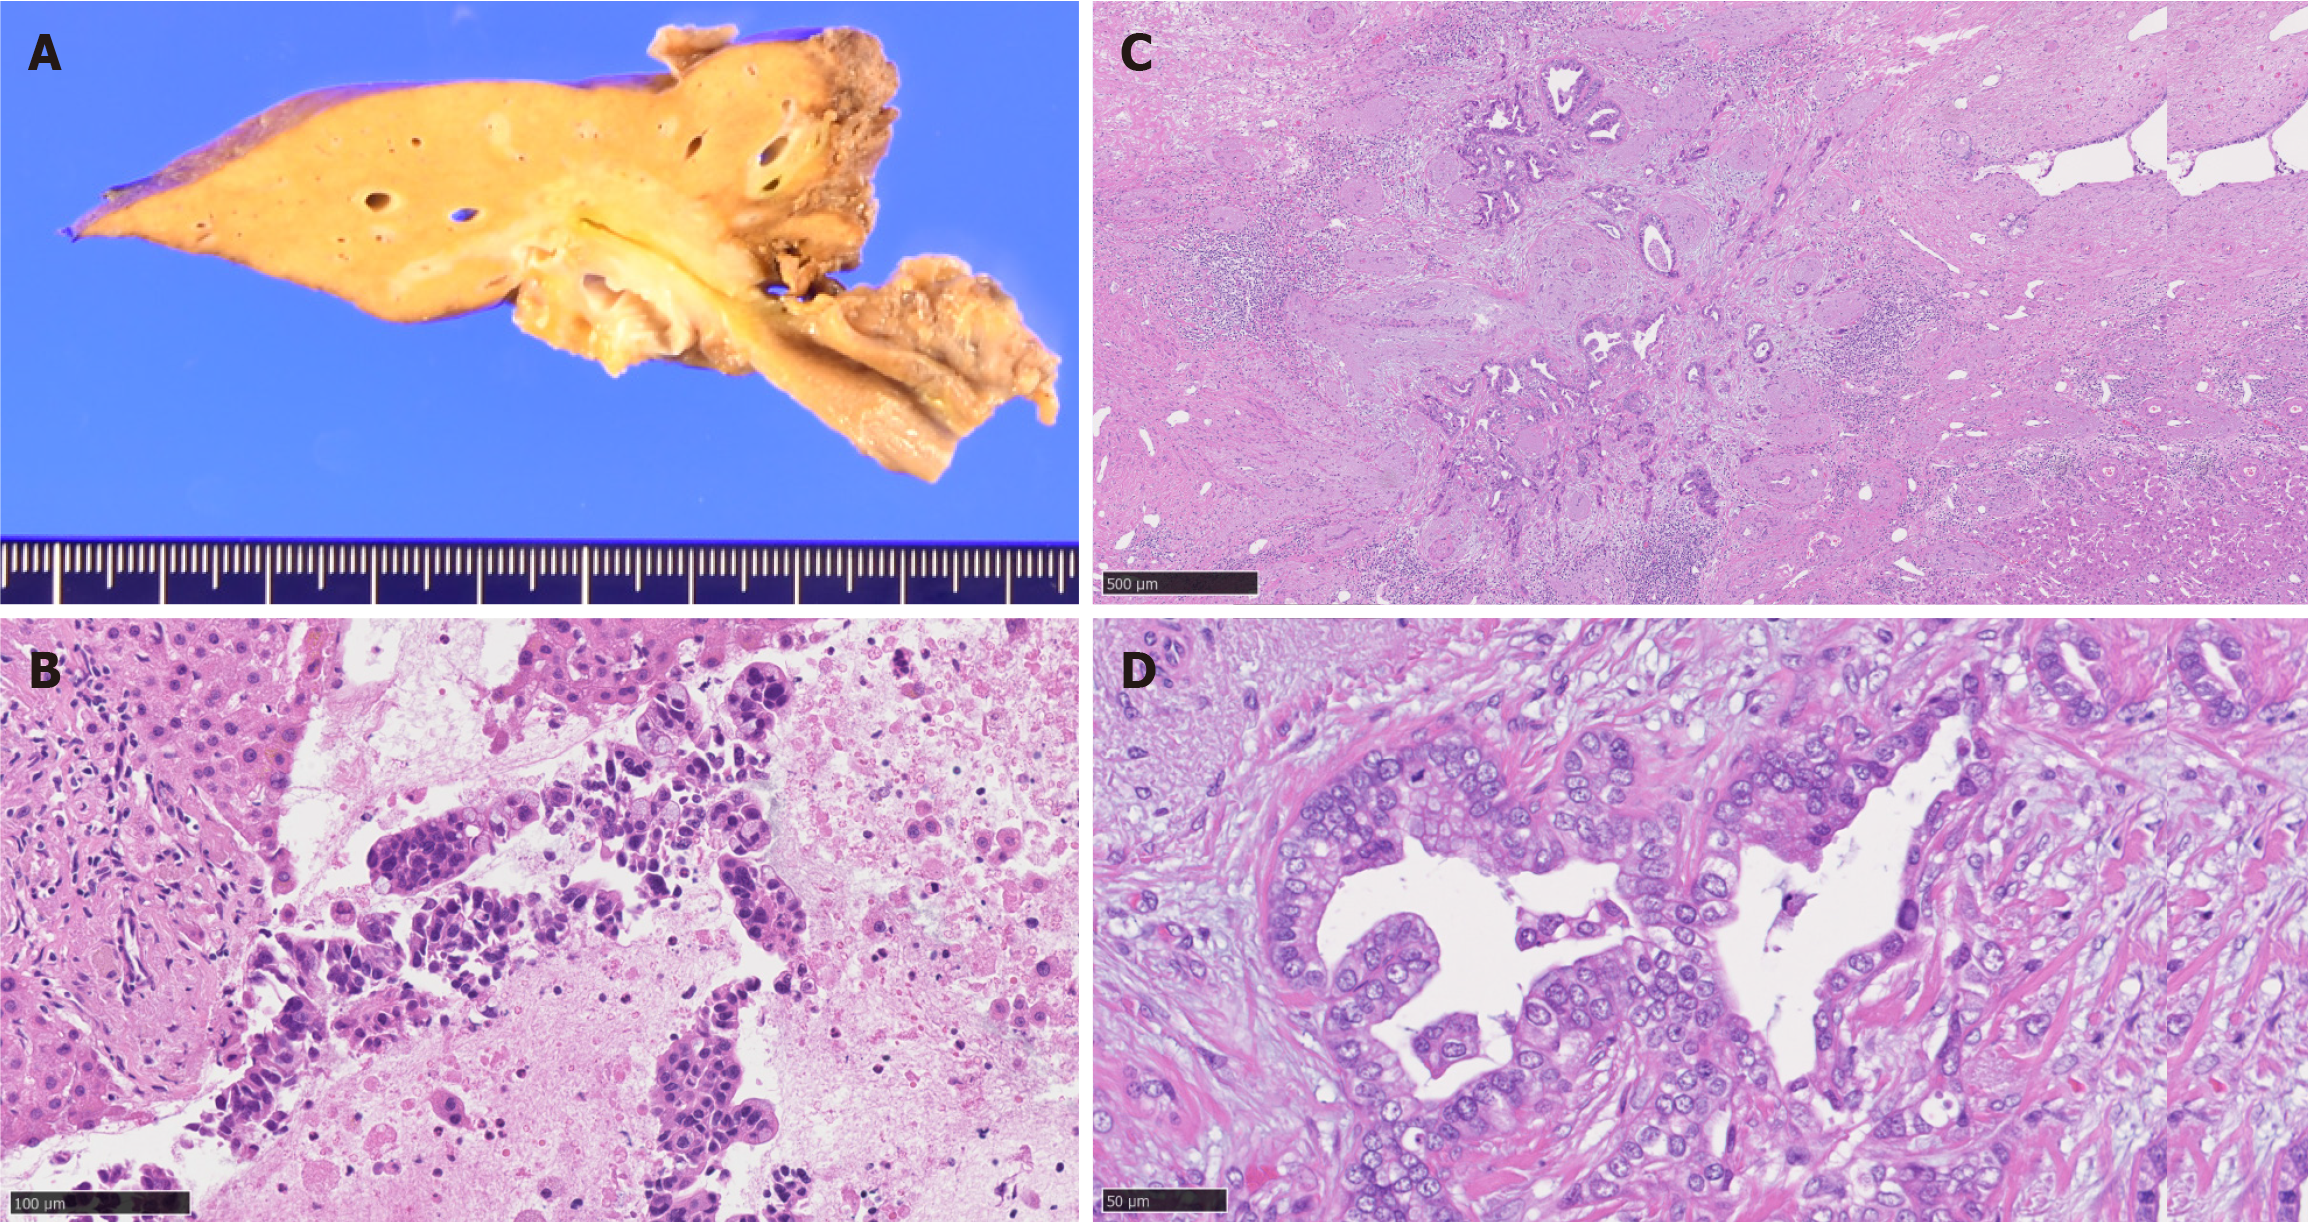
Figure 3 Resection margins.
A: Macroscopic findings of mass-forming and periductal-infiltrating intrahepatic cholangiocarcinoma; B: Hematoxylin and eosin (HE) staining of the preoperative biopsy specimen confirming the adenocarcinoma diagnosis; C and D: HE staining of the resected tumor. Small ductular-like structures lined by small nonmucinous cuboidal cells, characteristic findings in small duct type intrahepatic cholangiocarcinomas.
- Citation: Igata Y, Kudo M, Kojima M, Kami S, Aoki K, Satake T, Kobayashi T, Sugimoto M, Kobayashi S, Konishi M, Gotohda N. Conversion surgery after gemcitabine and cisplatin plus durvalumab for advanced intrahepatic cholangiocarcinoma: A case report. World J Clin Cases 2024; 12(34): 6721-6727
- URL: https://www.wjgnet.com/2307-8960/full/v12/i34/6721.htm
- DOI: https://dx.doi.org/10.12998/wjcc.v12.i34.6721


