Copyright
©The Author(s) 2024.
World J Clin Cases. Oct 26, 2024; 12(30): 6391-6406
Published online Oct 26, 2024. doi: 10.12998/wjcc.v12.i30.6391
Published online Oct 26, 2024. doi: 10.12998/wjcc.v12.i30.6391
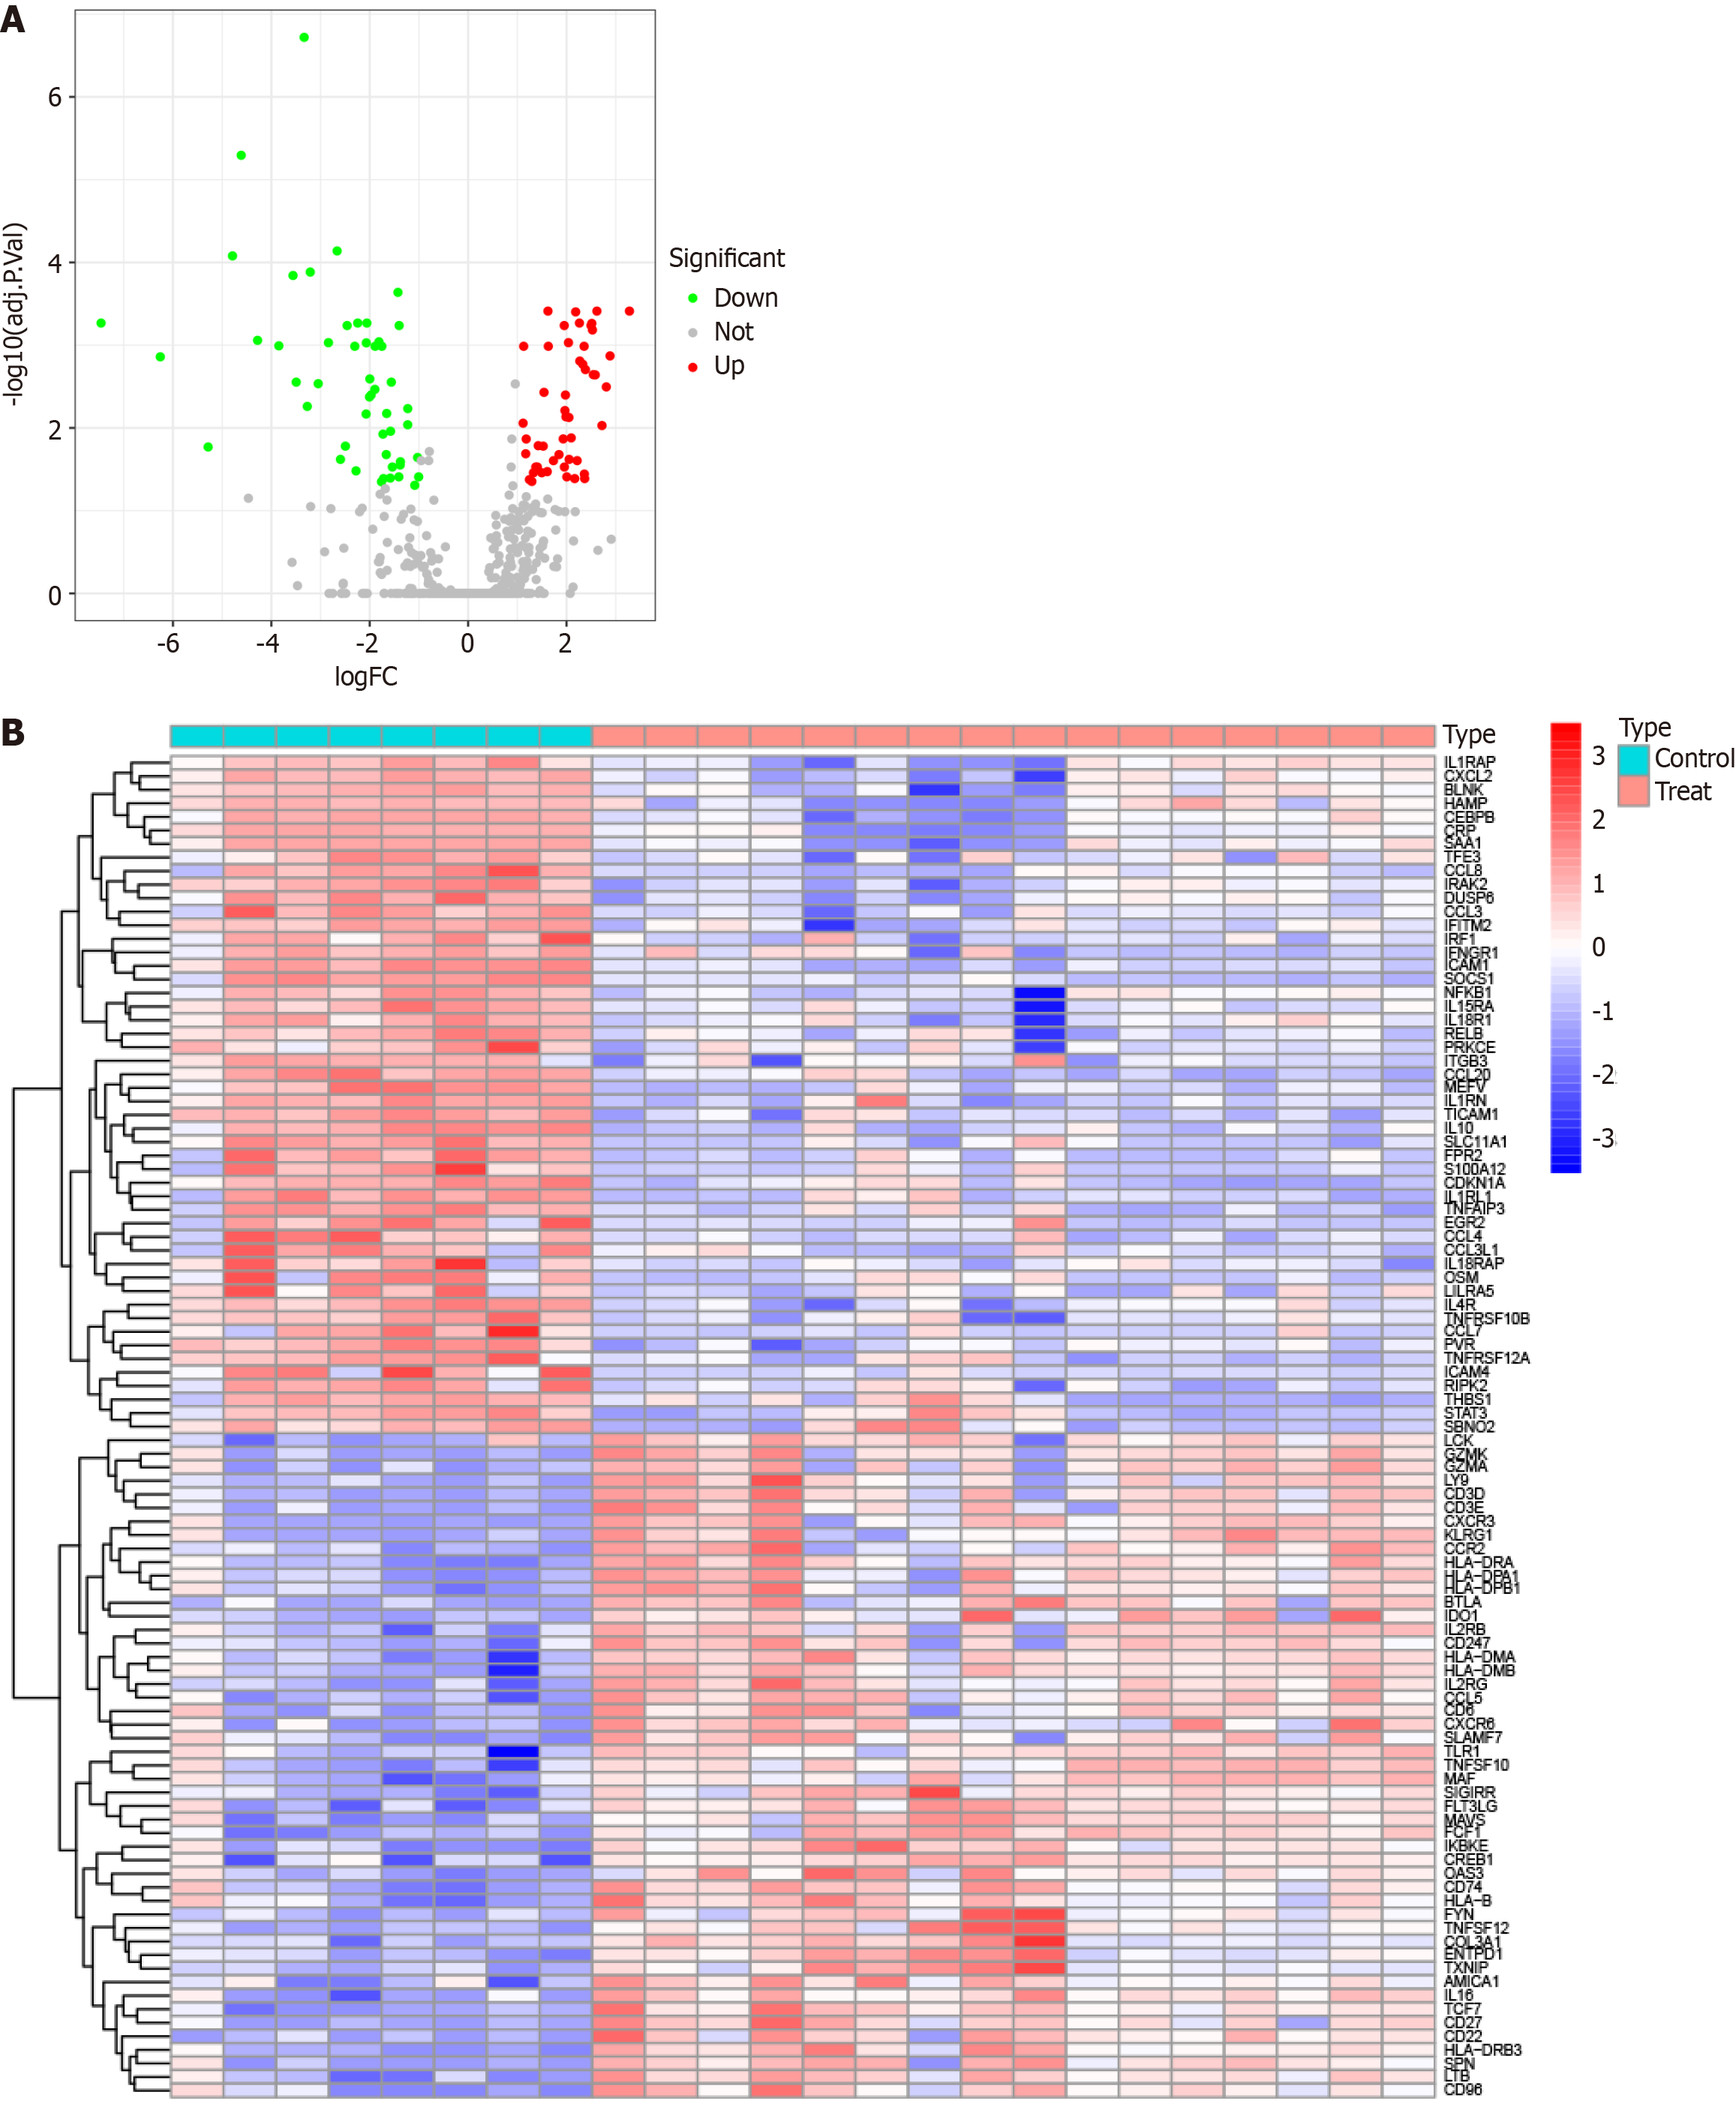
Figure 1 Differentially expressed genes between the primary biliary cholangitis and healthy control groups in the GSE79850 dataset.
A: A volcano plot was generated to visualize the differential expression analysis results. Genes that were significantly upregulated in primary biliary cholangitis are depicted in red, genes that were significantly down-regulated are depicted in green, and genes that did not show significant differential expression are depicted in black; B: A heatmap was constructed to illustrate differential expression patterns for genes in the GSE79850 dataset. PBC: Primary biliary cholangitis; DEGs: Differentially expressed genes; GO: Gene ontology; KEGG: Kyoto encyclopedia of genes and genomes.
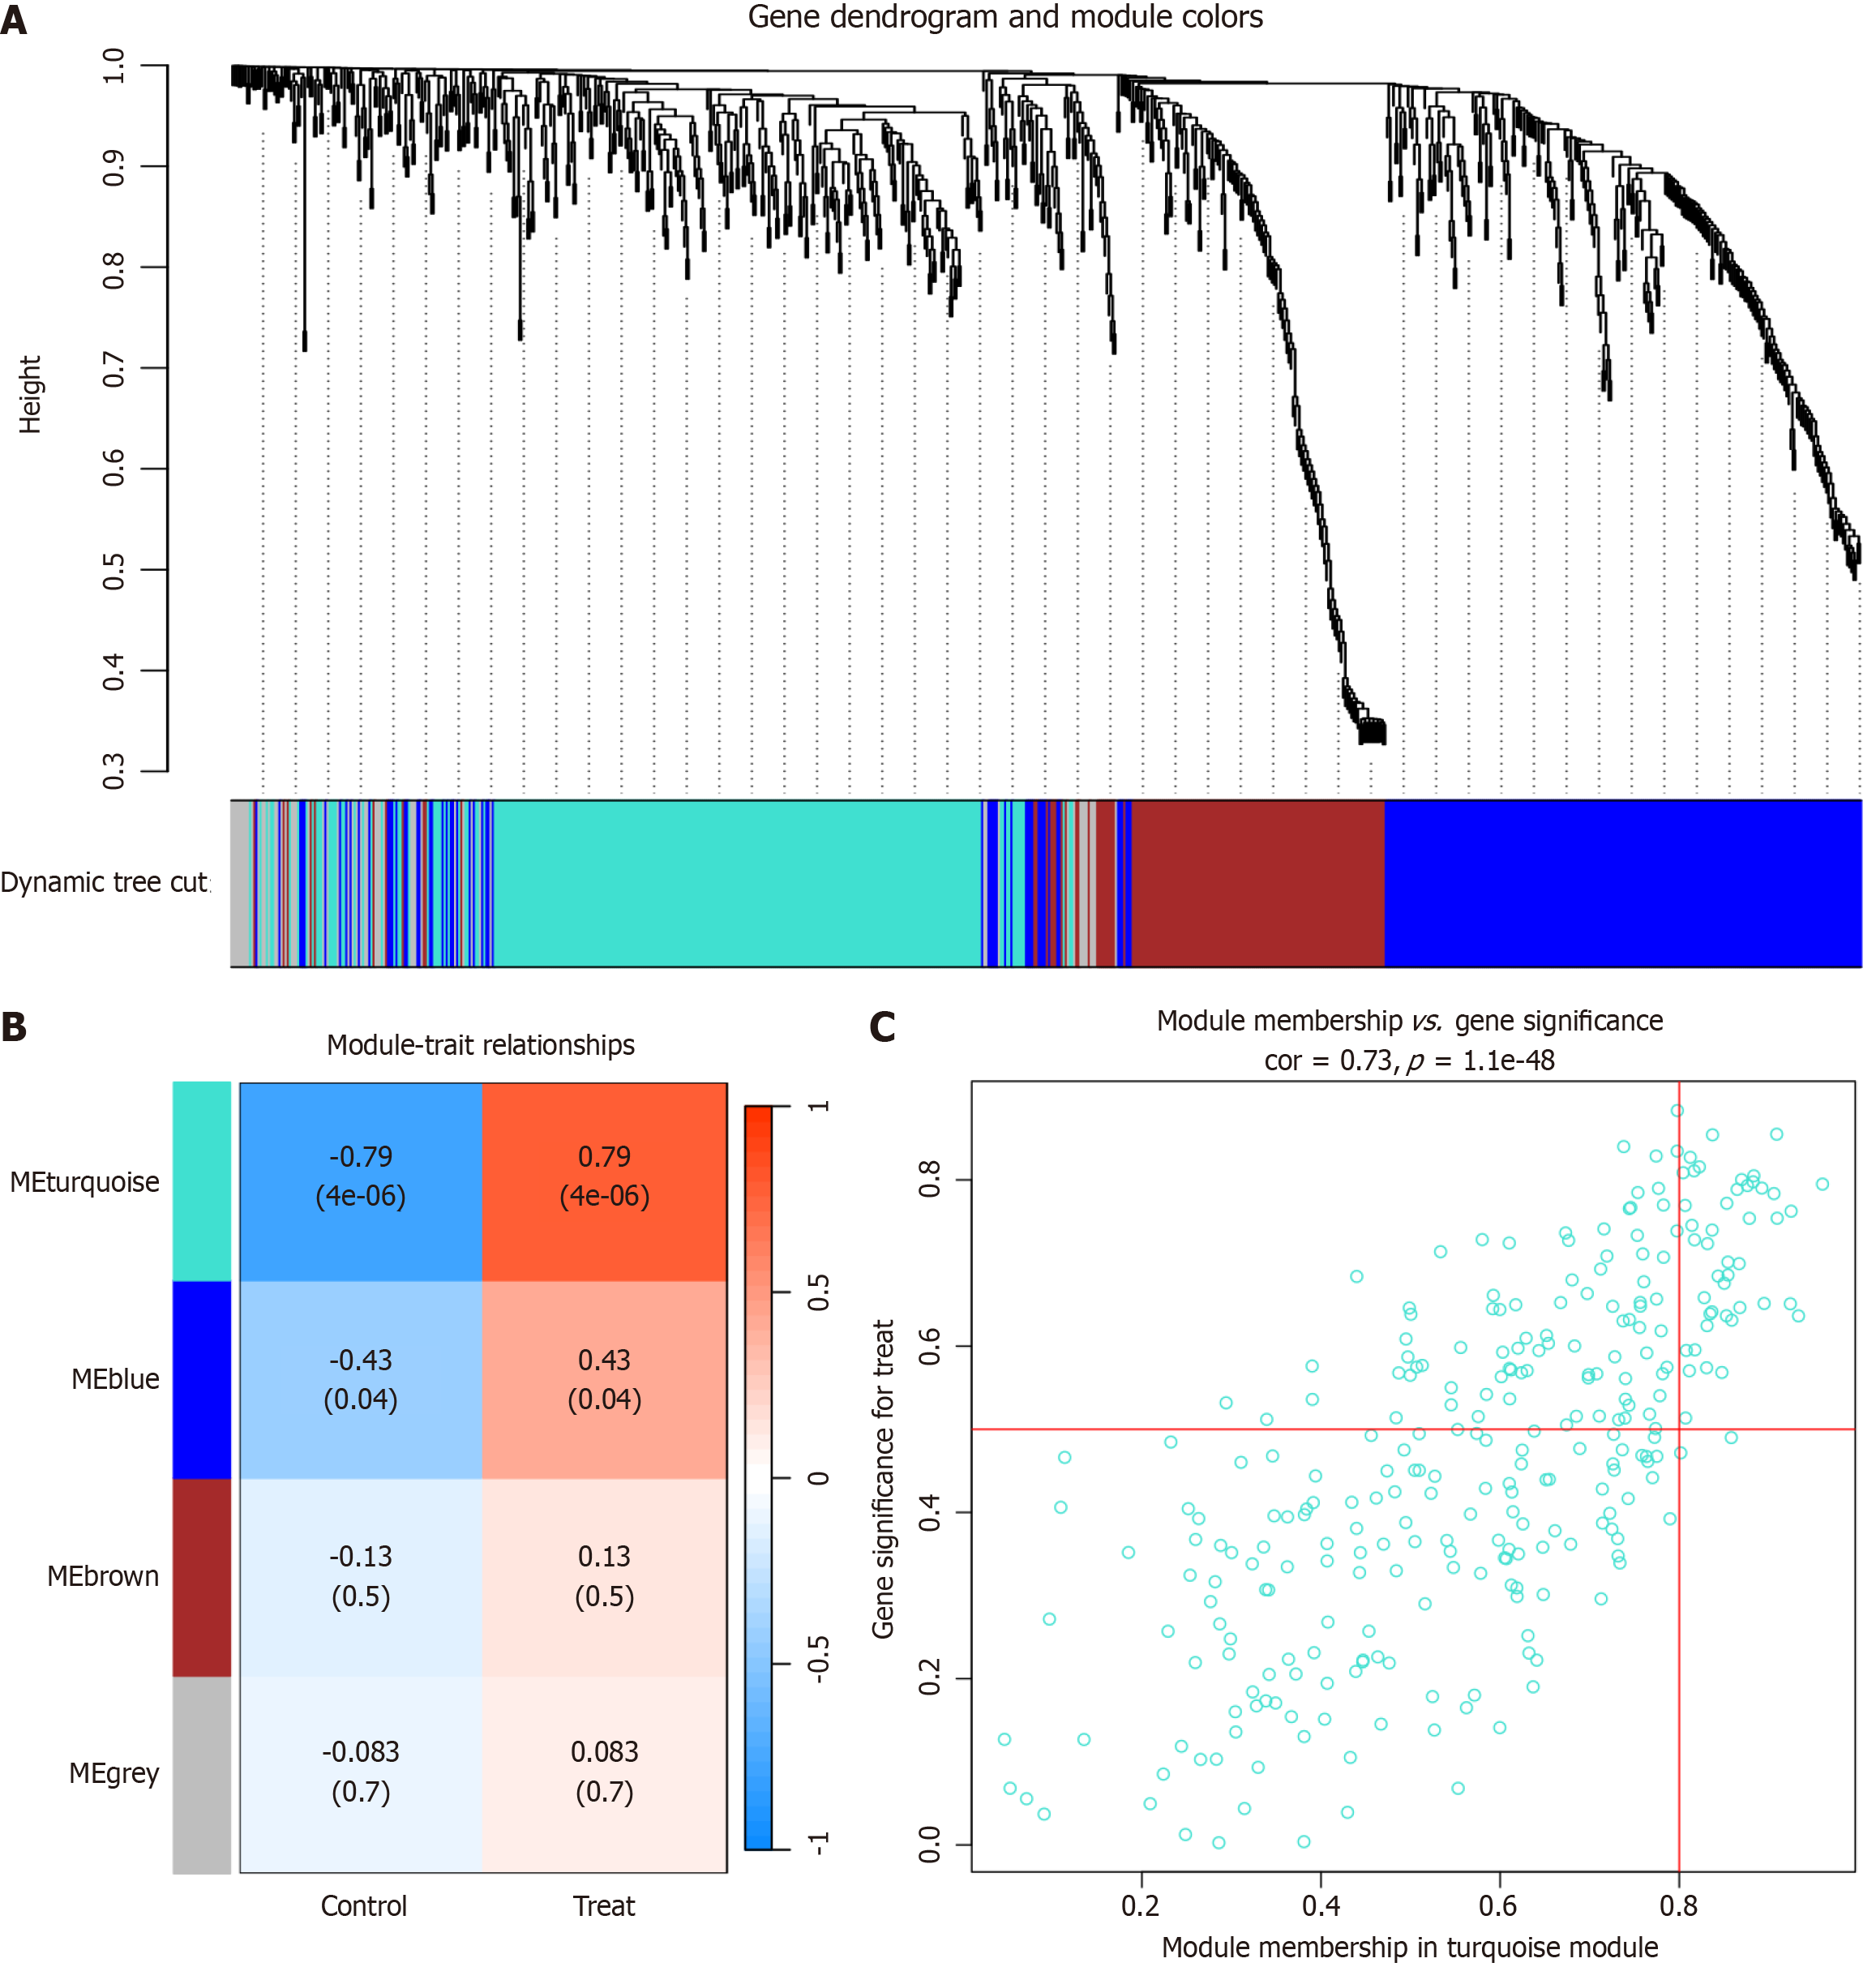
Figure 2 Identification of primary biliary cholangitis-associated gene modules in the Gene Expression Omnibus dataset using weighted gene co-expression network analysis.
A: A dendrogram was generated by clustering genes in the GSE79850 dataset using a topological overlap matrix (1-TOM). Each branch represents a gene, with co-expression modules visualized in different colors; B: A module-trait heatmap displayed the correlation between gene modules and primary biliary cholangitis (PBC) in the GSE79850 dataset. Each module is associated with a correlation coefficient and p-value, indicating the strength and significance of the correlation; C: A scatter plot illustrated the correlation between the turquoise module and PBC in the GSE79850 dataset. The turquoise module exhibits the strongest positive correlation with PBC.
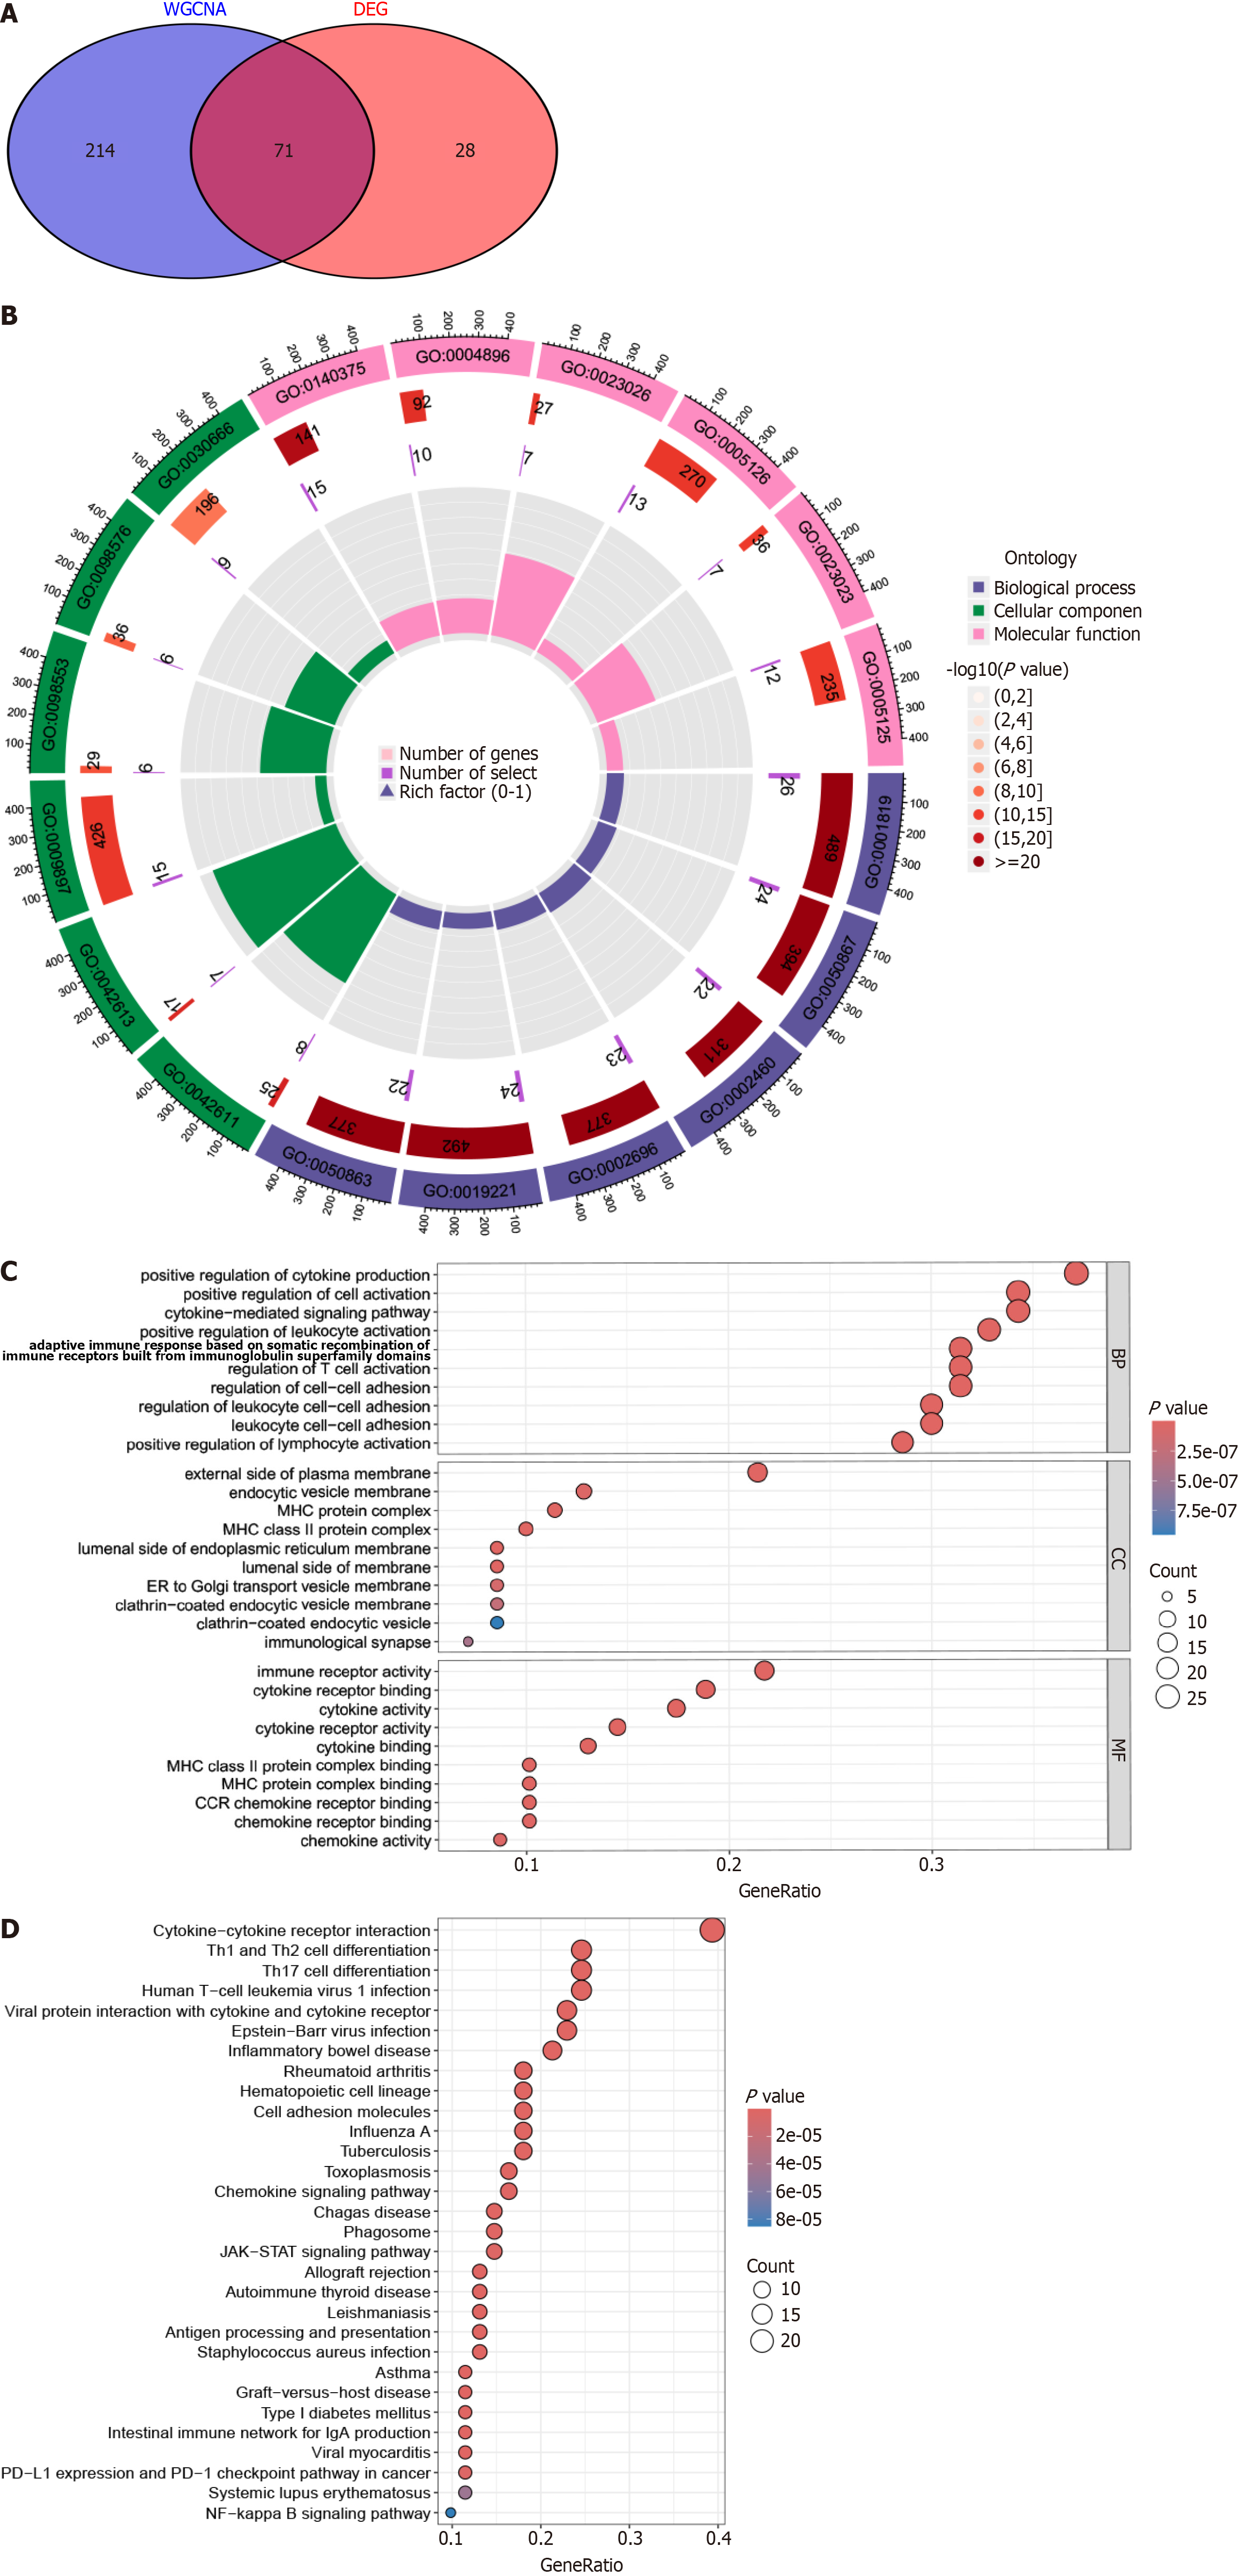
Figure 3 Identification and validation of primary biliary cholangitis-associated candidate hub genes in the GSE79850 dataset.
A: A Venn diagram was utilized to illustrate the overlap of 115 candidate hub genes; B: GO enrichment analysis of candidate hub genes revealed the functional categories and biological processes associated with primary biliary cholangitis (PBC); C: Kyoto Encyclopedia of Genes and Genomes pathway analysis highlighted the molecular pathways involved in PBC. GO: Gene Ontology; DEG: Differentially expressed gene; WGCNA: Weighted gene co-expression network analysis.
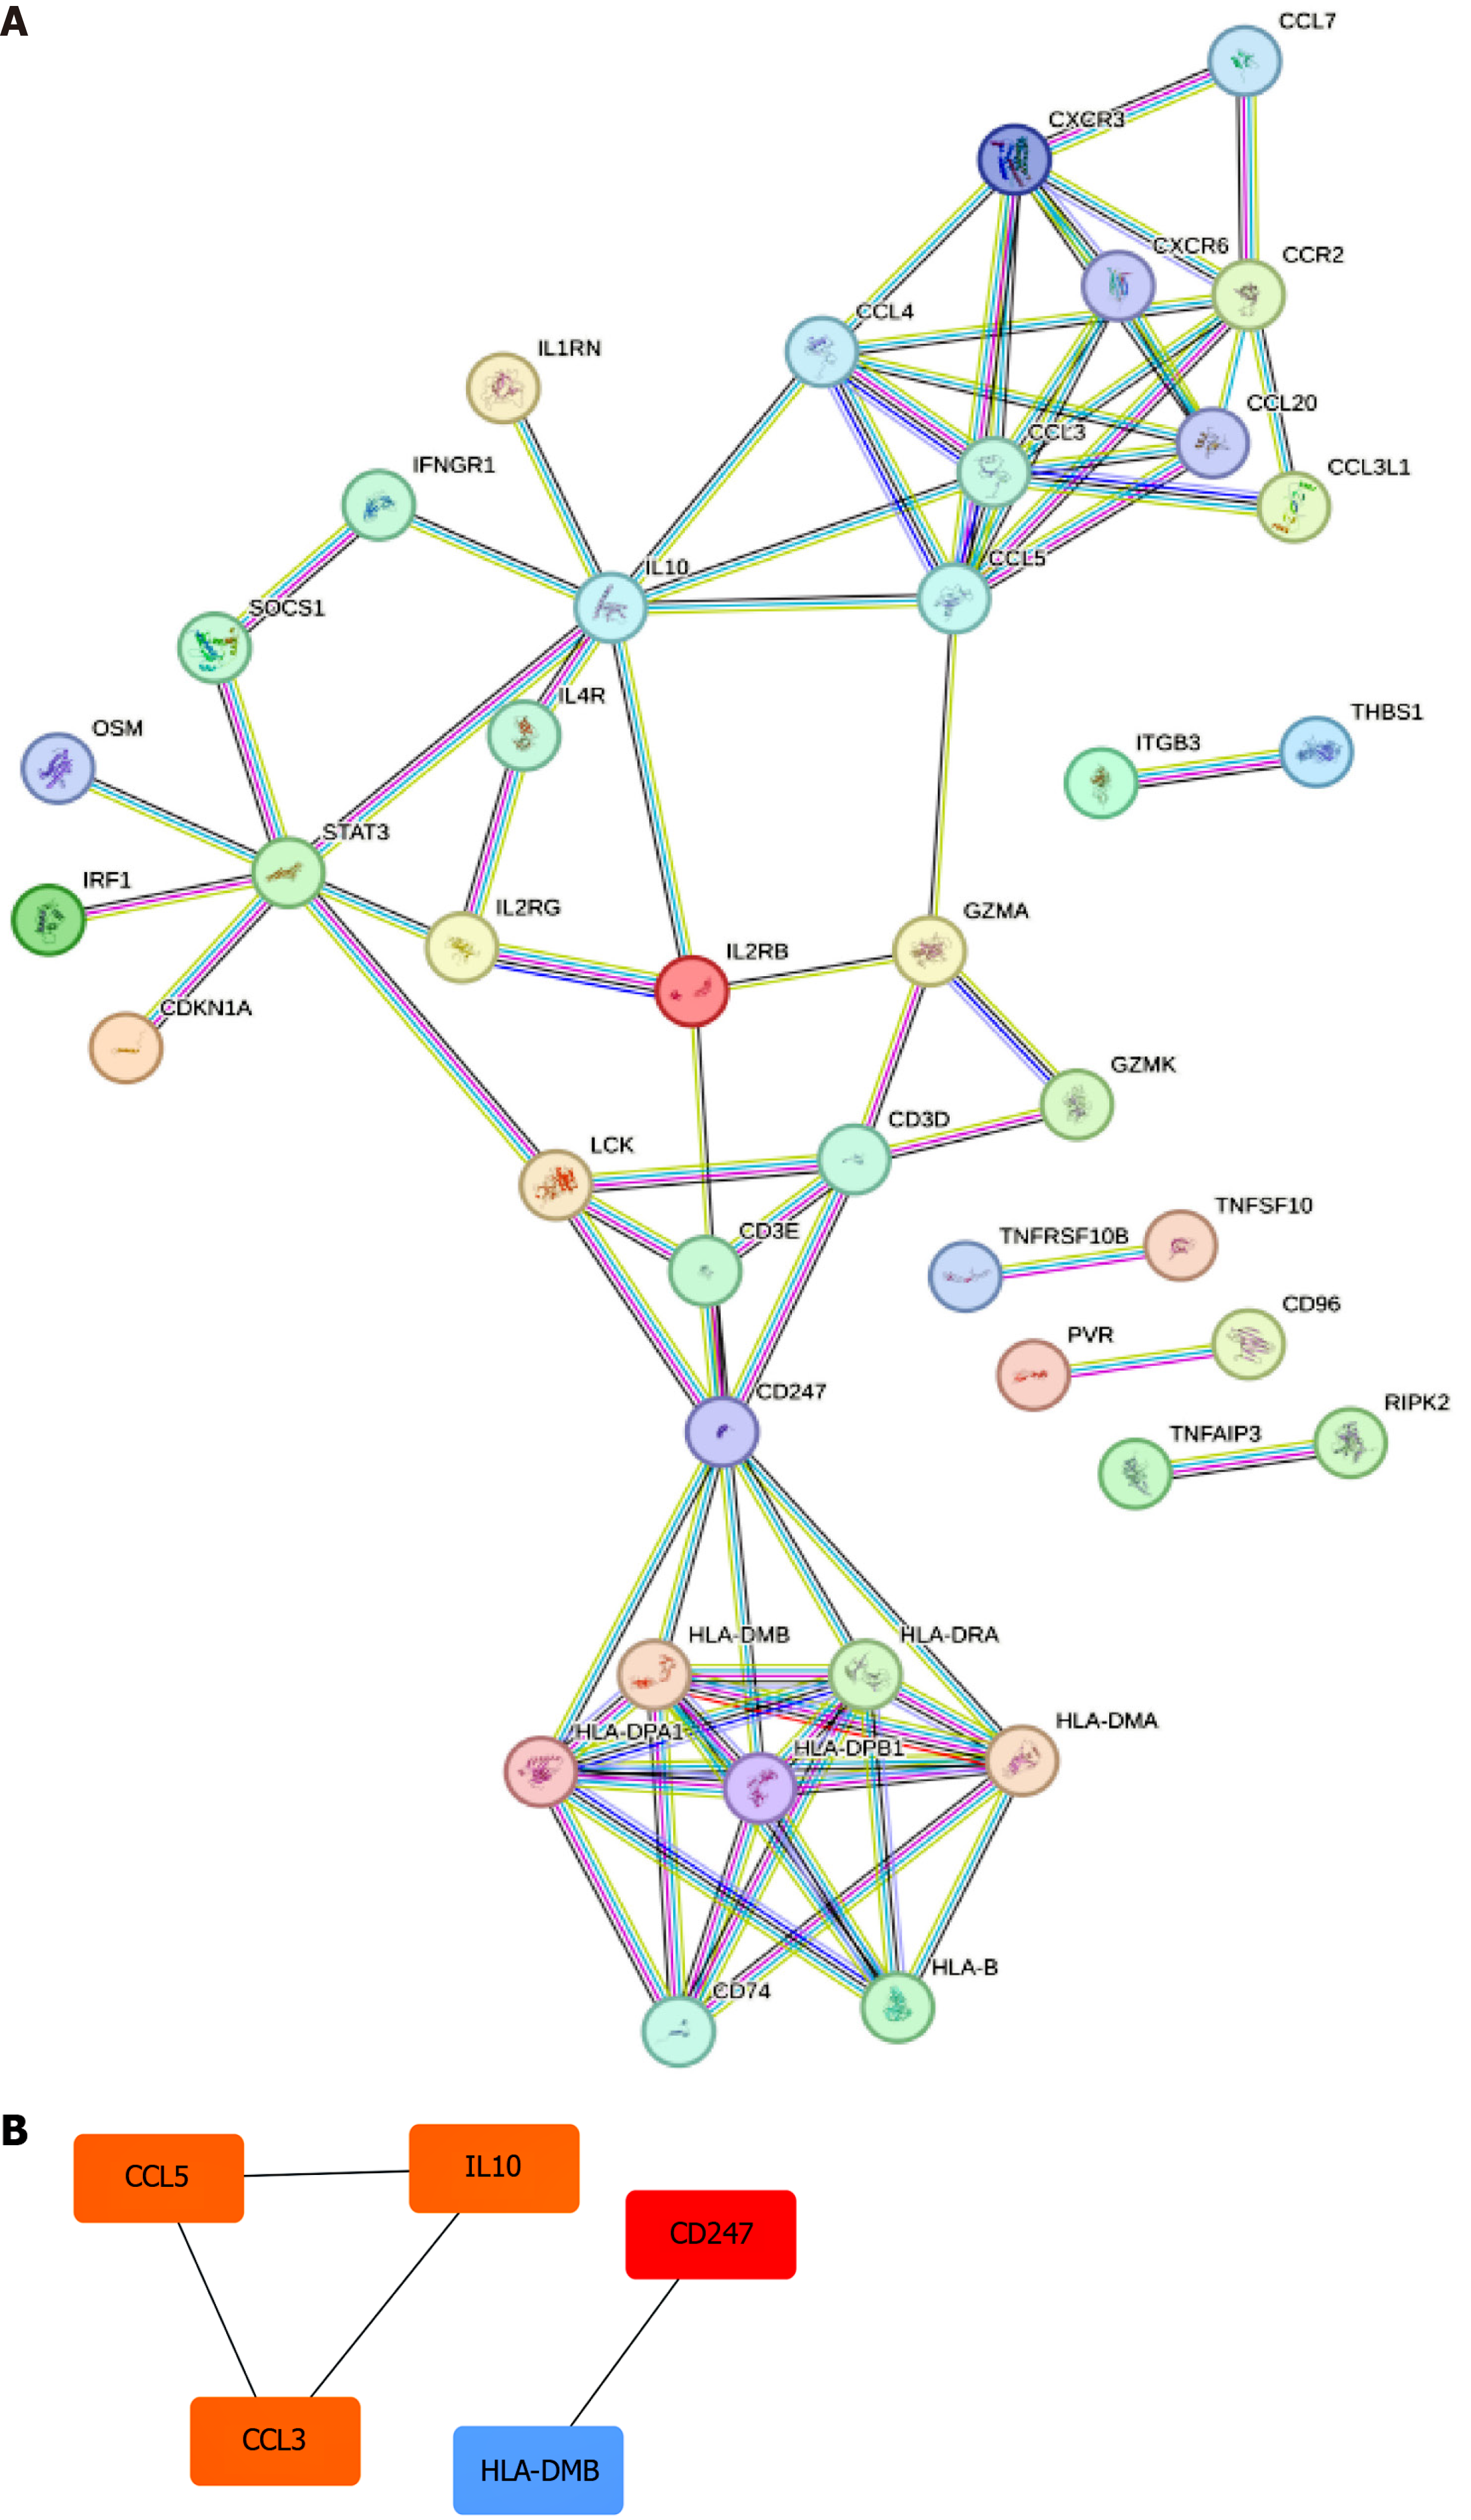
Figure 4 Protein-protein interaction network construction.
A: A protein-protein interaction (PPI) network was constructed using the identified overlapping candidate hub genes; B: Hub genes in the PPI network were determined using the degree SS algorithm.
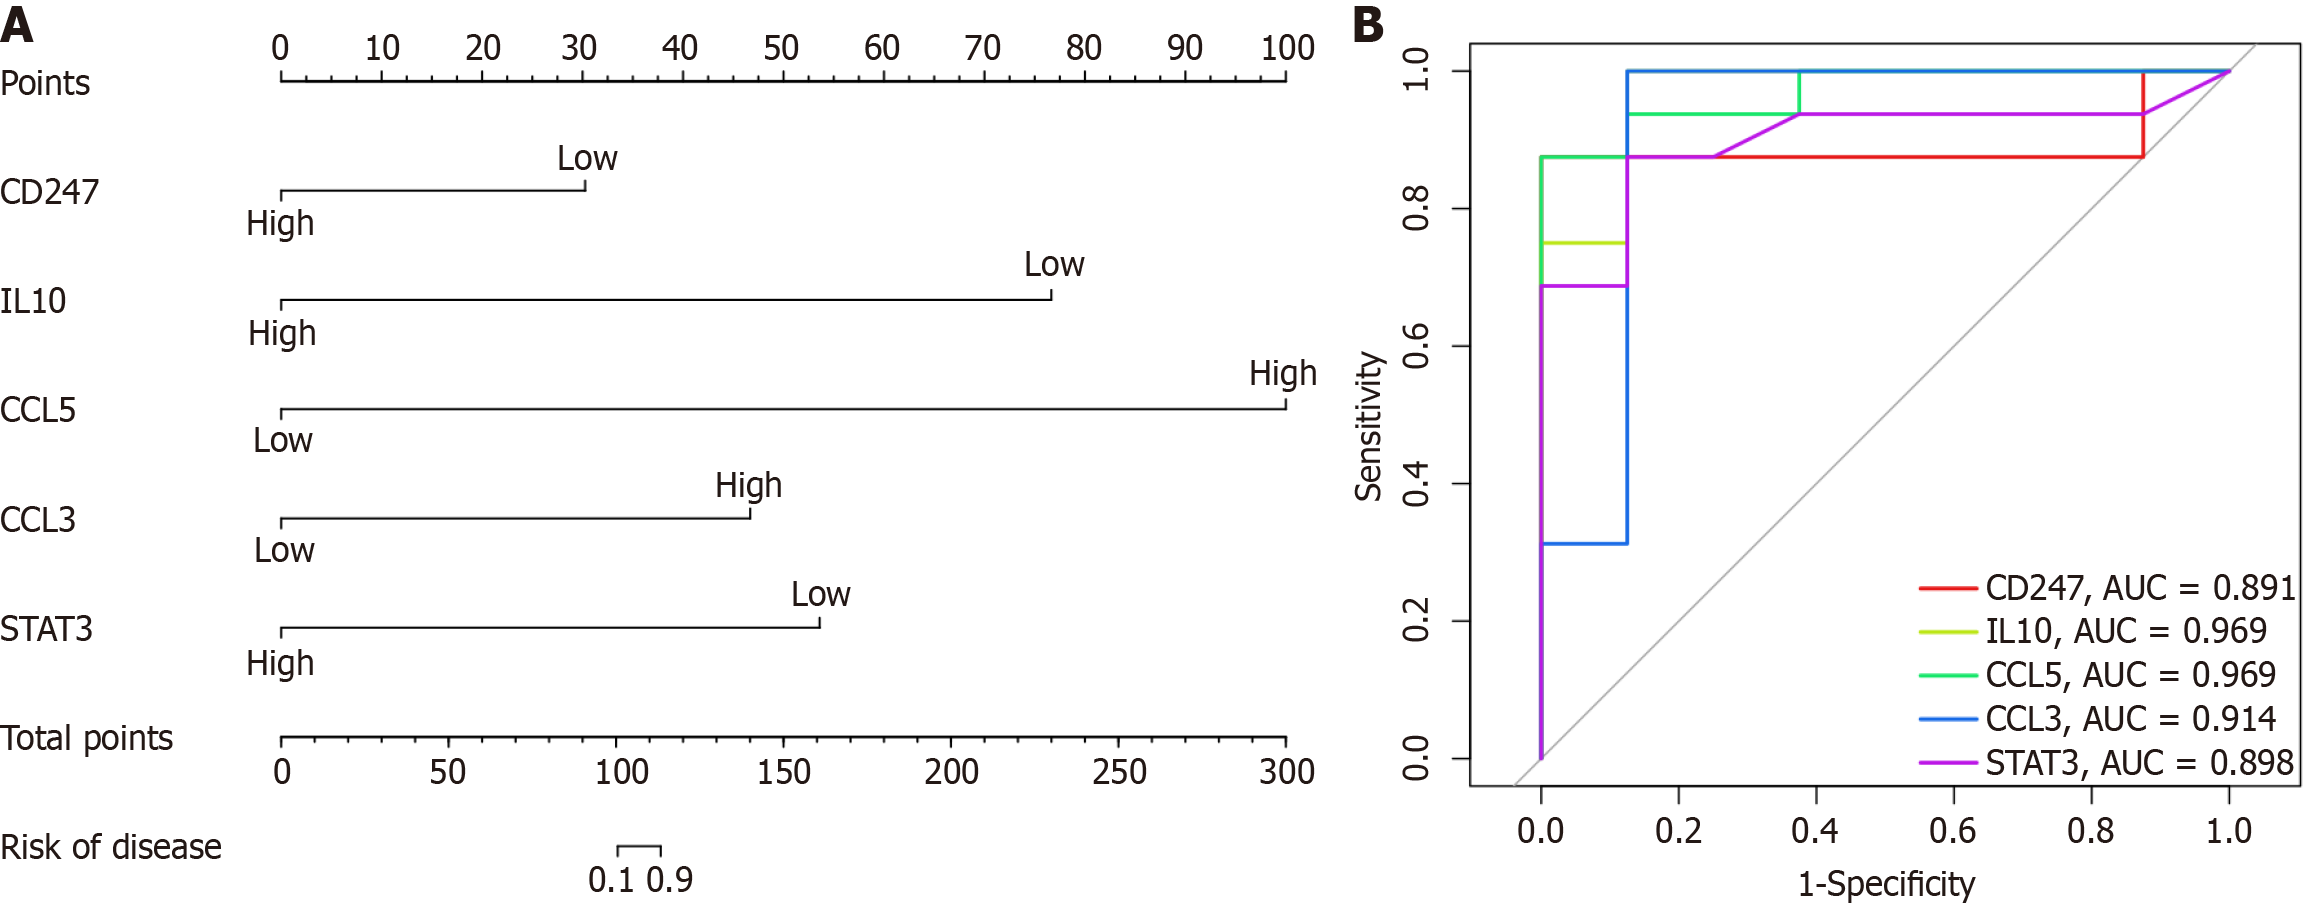
Figure 5 Prediction of primary biliary cholangitis risk using a nomogram.
A: A nomogram model incorporating hub genes was developed to predict the primary biliary cholangitis risk; B: Receiver operating characteristic curve curves were used to evaluate the diagnostic performance of each hub gene. AUC: Area under the receiver operating characteristic curve.
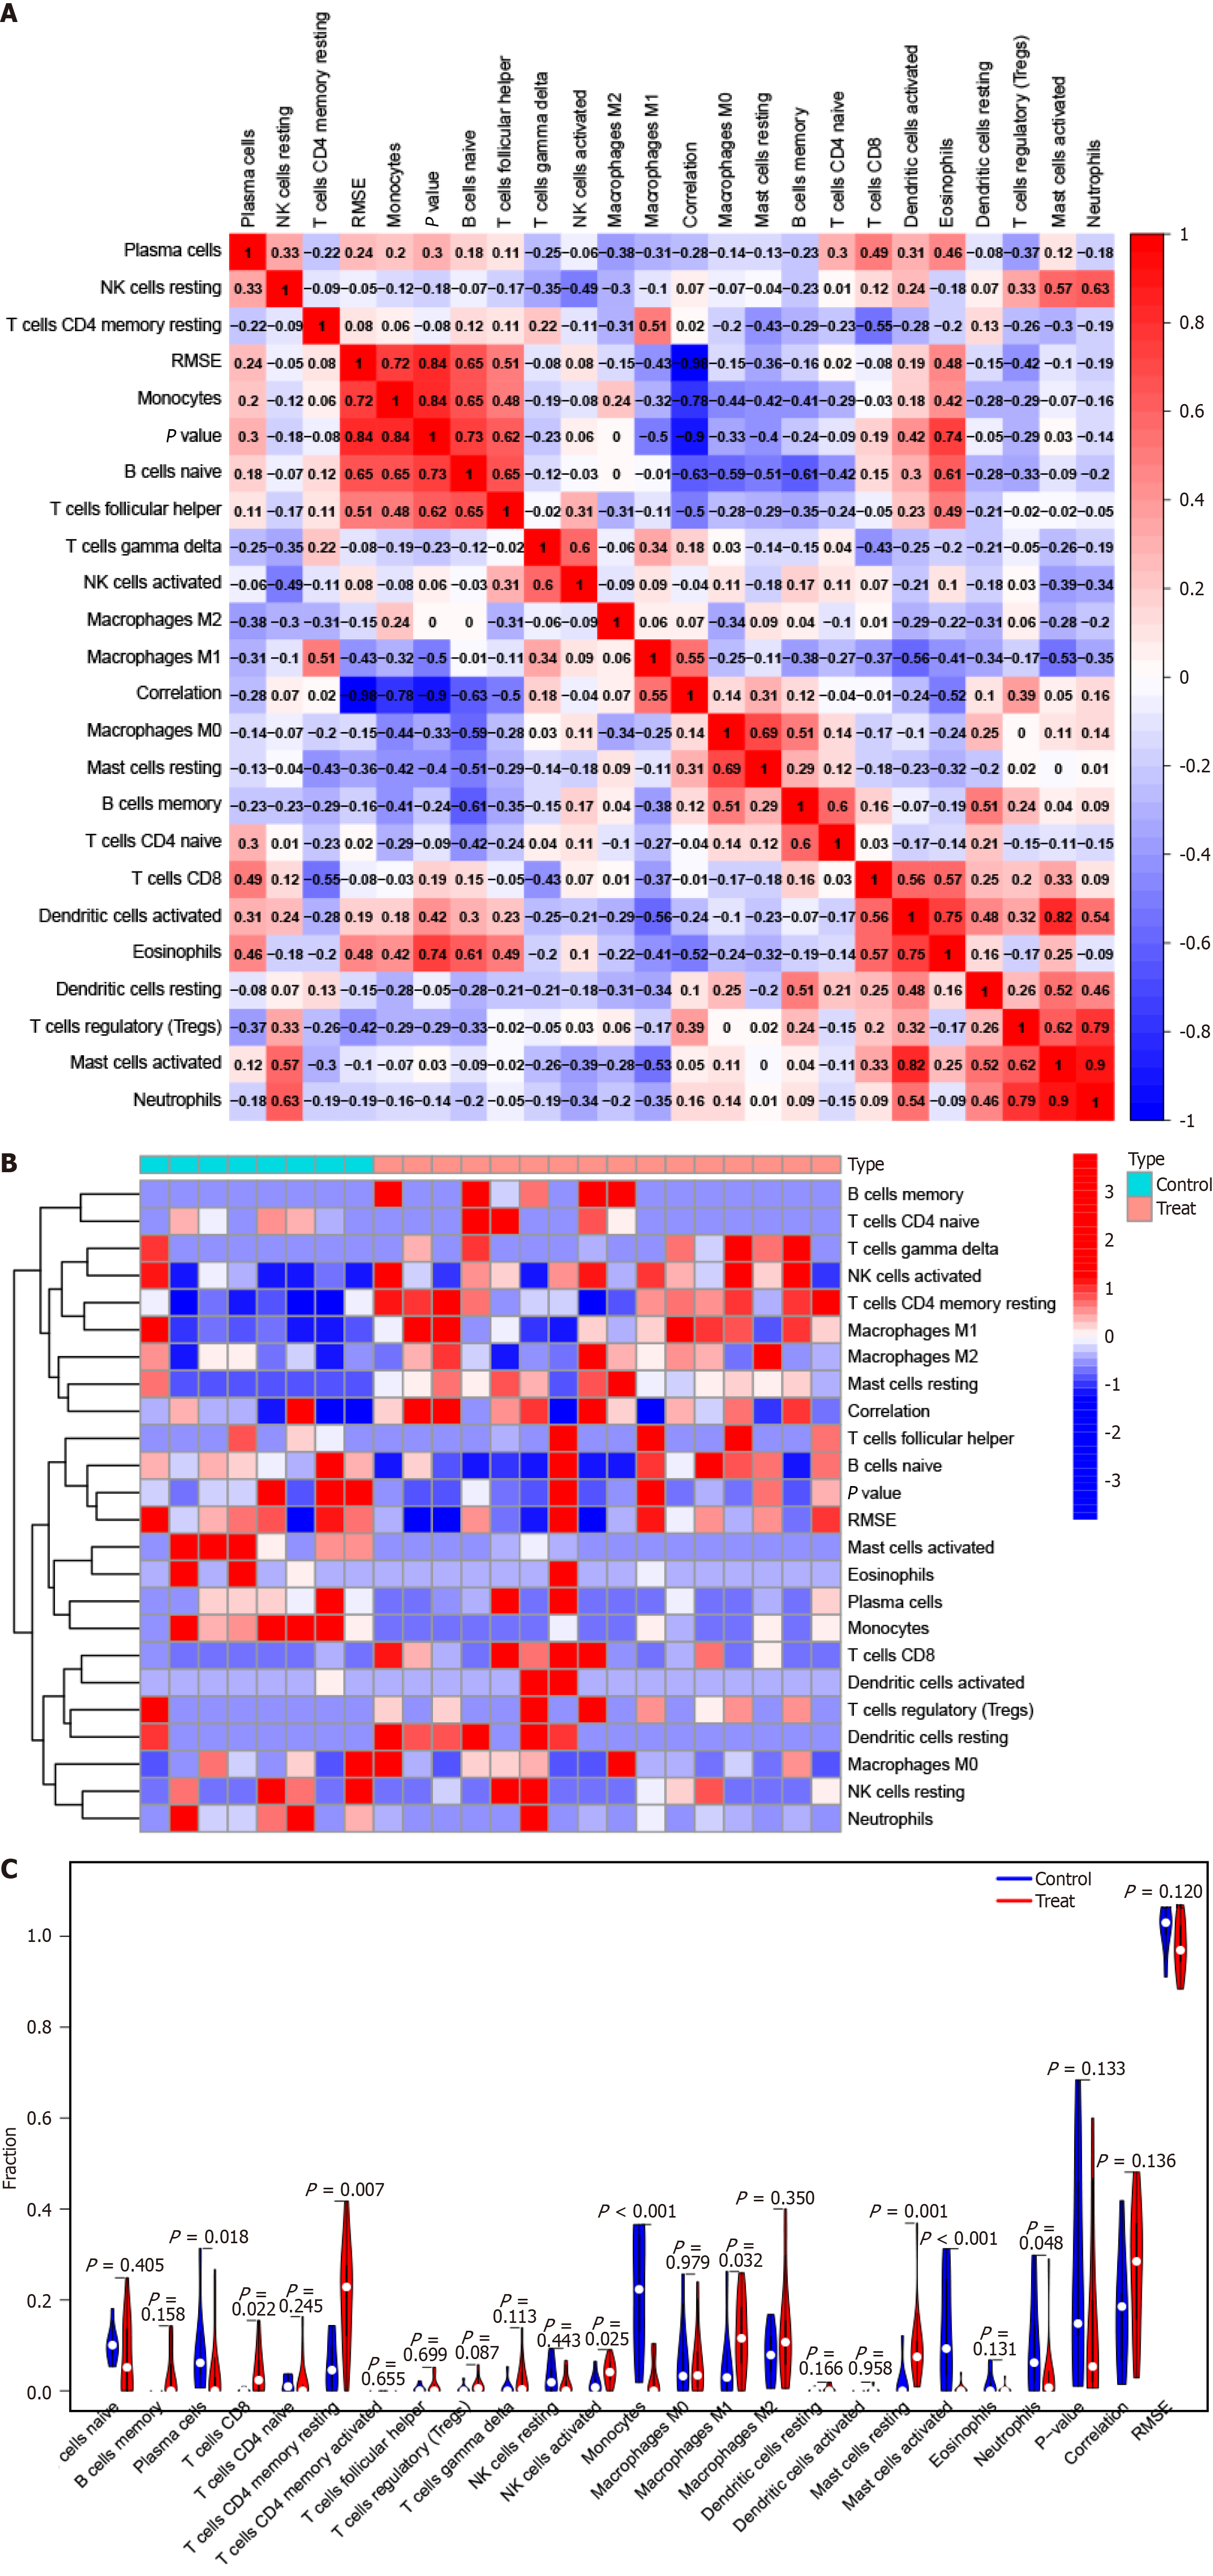
Figure 6 Immune cell infiltration in primary biliary cholangitis.
A: Heat map showing the relationship between 22 different types of infiltrating immune cells; B: Heat map displaying variations among 22 types of infiltrating immune cells between primary biliary cholangitis (PBC) specimens and healthy samples; C: Violin plot displaying variations among 22 types of infiltrating immune cells between PBC specimens and healthy samples.
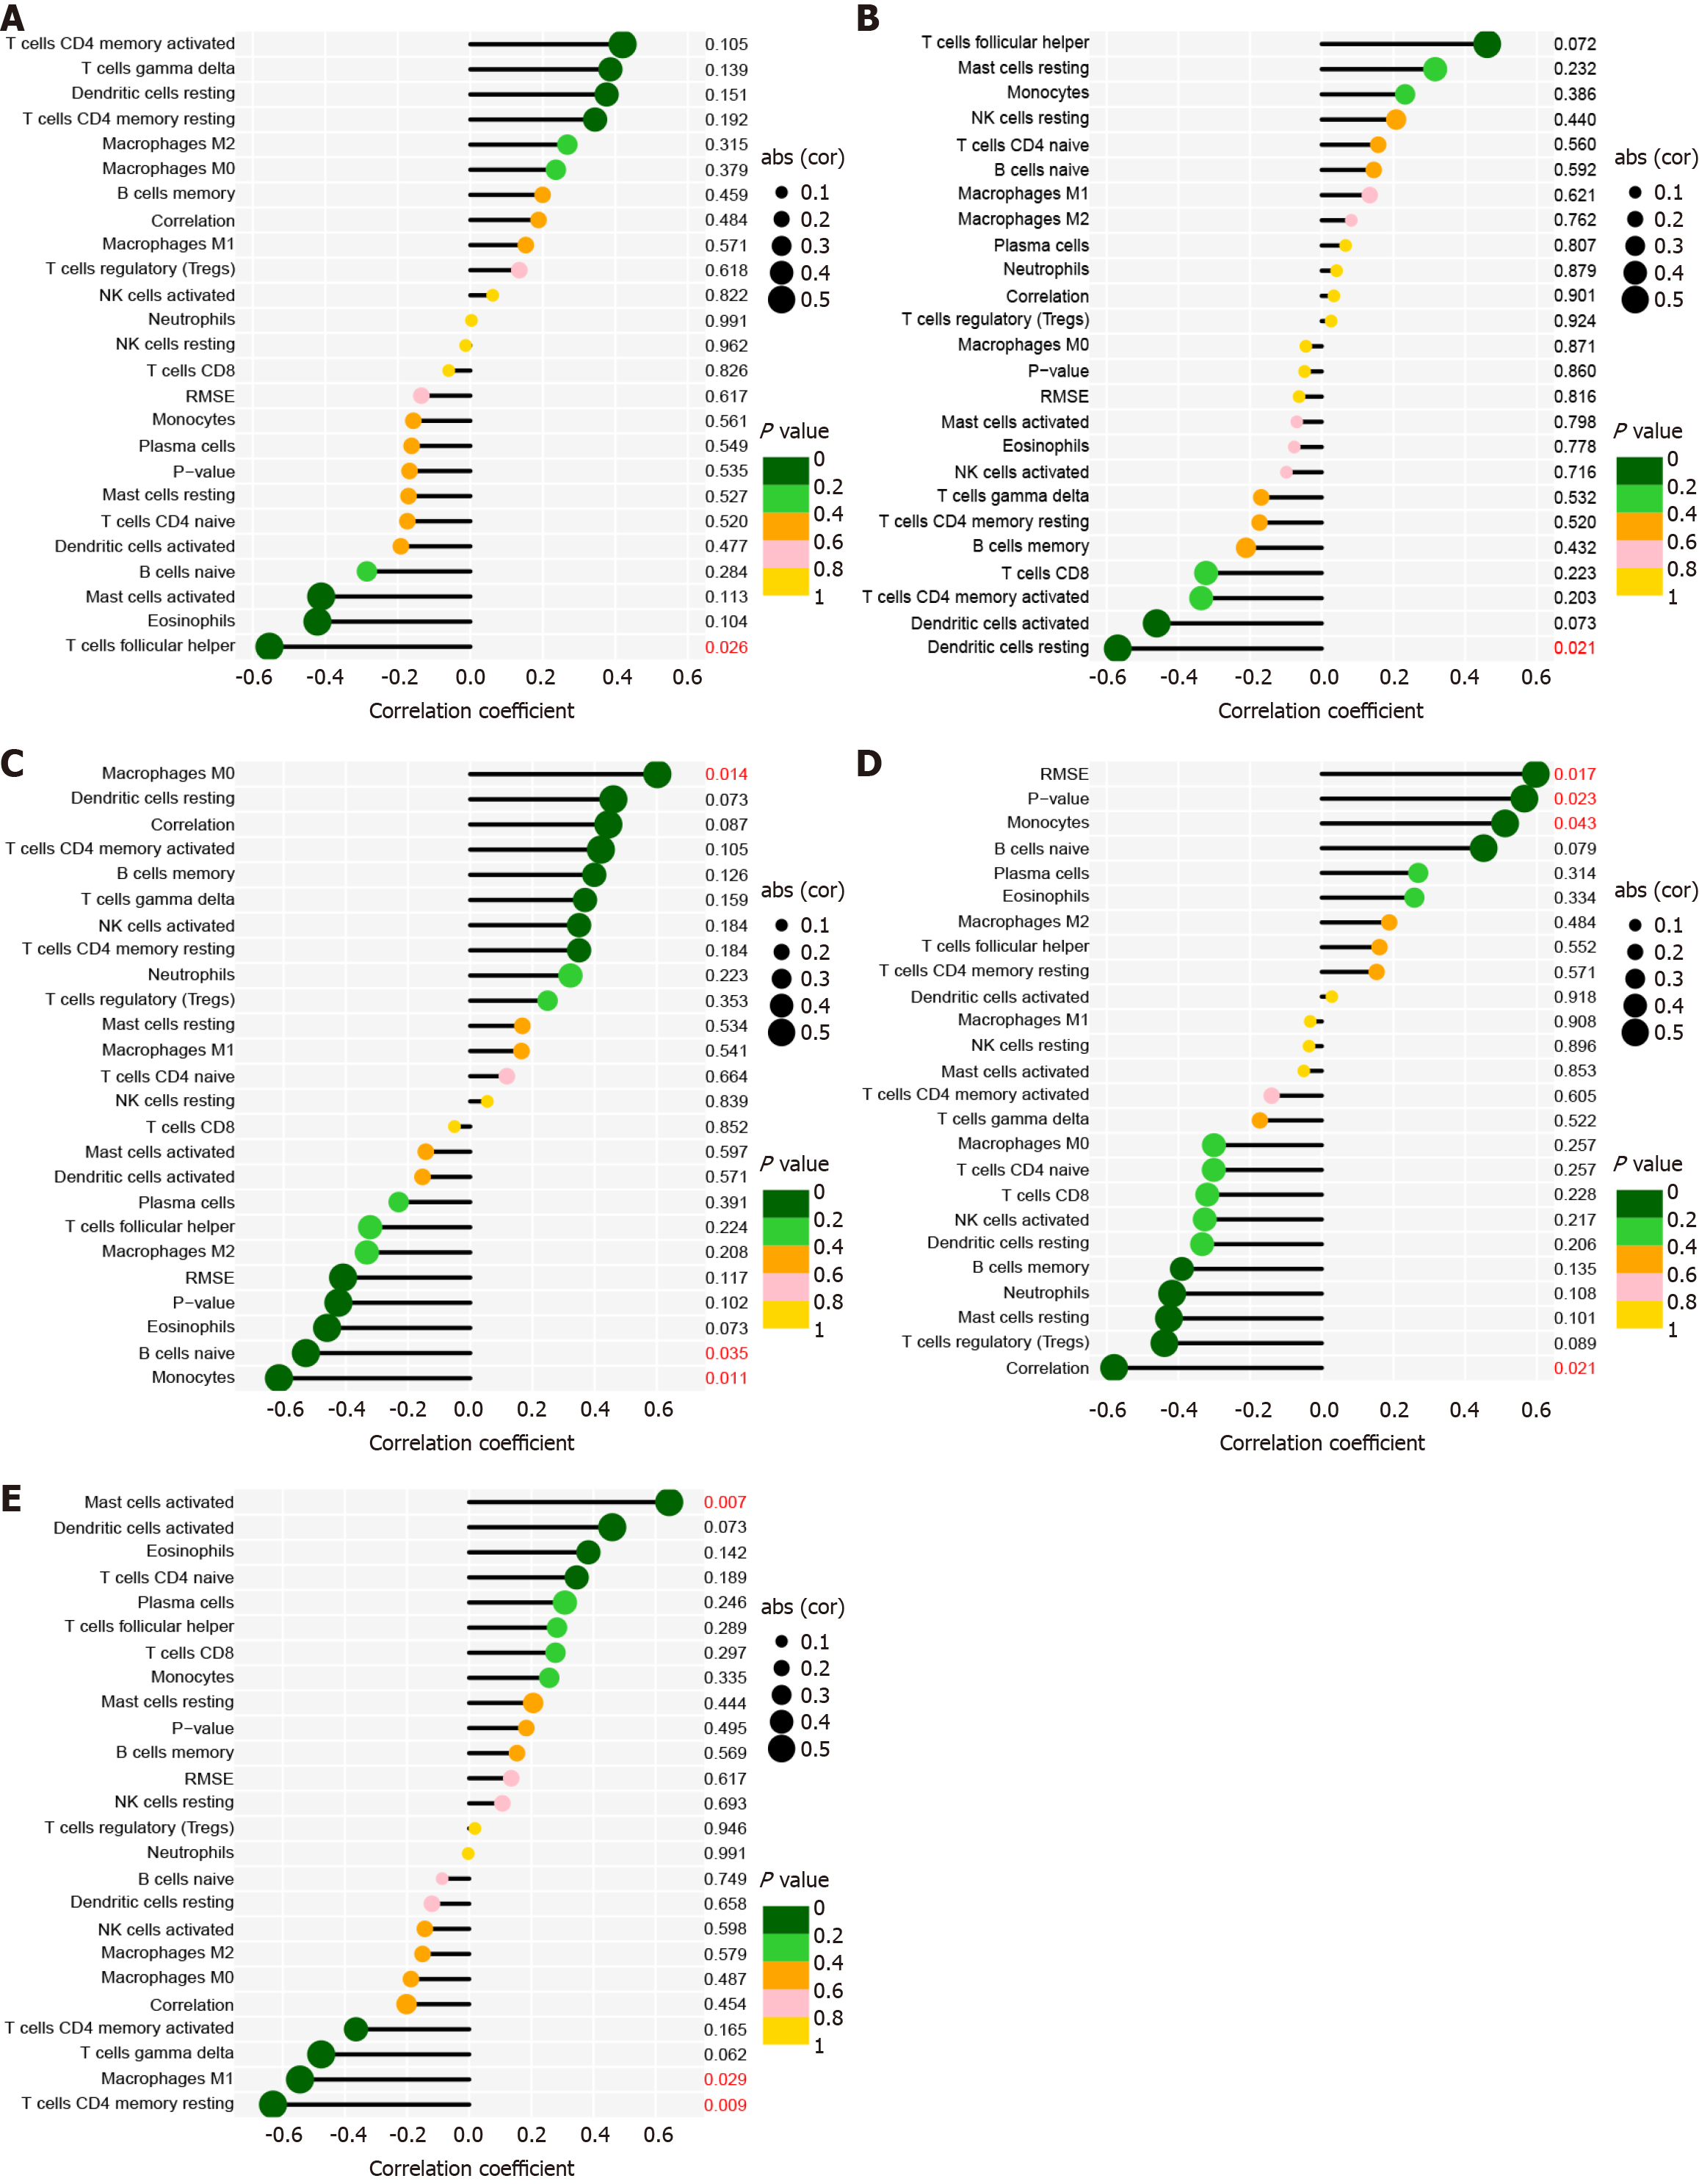
Figure 7 Pertinence between CD247, IL10, CCL5, CCL3, STAT3, and immune cells of primary biliary cholangitis.
A: CD247; B: IL10; C: CCL5; D: CCL3; E: STAT3.
Figure 8 Mendelian randomization study results show no causal relationships between the hub genes and primary biliary cholangitis.
These include IL10, CCL5, CCL3, and STAT3, as demonstrated using forest plots. A: IL10; B: CCL5; C: CCL3; D: STAT3. MR: Mendelian randomization.
- Citation: Yang YC, Ma X, Zhou C, Xu N, Ding D, Ma ZZ, Zhou L, Cui PY. Functional investigation and two-sample Mendelian randomization study of primary biliary cholangitis hub genes. World J Clin Cases 2024; 12(30): 6391-6406
- URL: https://www.wjgnet.com/2307-8960/full/v12/i30/6391.htm
- DOI: https://dx.doi.org/10.12998/wjcc.v12.i30.6391


