©The Author(s) 2024.
World J Clin Cases. Sep 6, 2024; 12(25): 5749-5760
Published online Sep 6, 2024. doi: 10.12998/wjcc.v12.i25.5749
Published online Sep 6, 2024. doi: 10.12998/wjcc.v12.i25.5749
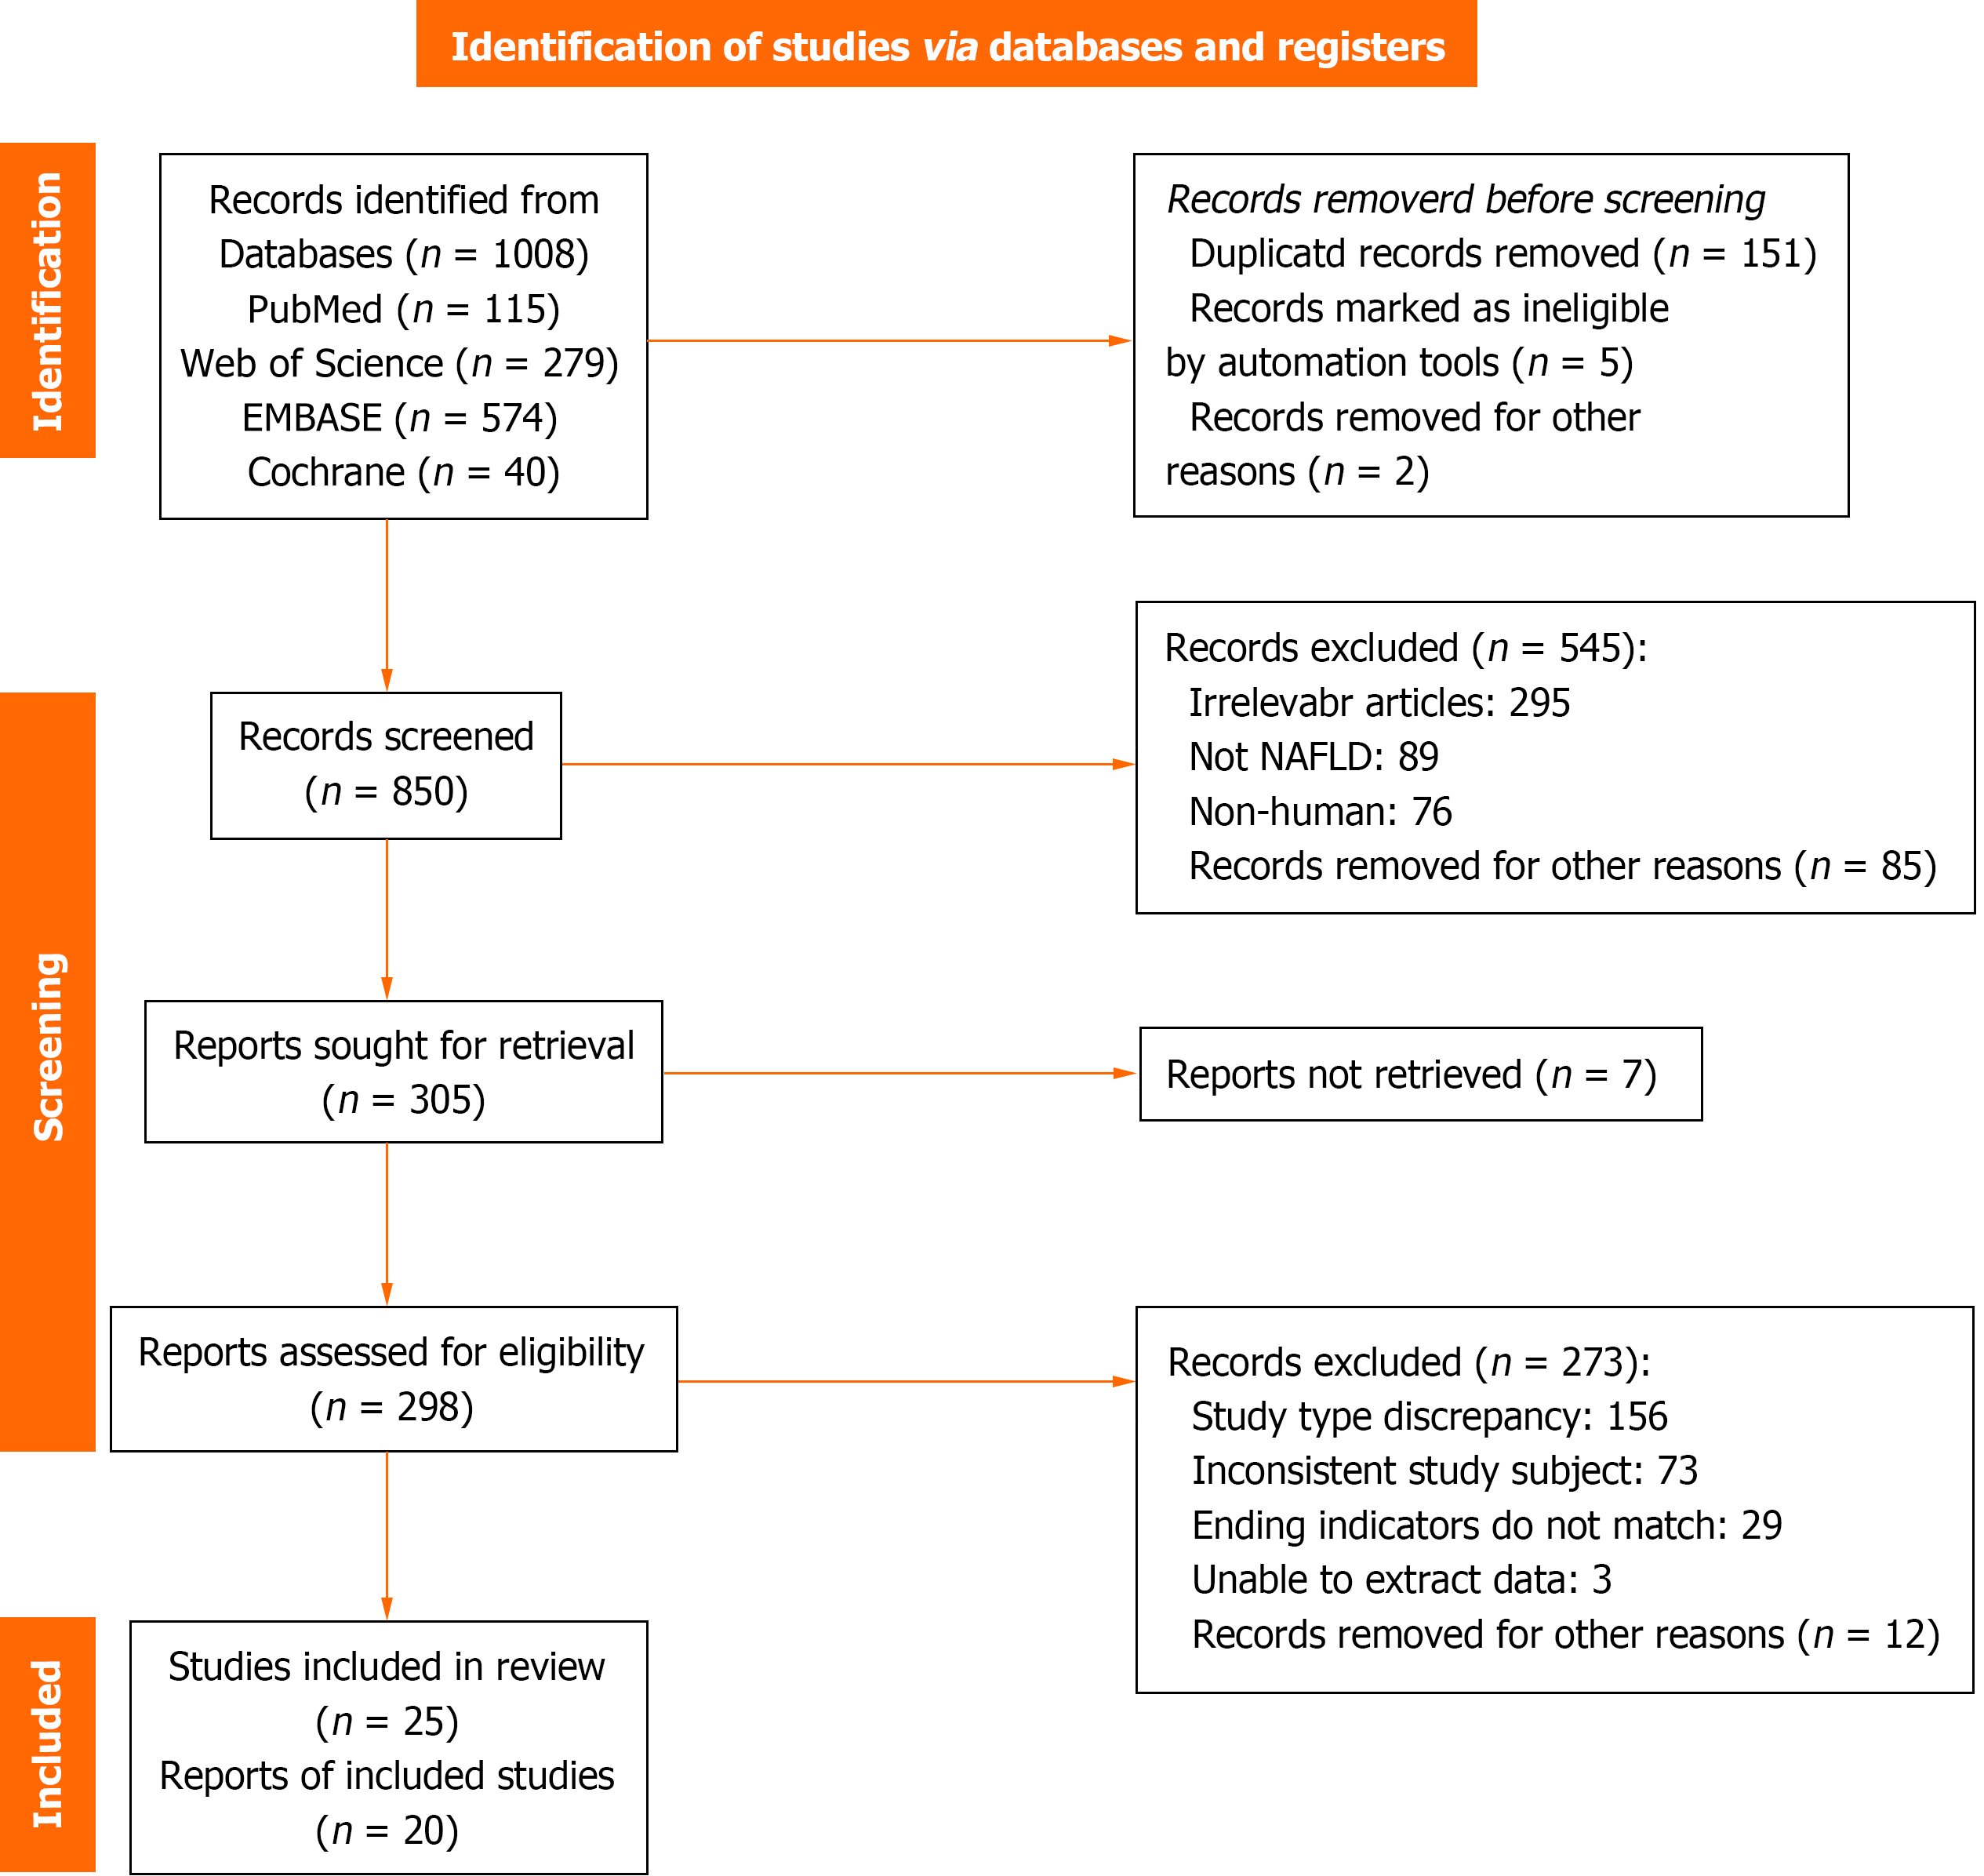
Figure 1
Literature screening strategy.
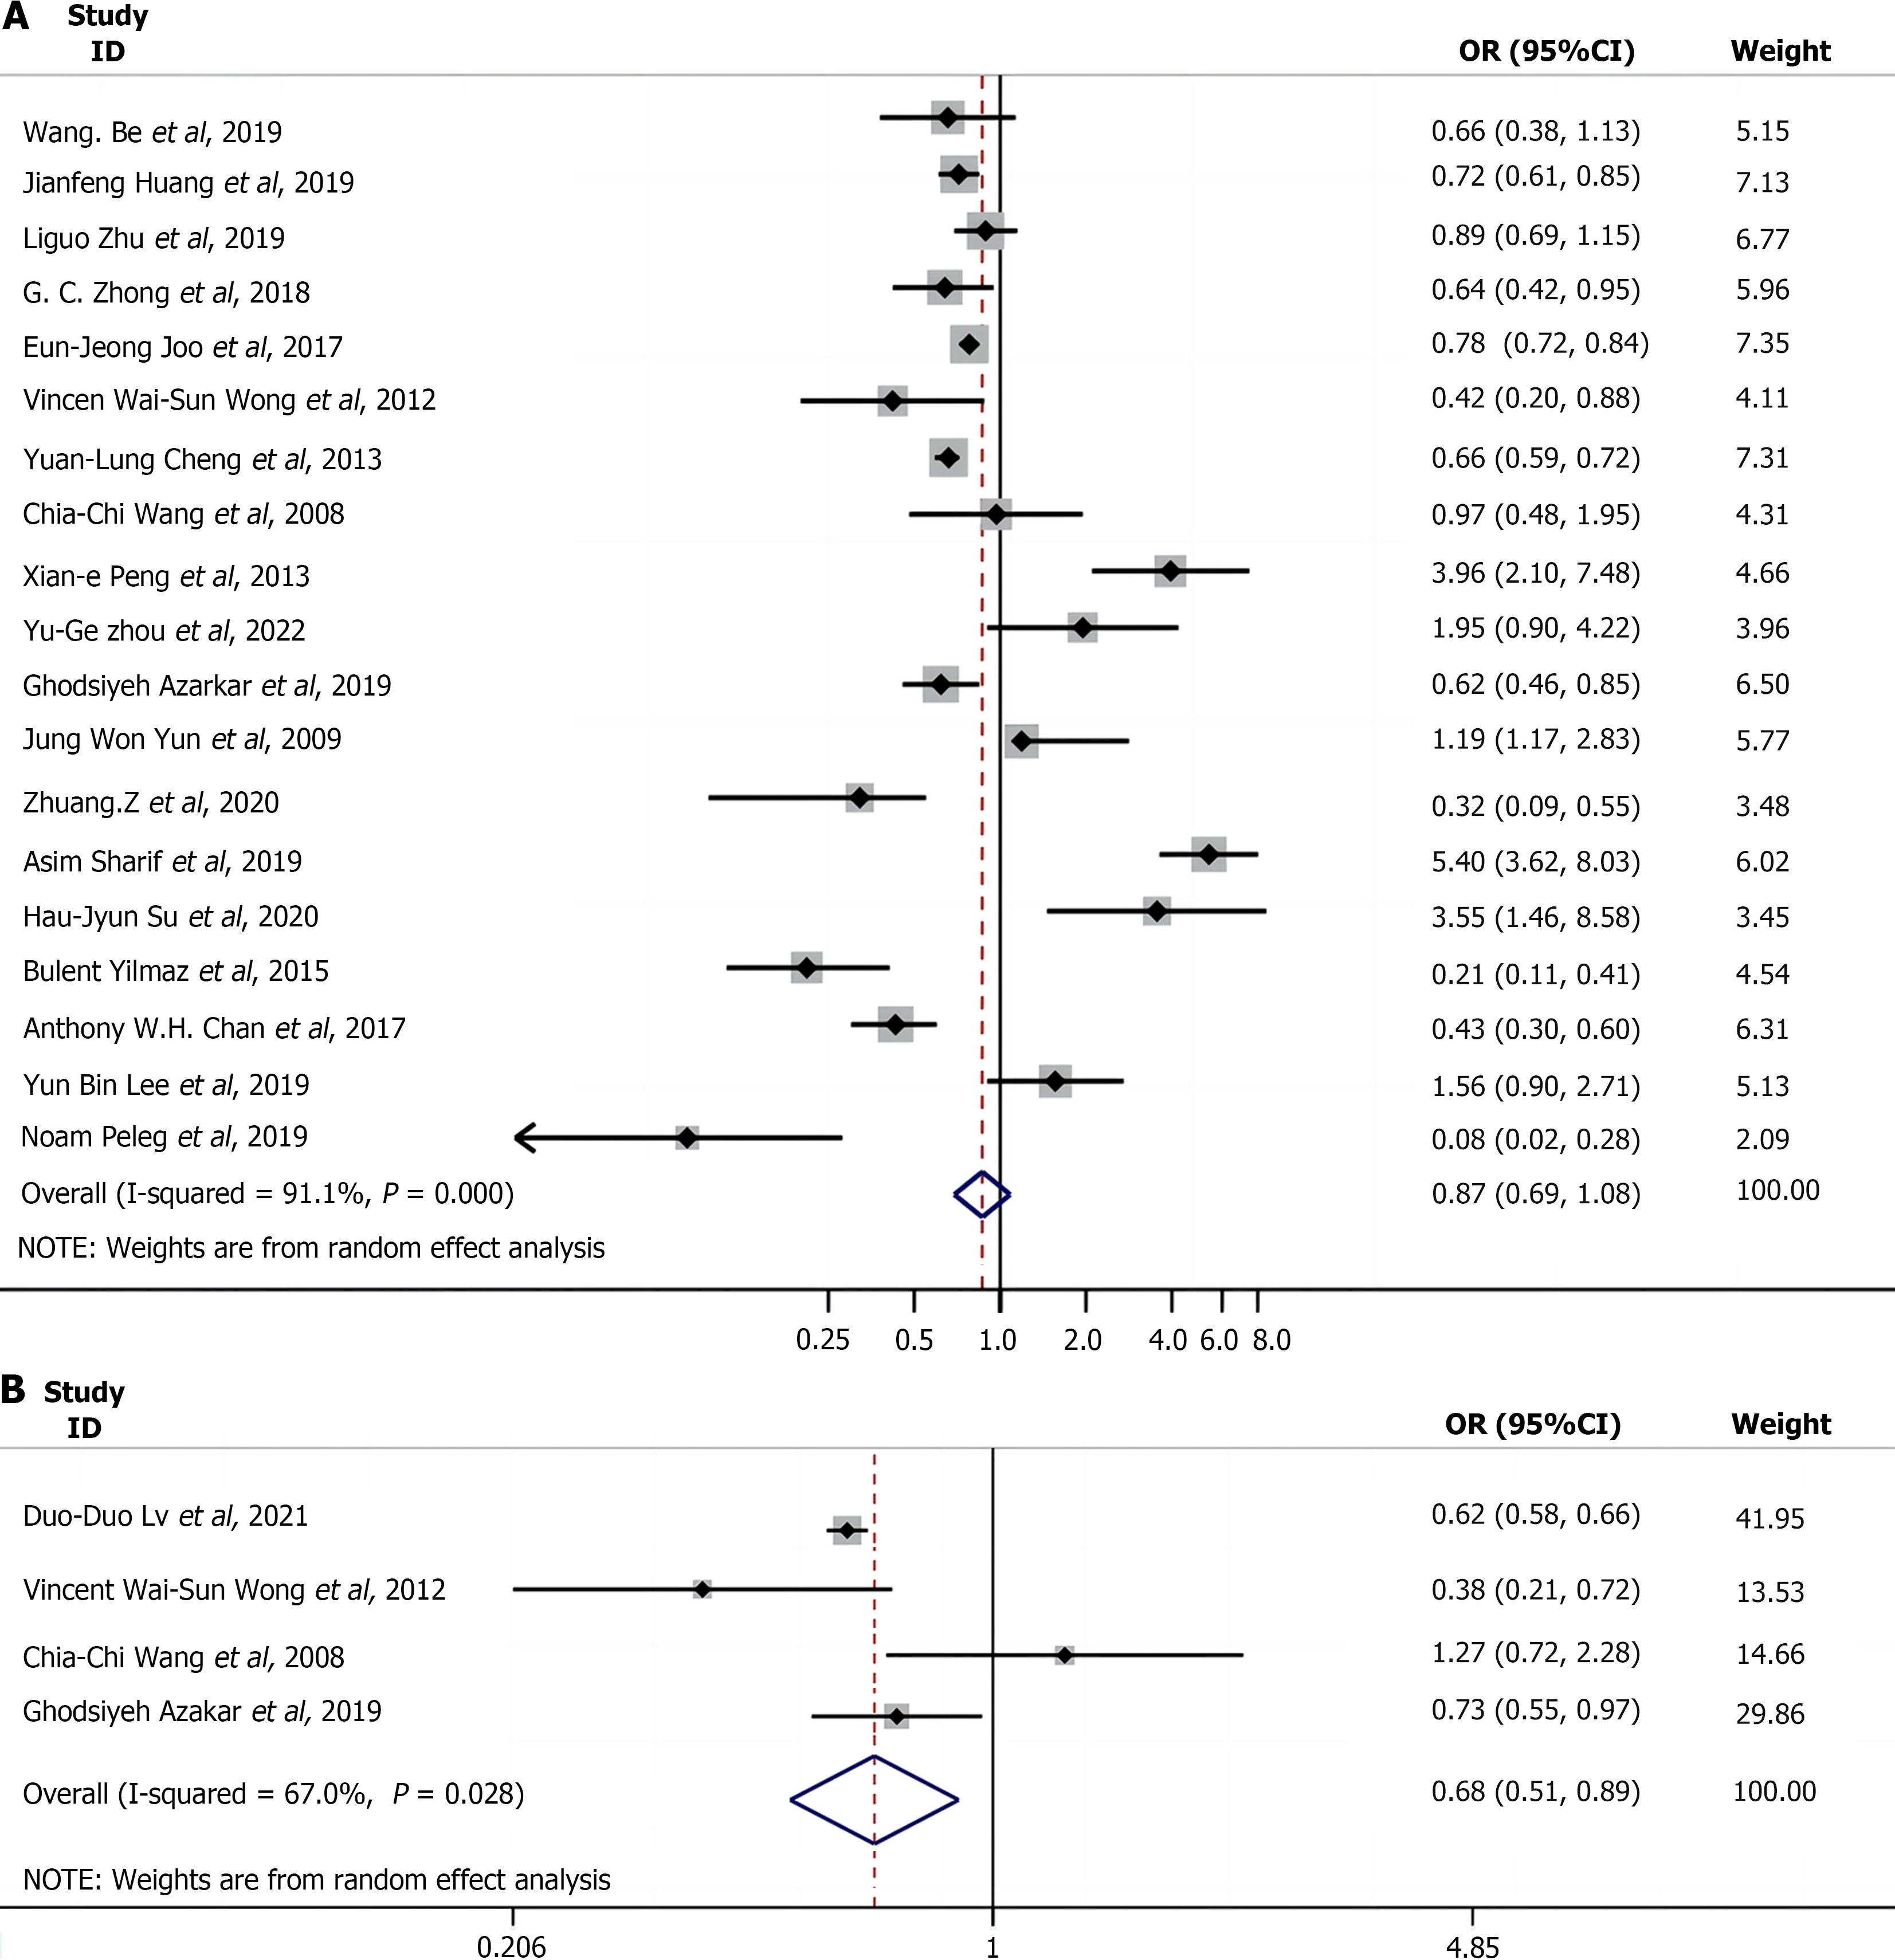
Figure 2 Forest plot.
A: The risk relationship between hepatitis B infection and nonalcoholic fatty liver disease based on OR/RR (95%CI) analysis; B: Comparison of nonalcoholic fatty liver disease incidence between the chronic hepatitis B group and control group. Each point on the X-axis (the horizontal axis) represents the risk estimate for each study. Horizontal lines represent a 95%CI; diamonds represent the summary risk estimate with 95%CI.
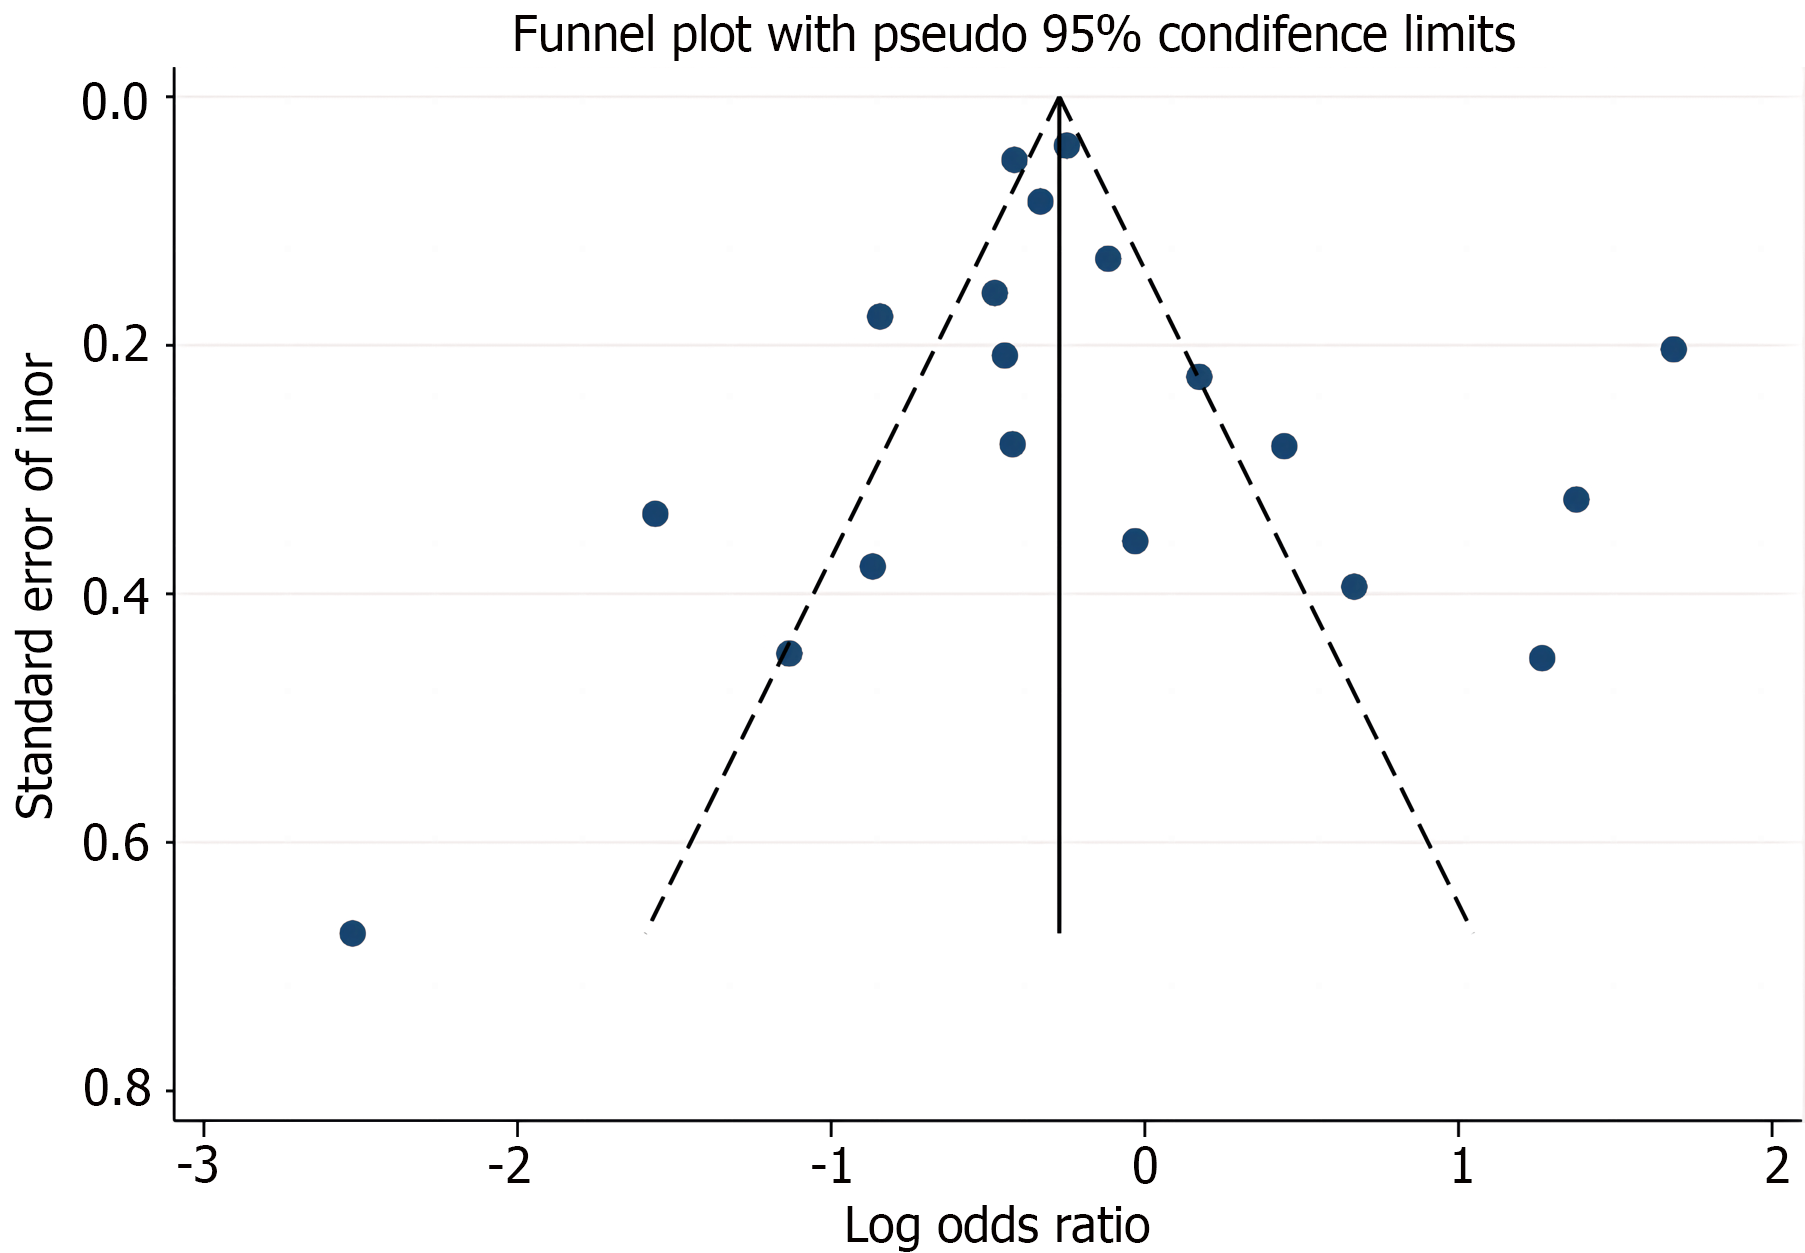
Figure 3
Funnel plot of the relationship between hepatitis B infection and the risk of developing nonalcoholic fatty liver disease.
- Citation: Zhang L, Wu HD, Qian YF, Xu HY. Prevalence of nonalcoholic fatty liver disease in patients with hepatitis B: A meta-analysis. World J Clin Cases 2024; 12(25): 5749-5760
- URL: https://www.wjgnet.com/2307-8960/full/v12/i25/5749.htm
- DOI: https://dx.doi.org/10.12998/wjcc.v12.i25.5749


