©The Author(s) 2024.
World J Clin Cases. May 26, 2024; 12(15): 2655-2663
Published online May 26, 2024. doi: 10.12998/wjcc.v12.i15.2655
Published online May 26, 2024. doi: 10.12998/wjcc.v12.i15.2655
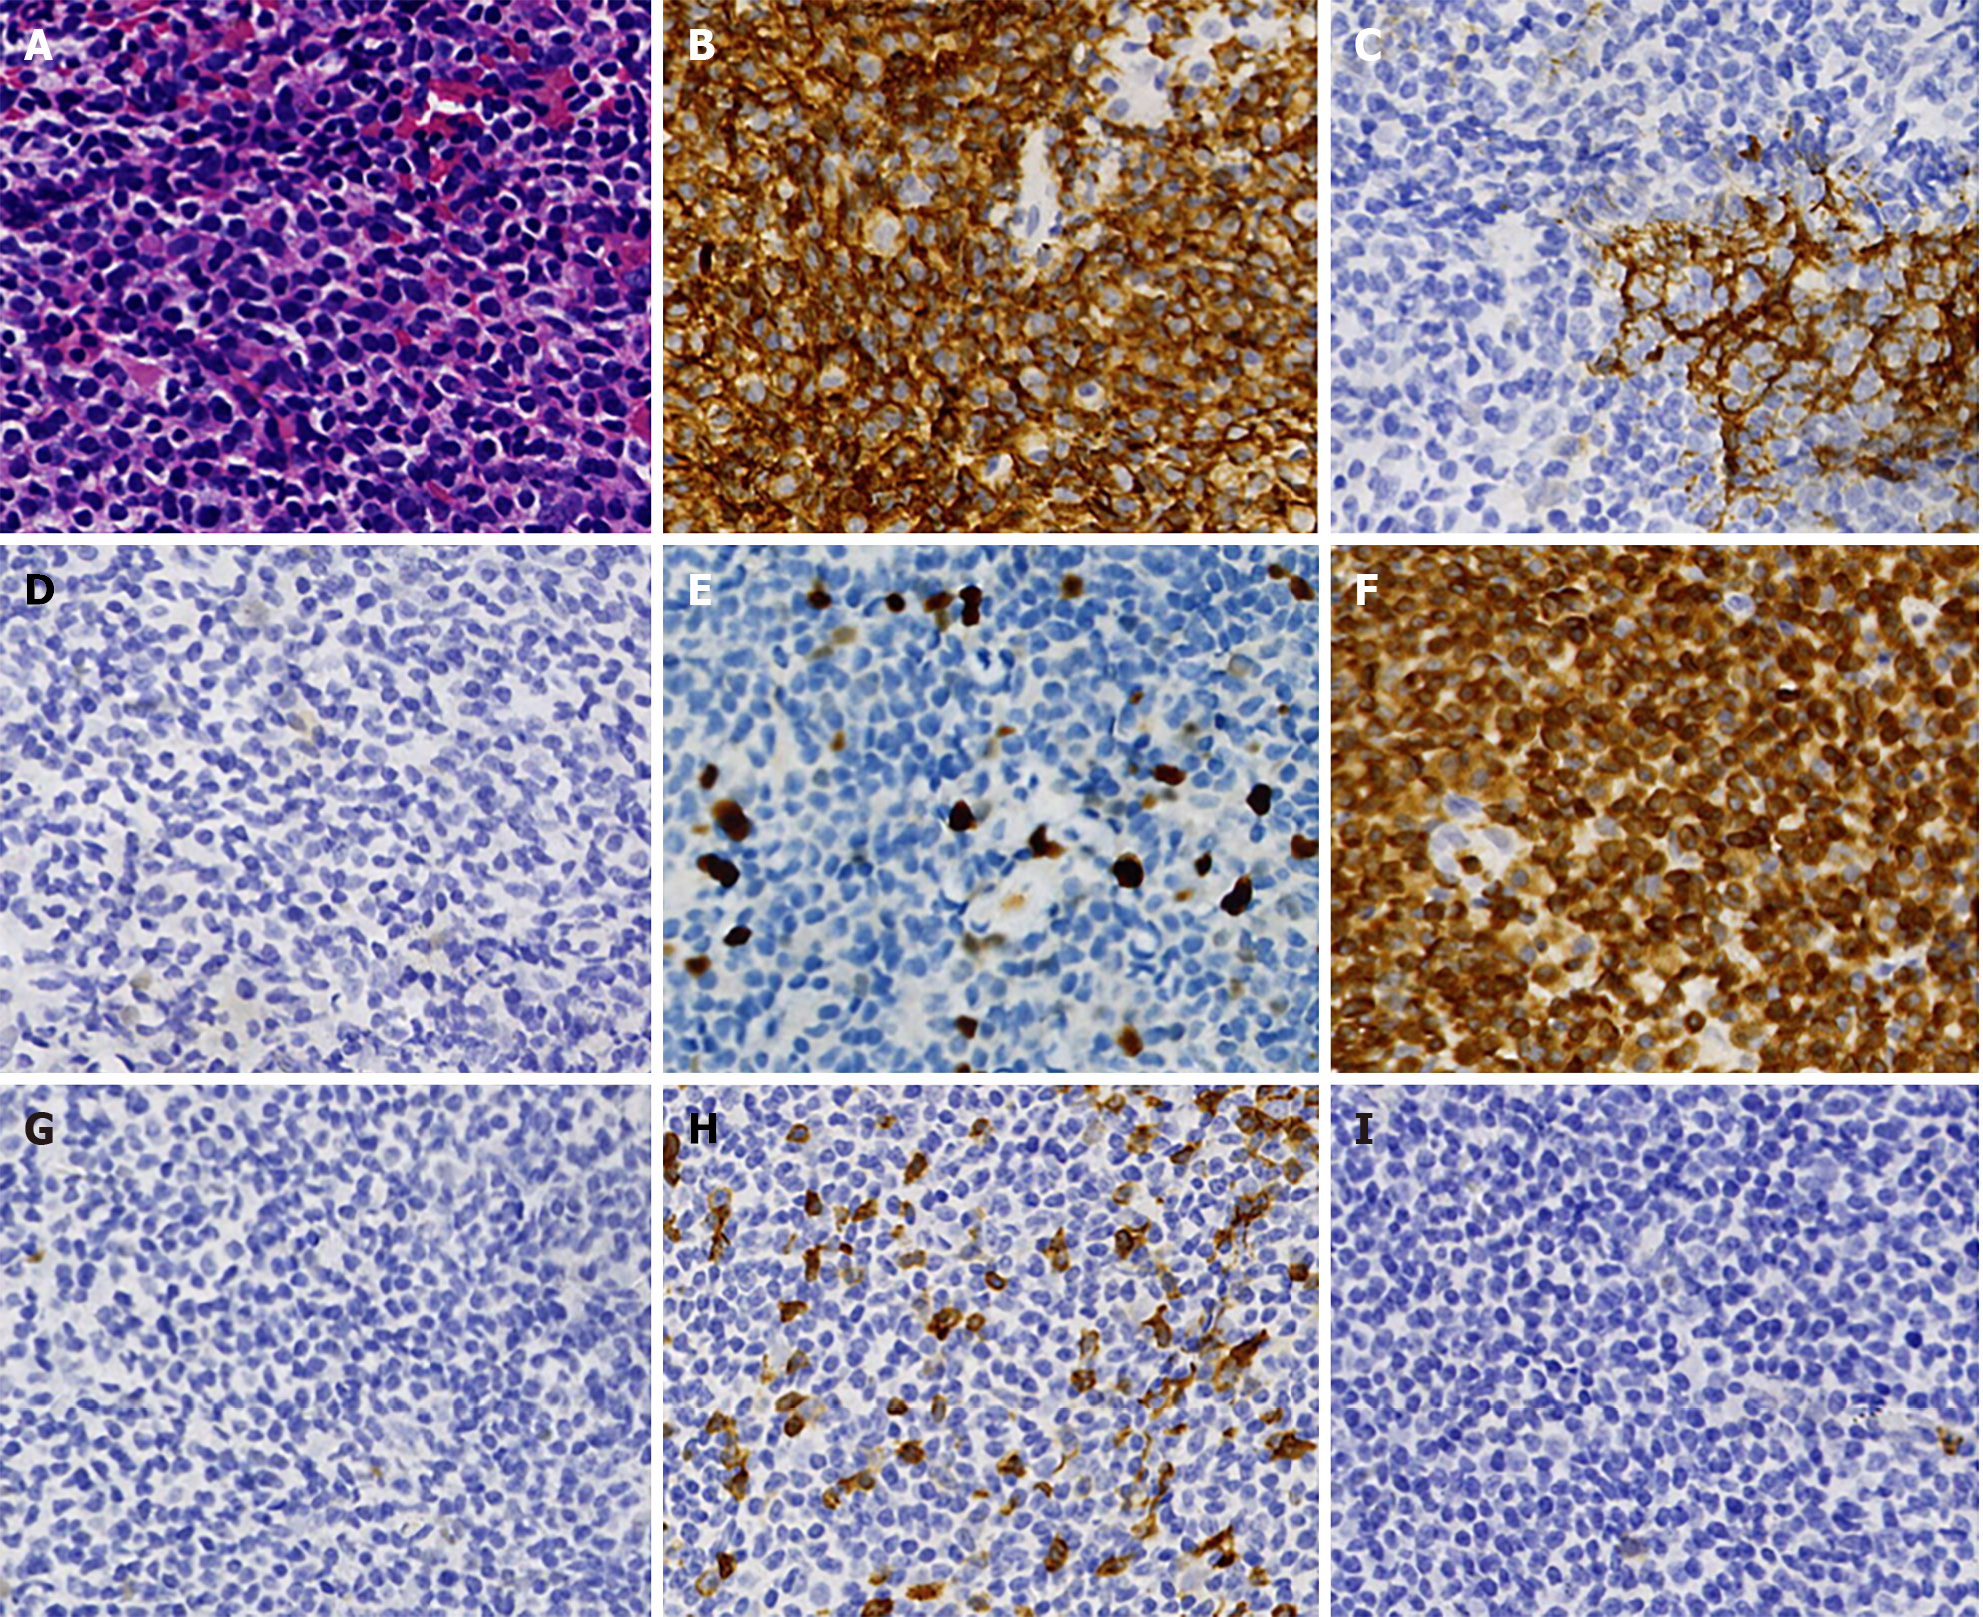
Figure 1 Immunohistochemistry and cellular morphology of the first lymph node biopsy.
A: Tumor cells are diffuse, small to medium in size, with a slightly irregular nucleus. The lymphocytic hyperplasia shows partial cytoplasmic empty and a fuzzy nodular distribution (hematoxylin and eosin, 400 ×); B-I: The majority of the infiltrating cells were positive for CD20 (B), PAX5, B-cell lymphoma-2 (BCL-2) (F), CD21, CD23 (C), and negative for CD10 (I), CD5 (H), BCL-6 (G), and CyclinD1 (D). Their Ki-67 (E) showed approximately 10% (EnVision, 400 ×).
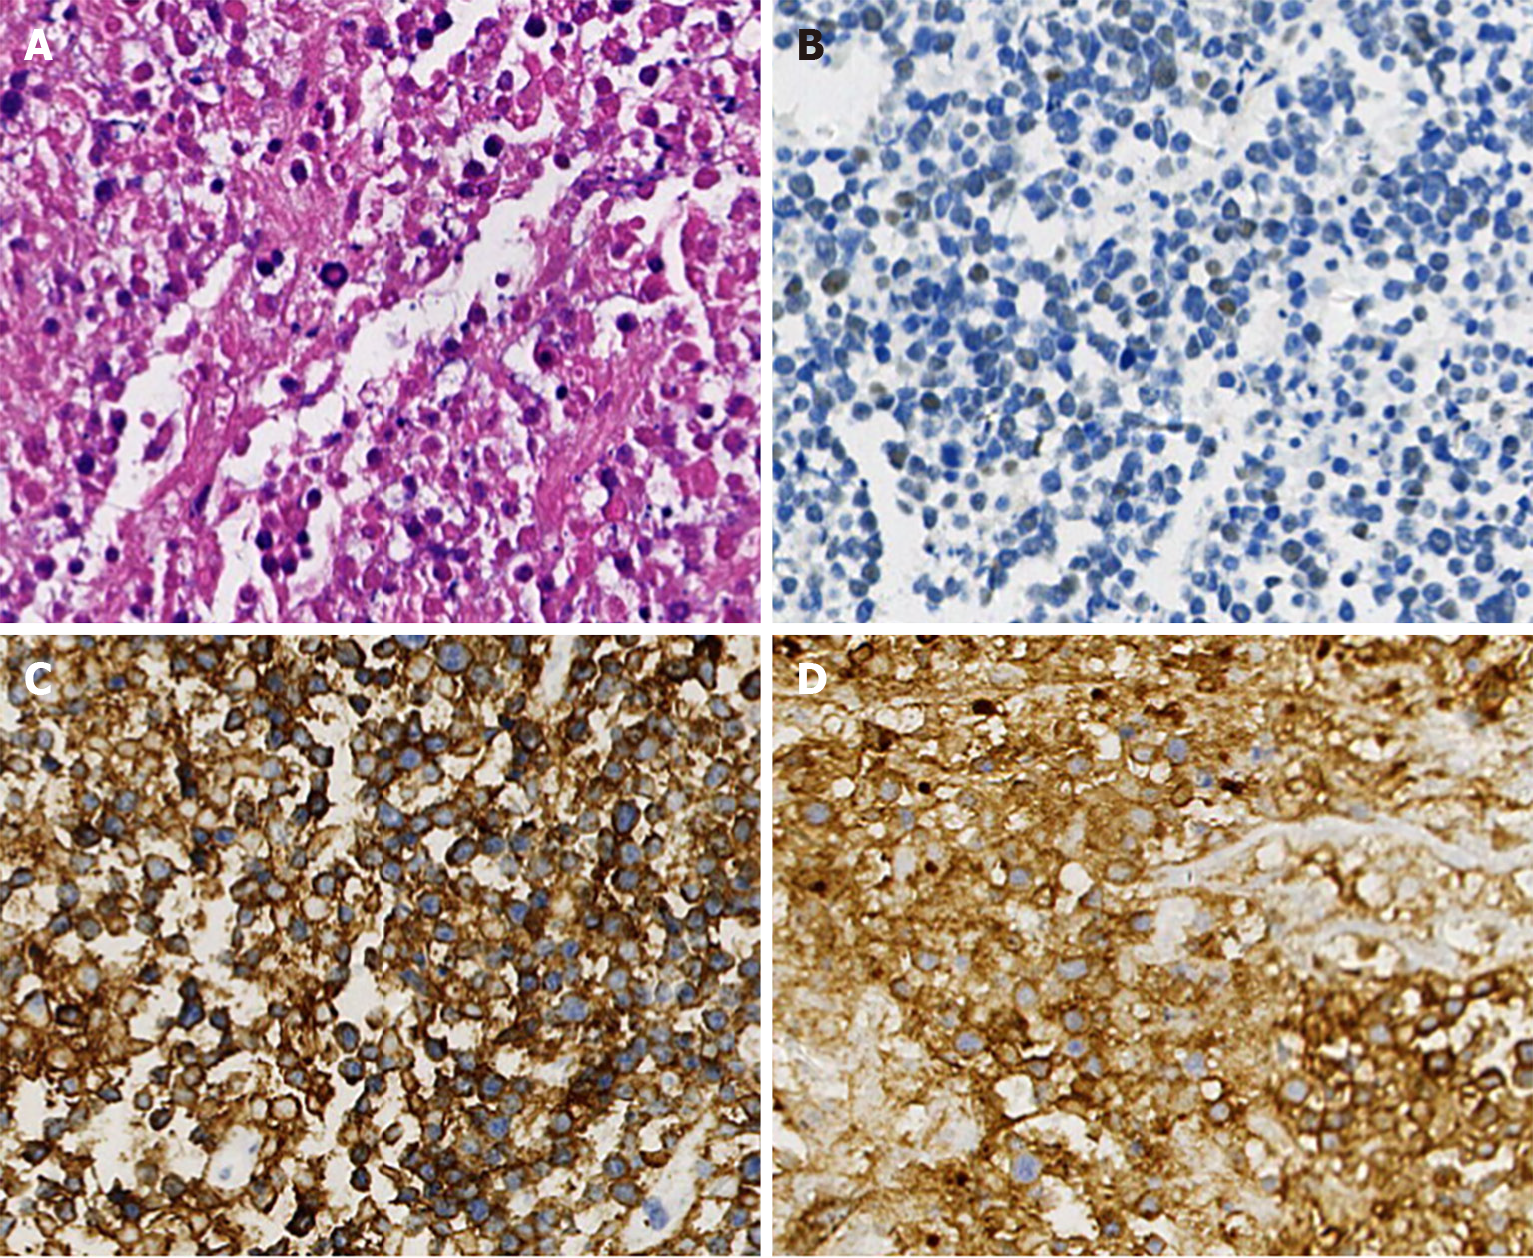
Figure 2 Immunohistochemistry and histopathology of the second lymph node biopsy.
A: The lymph node was replaced by diffuse medium to small tumor cells, with multifocal and massive necrosis (hematoxylin and eosin, 400 ×); B-D: Immunohistochemistry showed the positives of CD20 (C), CD10 (D), and CD5, partially positive of terminal deoxynucleotidyl transferase (B) for tumor cells (EnVision, 400 ×).
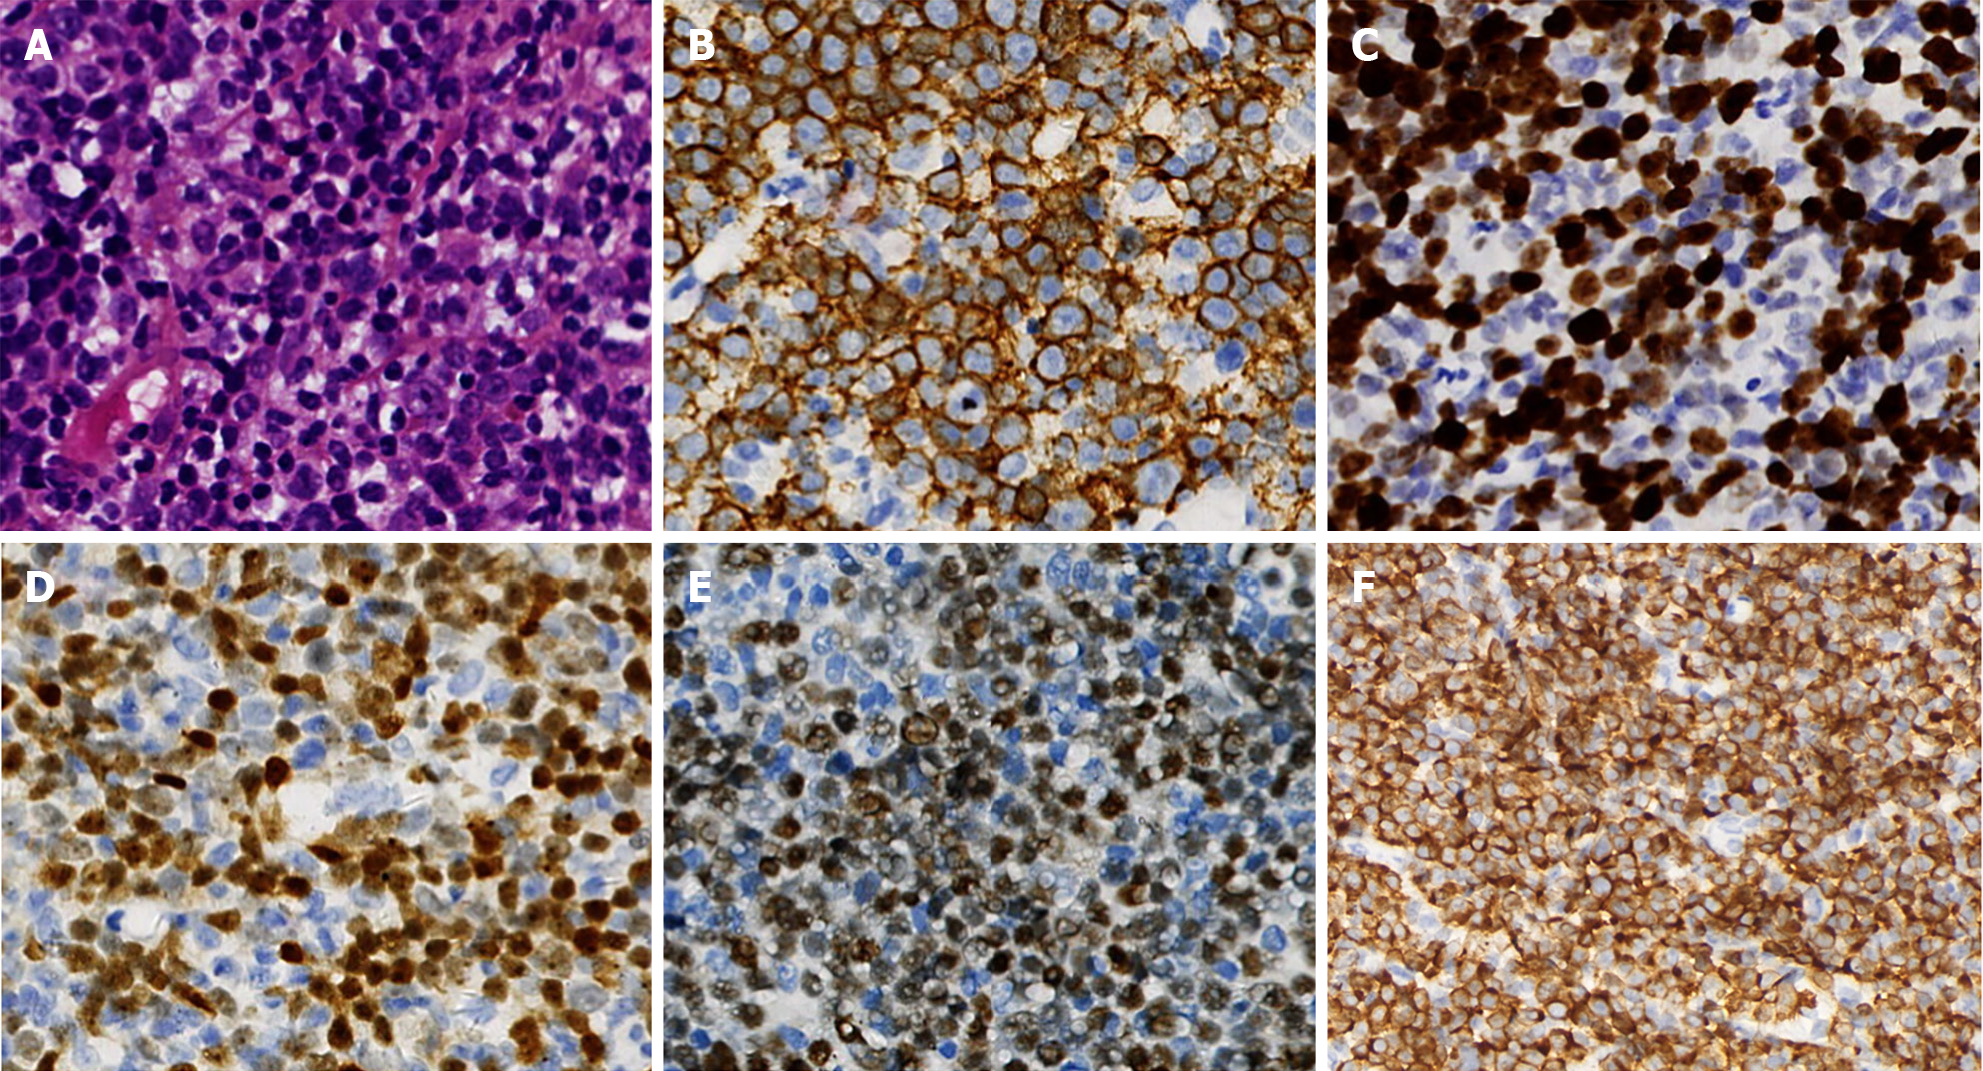
Figure 3 Immunohistochemistry and cellular morphology of the third lymph node biopsy.
A: The lymph node was infiltrated diffusely by medium to moderately large tumor cells, which showed little to moderate cytoplasm, round oval or slightly depressed nuclei with slightly rough chromatin and nucleoli (hematoxylin and eosin, 400 ×); B-F: The neoplastic cells were positive for CD20 (B), terminal deoxynucleotidyl transferase (D), B-cell lymphoma-2 (F) (about 90%), C-myelocytomatosis viral oncogene (E) (about 70%), Ki-67 (C) (approximately 80%), immunohistchemically (EnVision, 400 ×).
Figure 4 Fluorescence in situ hybridization of the third lymph node.
A: The fluorescence in situ hybridization analysis was performed using probed from Vysis. 3'myelocytomatosis viral oncogene (MYC)-green spectrum, 5'MYC-red spectrum. White arrows indicate the signal of MYC-rearrangement; B and C: B-cell lymphoma-2 (BCL-2) (B) and BCL-6 (C) rearrangements were negative.
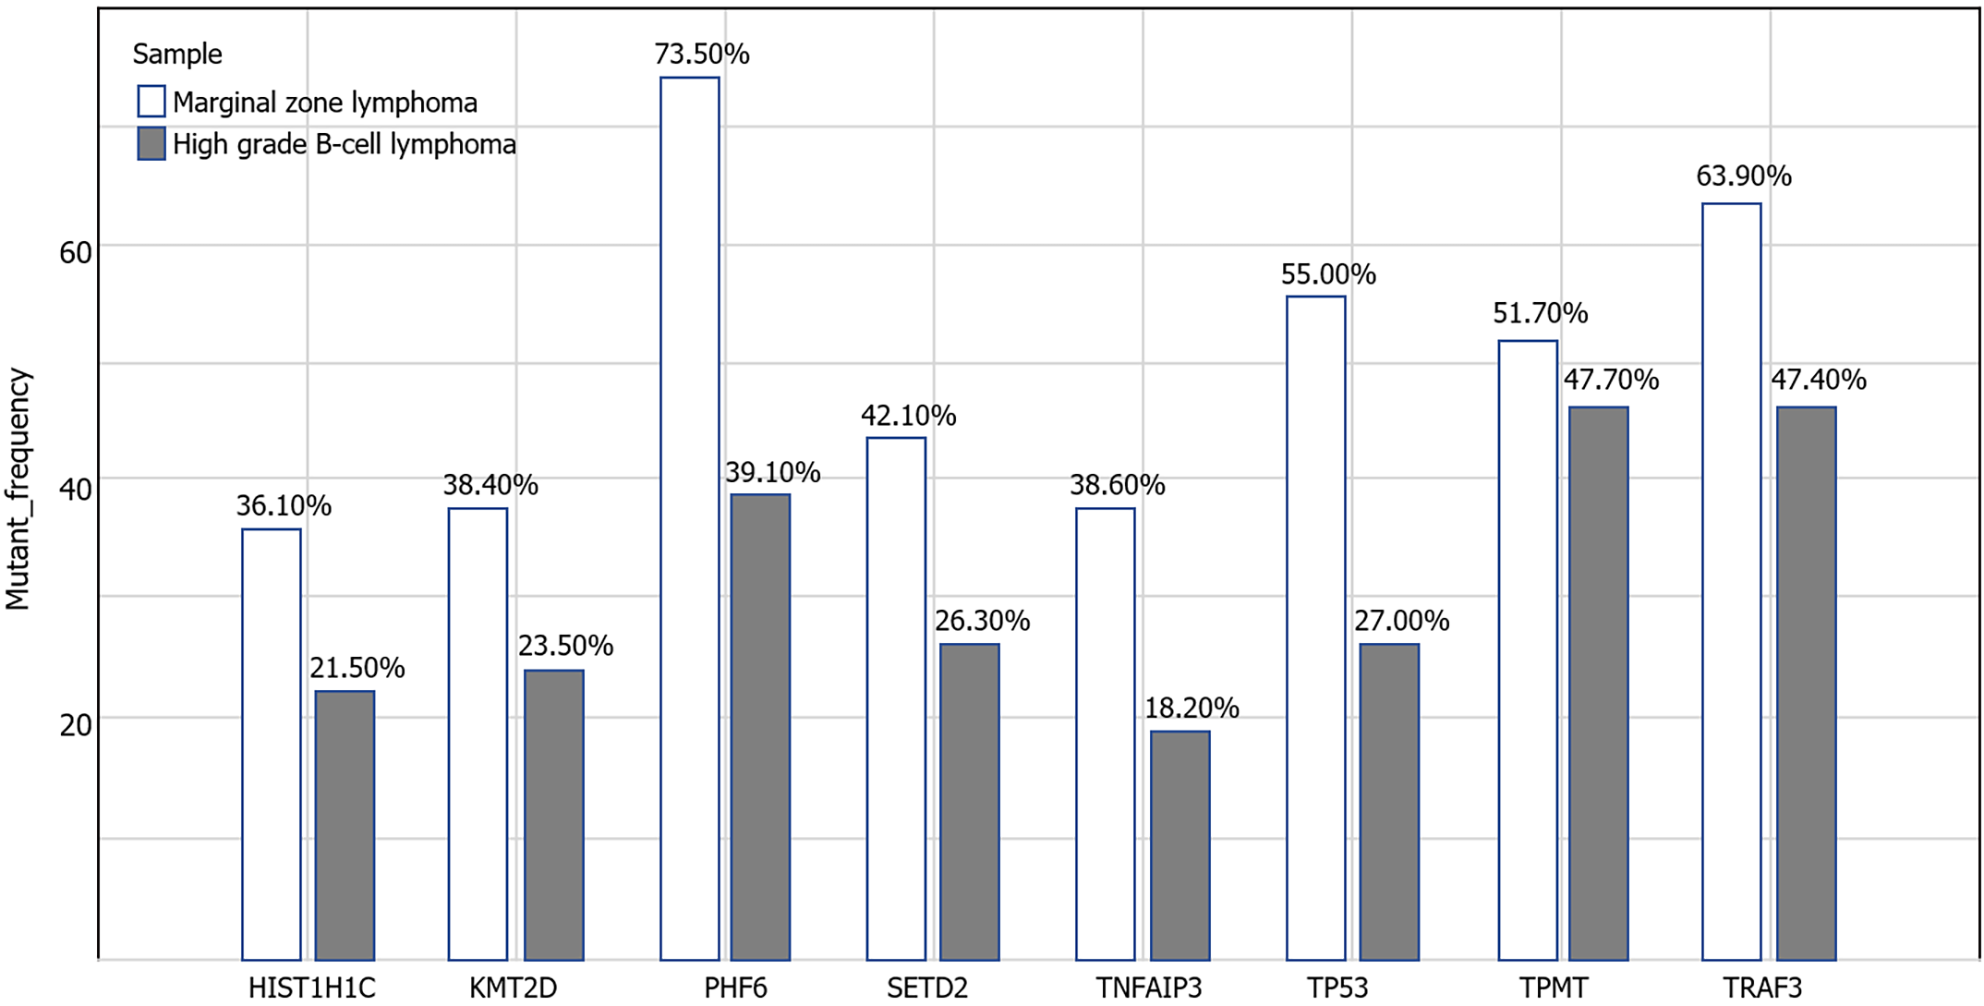
Figure 5 Next generation sequencing of tumor cells before and after transformation.
Before transformation, TP53, PHF6, TPMT, HIST1H1C, KMT2D,SETD2, TNFAIP3 and TRAF3 were positive for tumor cells. Compared with before, they still had the same mutation but the mutation frequency was decreased.
- Citation: Fan ZM, Wu DL, Xu NW, Ye L, Yan LP, Li LJ, Zhang JY. Transformation of marginal zone lymphoma into high-grade B-cell lymphoma expressing terminal deoxynucleotidyl transferase: A case report. World J Clin Cases 2024; 12(15): 2655-2663
- URL: https://www.wjgnet.com/2307-8960/full/v12/i15/2655.htm
- DOI: https://dx.doi.org/10.12998/wjcc.v12.i15.2655


