©The Author(s) 2024.
World J Clin Cases. May 26, 2024; 12(15): 2606-2613
Published online May 26, 2024. doi: 10.12998/wjcc.v12.i15.2606
Published online May 26, 2024. doi: 10.12998/wjcc.v12.i15.2606
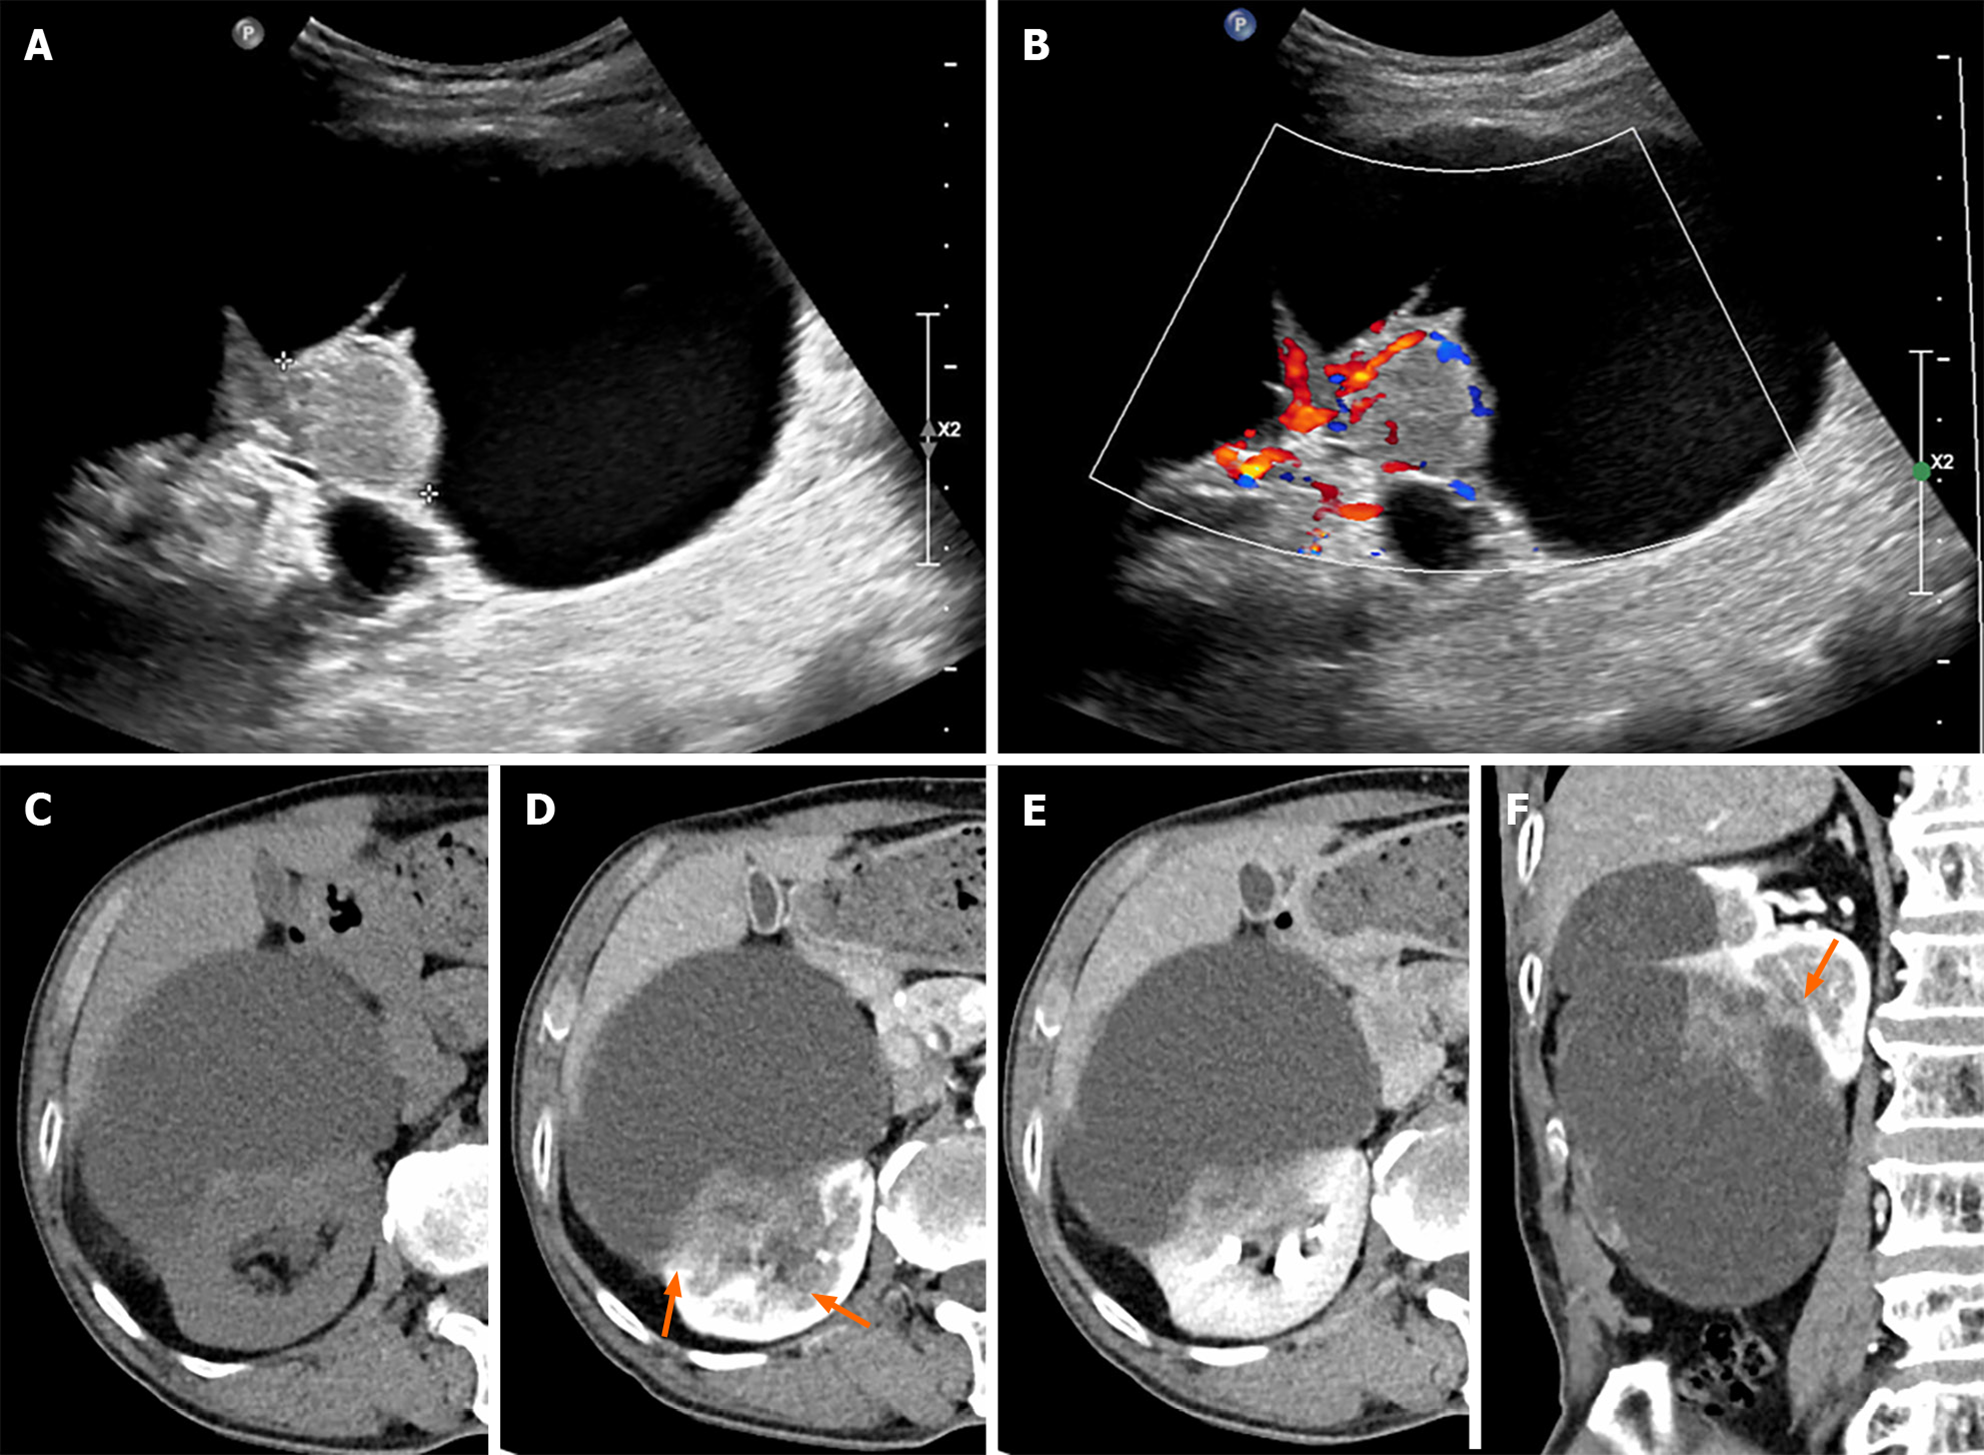
Figure 1 Initial ultrasound and abdominal computed tomography scan of the right kidney.
A: An 11 cm × 10 cm cystic lesion is noted in the right kidney with a 3.2 cm solid component on ultrasound B-mode; B: Increased vascularity is seen in the solid component on color doppler mode; C: A pre-contrast phase axial computed tomography (CT) shows a cystic lesion with a mass at the posterior-lateral aspect of the right kidney interpolar region-lower pole. A subtle high-attenuation area is seen in the cystic lesion, suggesting hemorrhage; D and E: Corticomedullary and excretory phase axial CT shows progressive enhancement of the mass (pre-contrast phase: 40 HU, corticomedullary phase: 70 HU, excretory phase: 80 HU) and a suspiciously indistinct margin (orange arrows) and invasion of the sinus; F: Corticomedullary phase coronal CT scan shows an irregular enhancing mass in a lesion with indistinct margins (orange arrow).
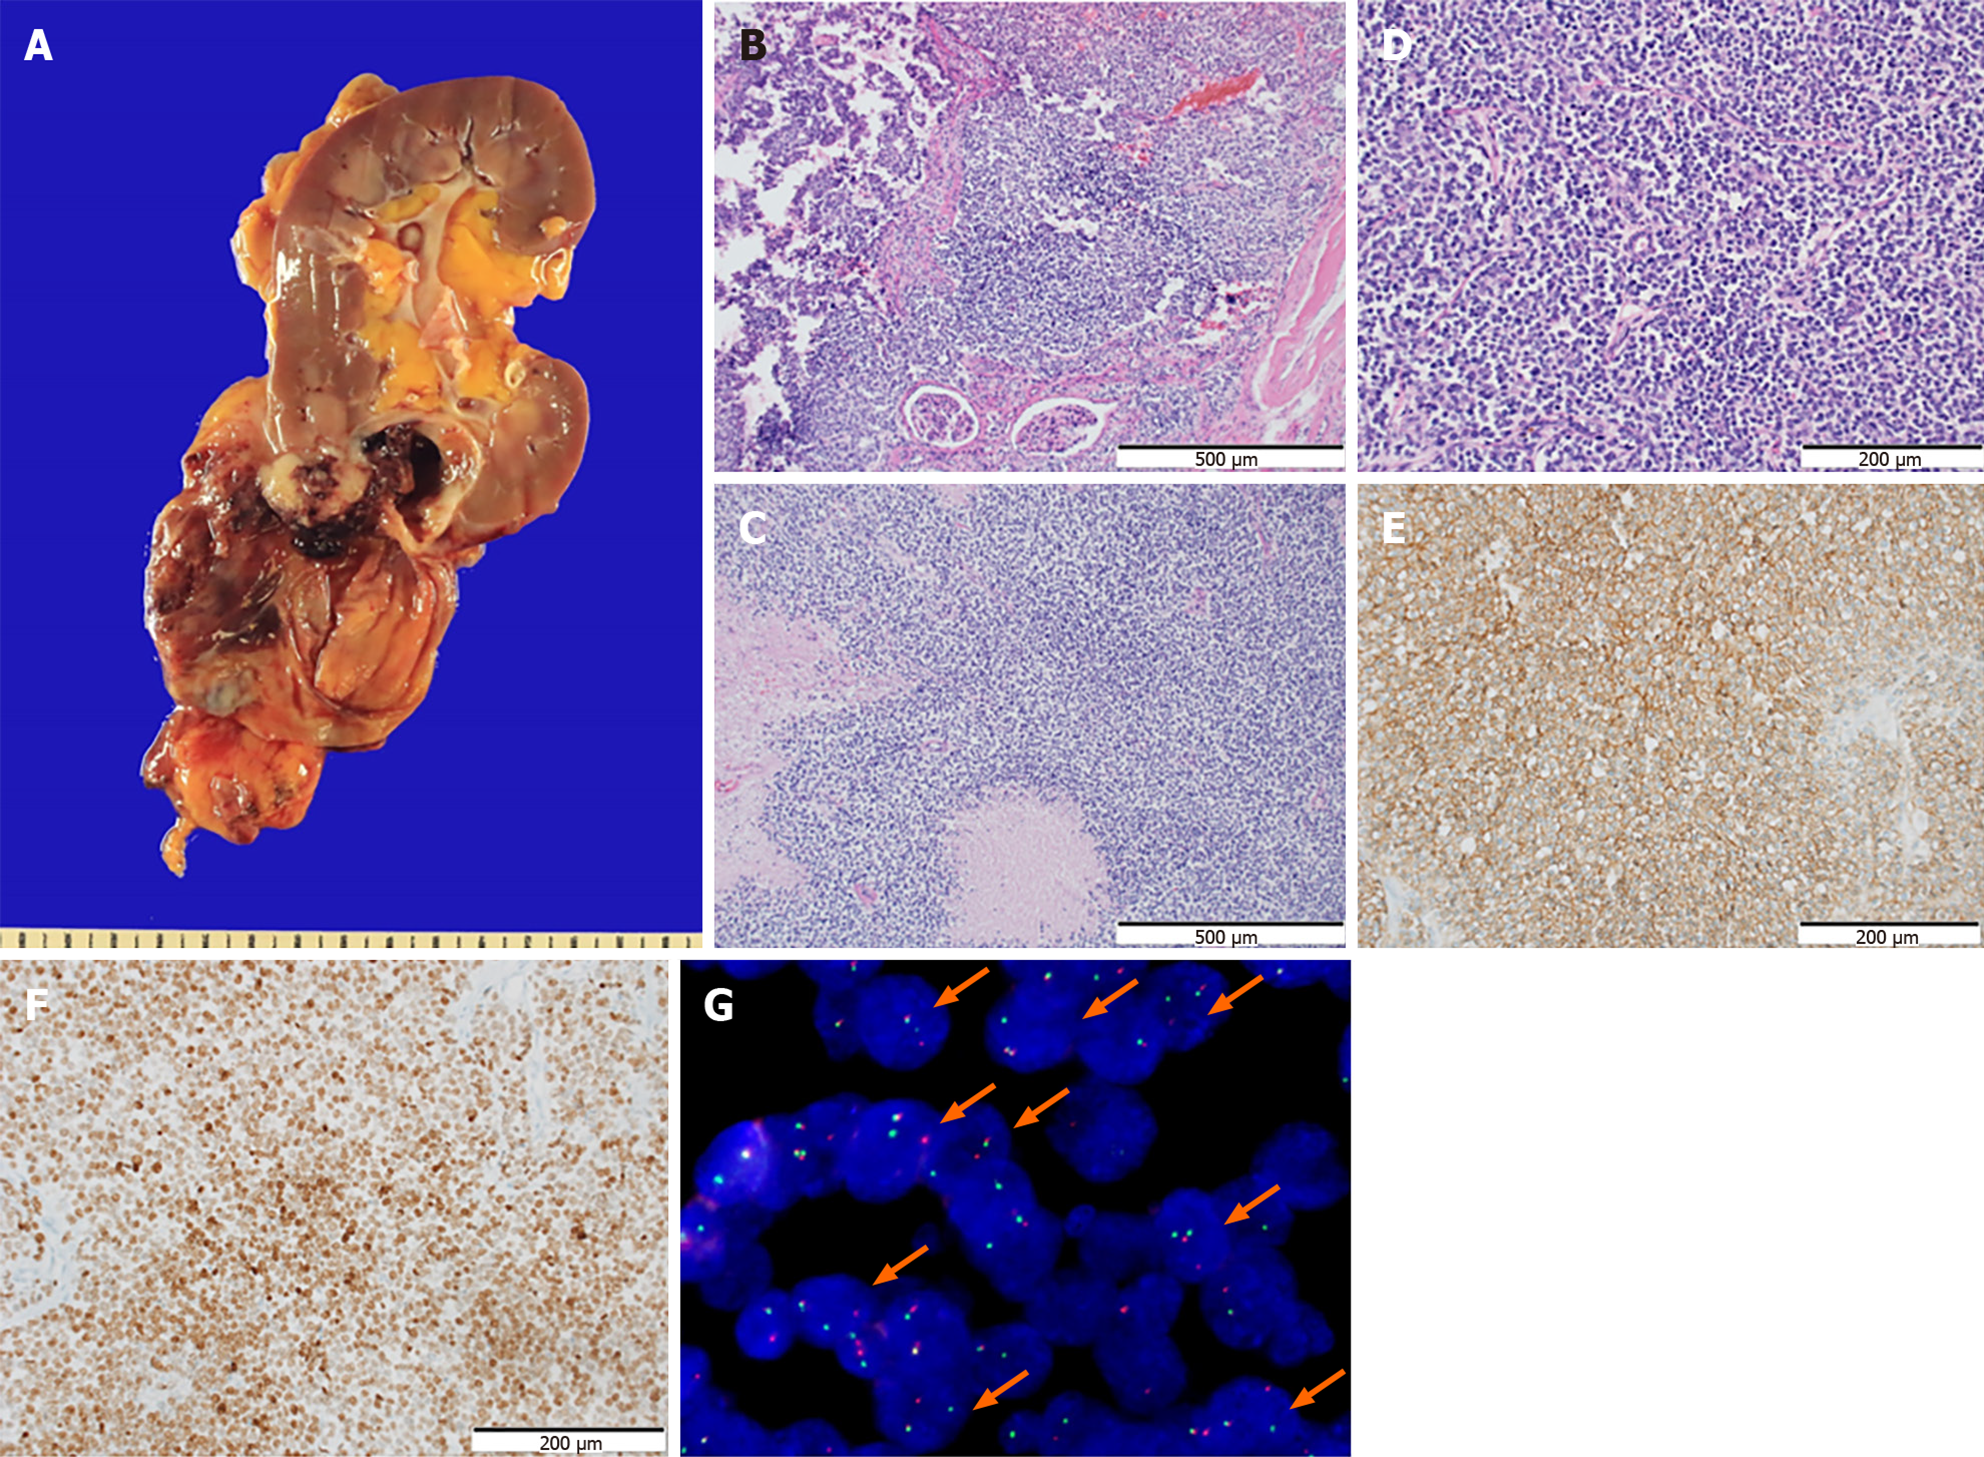
Figure 2 Morphological features and immunostaining results of the tumor.
A: A huge cystic mass in the lower pole of the right kidney without rupture. Most parts of the tumor consisted of cystic lesions, while the solid area showed infiltration into the renal parenchyma grossly; B: The border of the tumor infiltrating into the renal parenchyma is also identified on the hematoxylin and eosin (HE) sections (× 100). Staining method: HE staining; C: Frequent necrosis is observed (× 100). Staining method: HE staining; D: The section shows a relatively diffuse sheet pattern composed of small round tumor cells. The tumor cells show no glandular or squamous differentiation and present moderate pleomorphism (× 200). The nuclei are monotonous with inconspicuous nucleoli. The tumor has scanty or clear cytoplasm (× 200). Staining method: HE staining; E and F: The tumor cells exhibit diffuse membranous stain for CD99 (E, × 200) and nuclear stain for NK2 Homeobox 2 (F, × 200). Staining method: Polymer method; G: Fluorescence in situ hybridization exhibits the diagnostic t (11; 22) EWSR1 translocation (orange arrows).
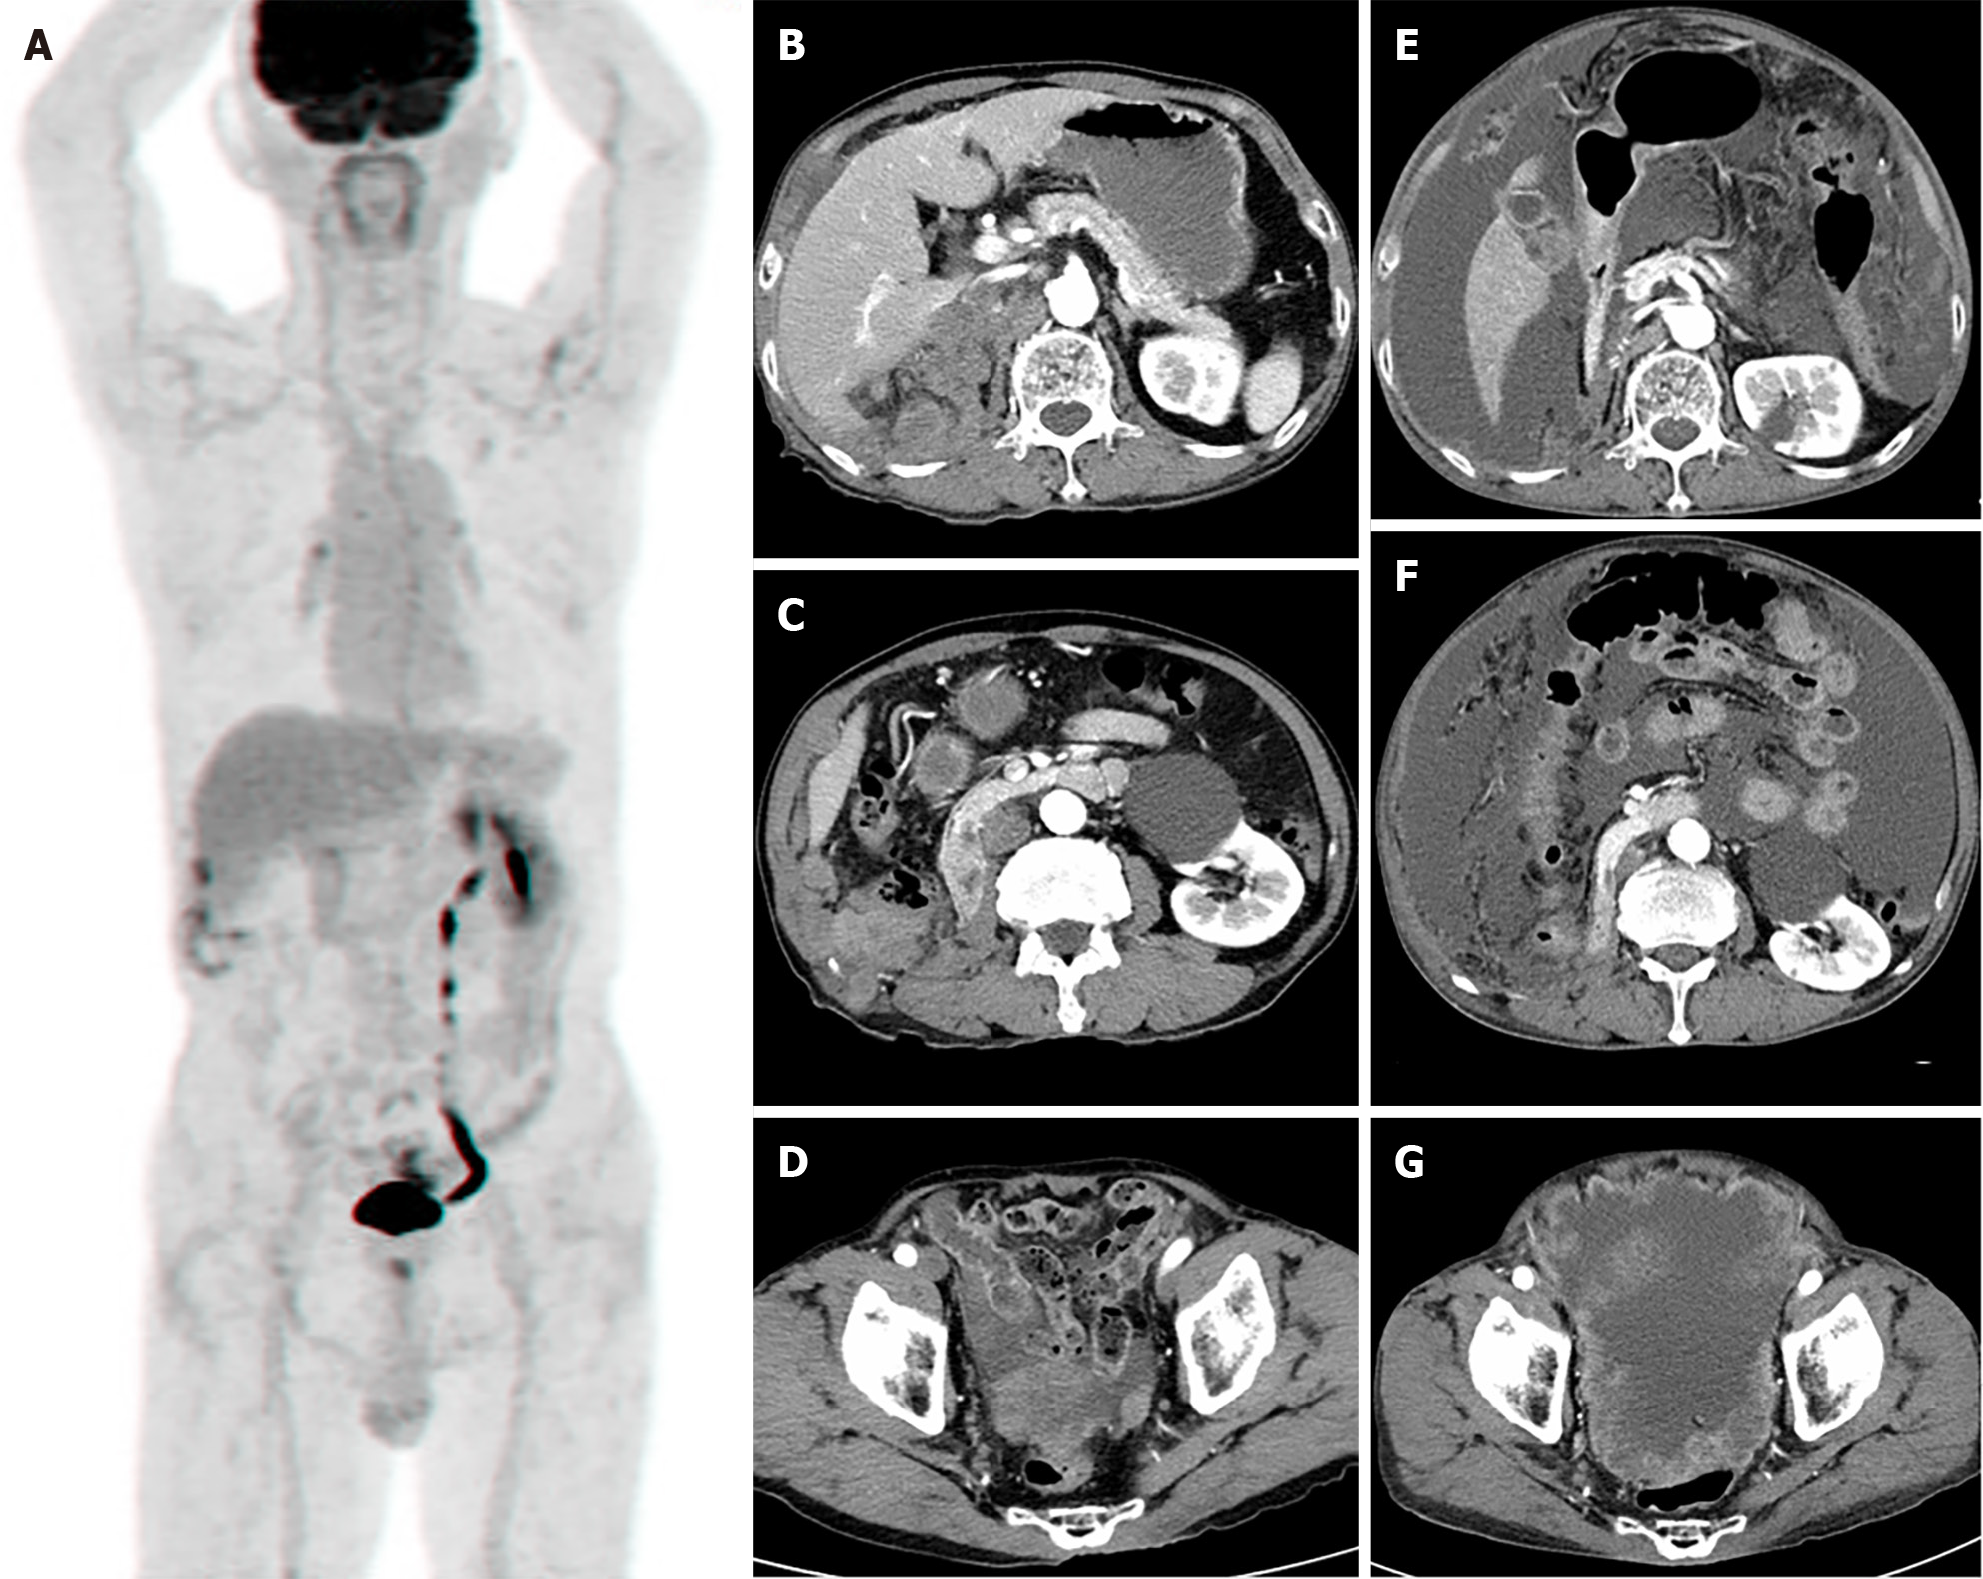
Figure 3 Immediate post-operative 18F-fluorodeoxyglucose torso positron emission tomography scan and follow up abdominal computed tomography.
A: 18F-fluorodeoxyglucose (FDG) torso positron emission tomography after right nephrectomy shows mild FDG uptake at operation site, which suggested postoperative changes. No other abnormal FDG uptake was demonstrated; B-D: Abdominal computed tomography (CT), taken 6 months after right nephrectomy, shows local recurrence and peritoneal metastasis; E-G: Abdominal CT scan, taken 8 months after right nephrectomy, shows locally controlled local recurrence result from radiotherapy but more progression of peritoneal metastasis with increased malignant ascites.
- Citation: Kim S, Park J, Ko YH, Kwon HJ. Primary Ewing sarcoma of the kidney mimicking cystic papillary renal cell carcinoma in an older patient: A case report. World J Clin Cases 2024; 12(15): 2606-2613
- URL: https://www.wjgnet.com/2307-8960/full/v12/i15/2606.htm
- DOI: https://dx.doi.org/10.12998/wjcc.v12.i15.2606


