©The Author(s) 2024.
World J Clin Cases. May 26, 2024; 12(15): 2568-2577
Published online May 26, 2024. doi: 10.12998/wjcc.v12.i15.2568
Published online May 26, 2024. doi: 10.12998/wjcc.v12.i15.2568
Figure 1 Trajectories of triceps skinfold thickness from the China Health and Nutrition Survey by latent class trajectory model.
A: Males; B: Females.
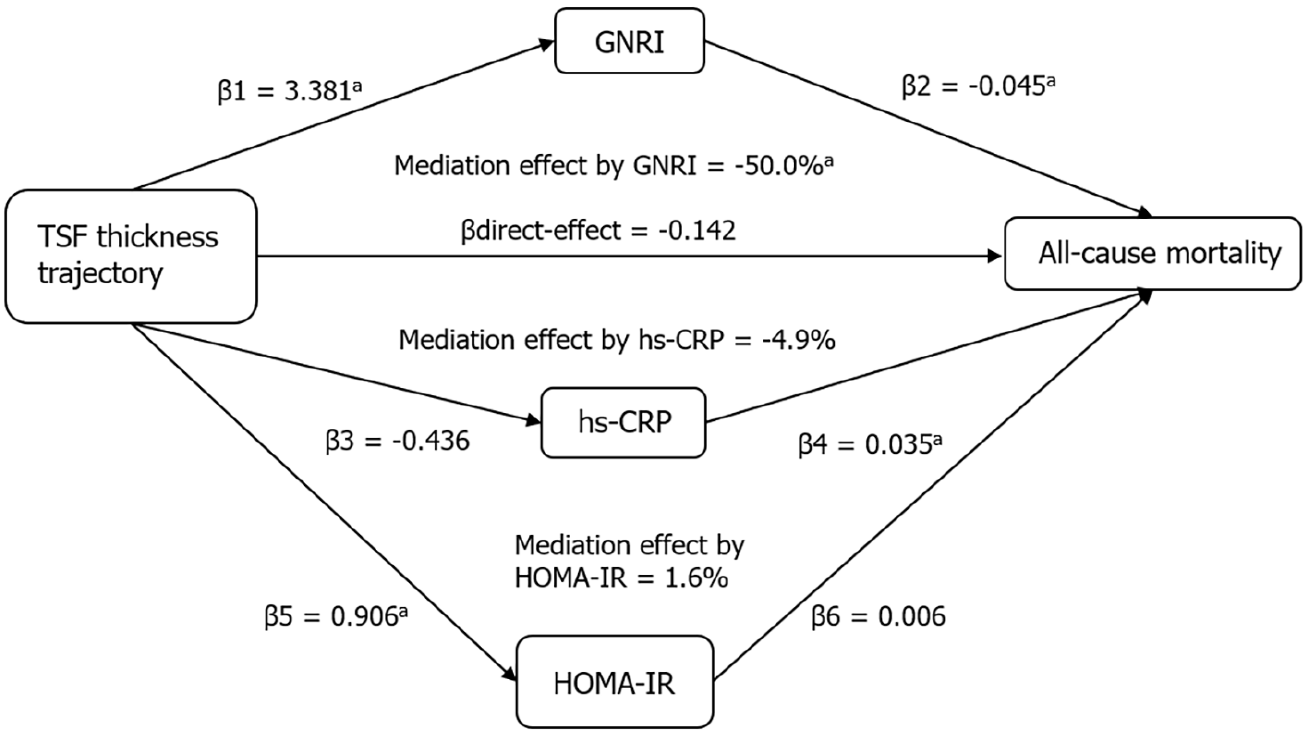
Figure 2 Mediation effects on the association between triceps skinfold thickness trajectories and risk of all-cause mortality.
aP < 0.05. GNRI: Geriatric Nutritional Risk Index; hs-CRP: High-sensitivity C-reactive protein; HOMA-IR: Homeostatic Model Assessment of Insulin Resistance; TSF: Triceps skinfold.
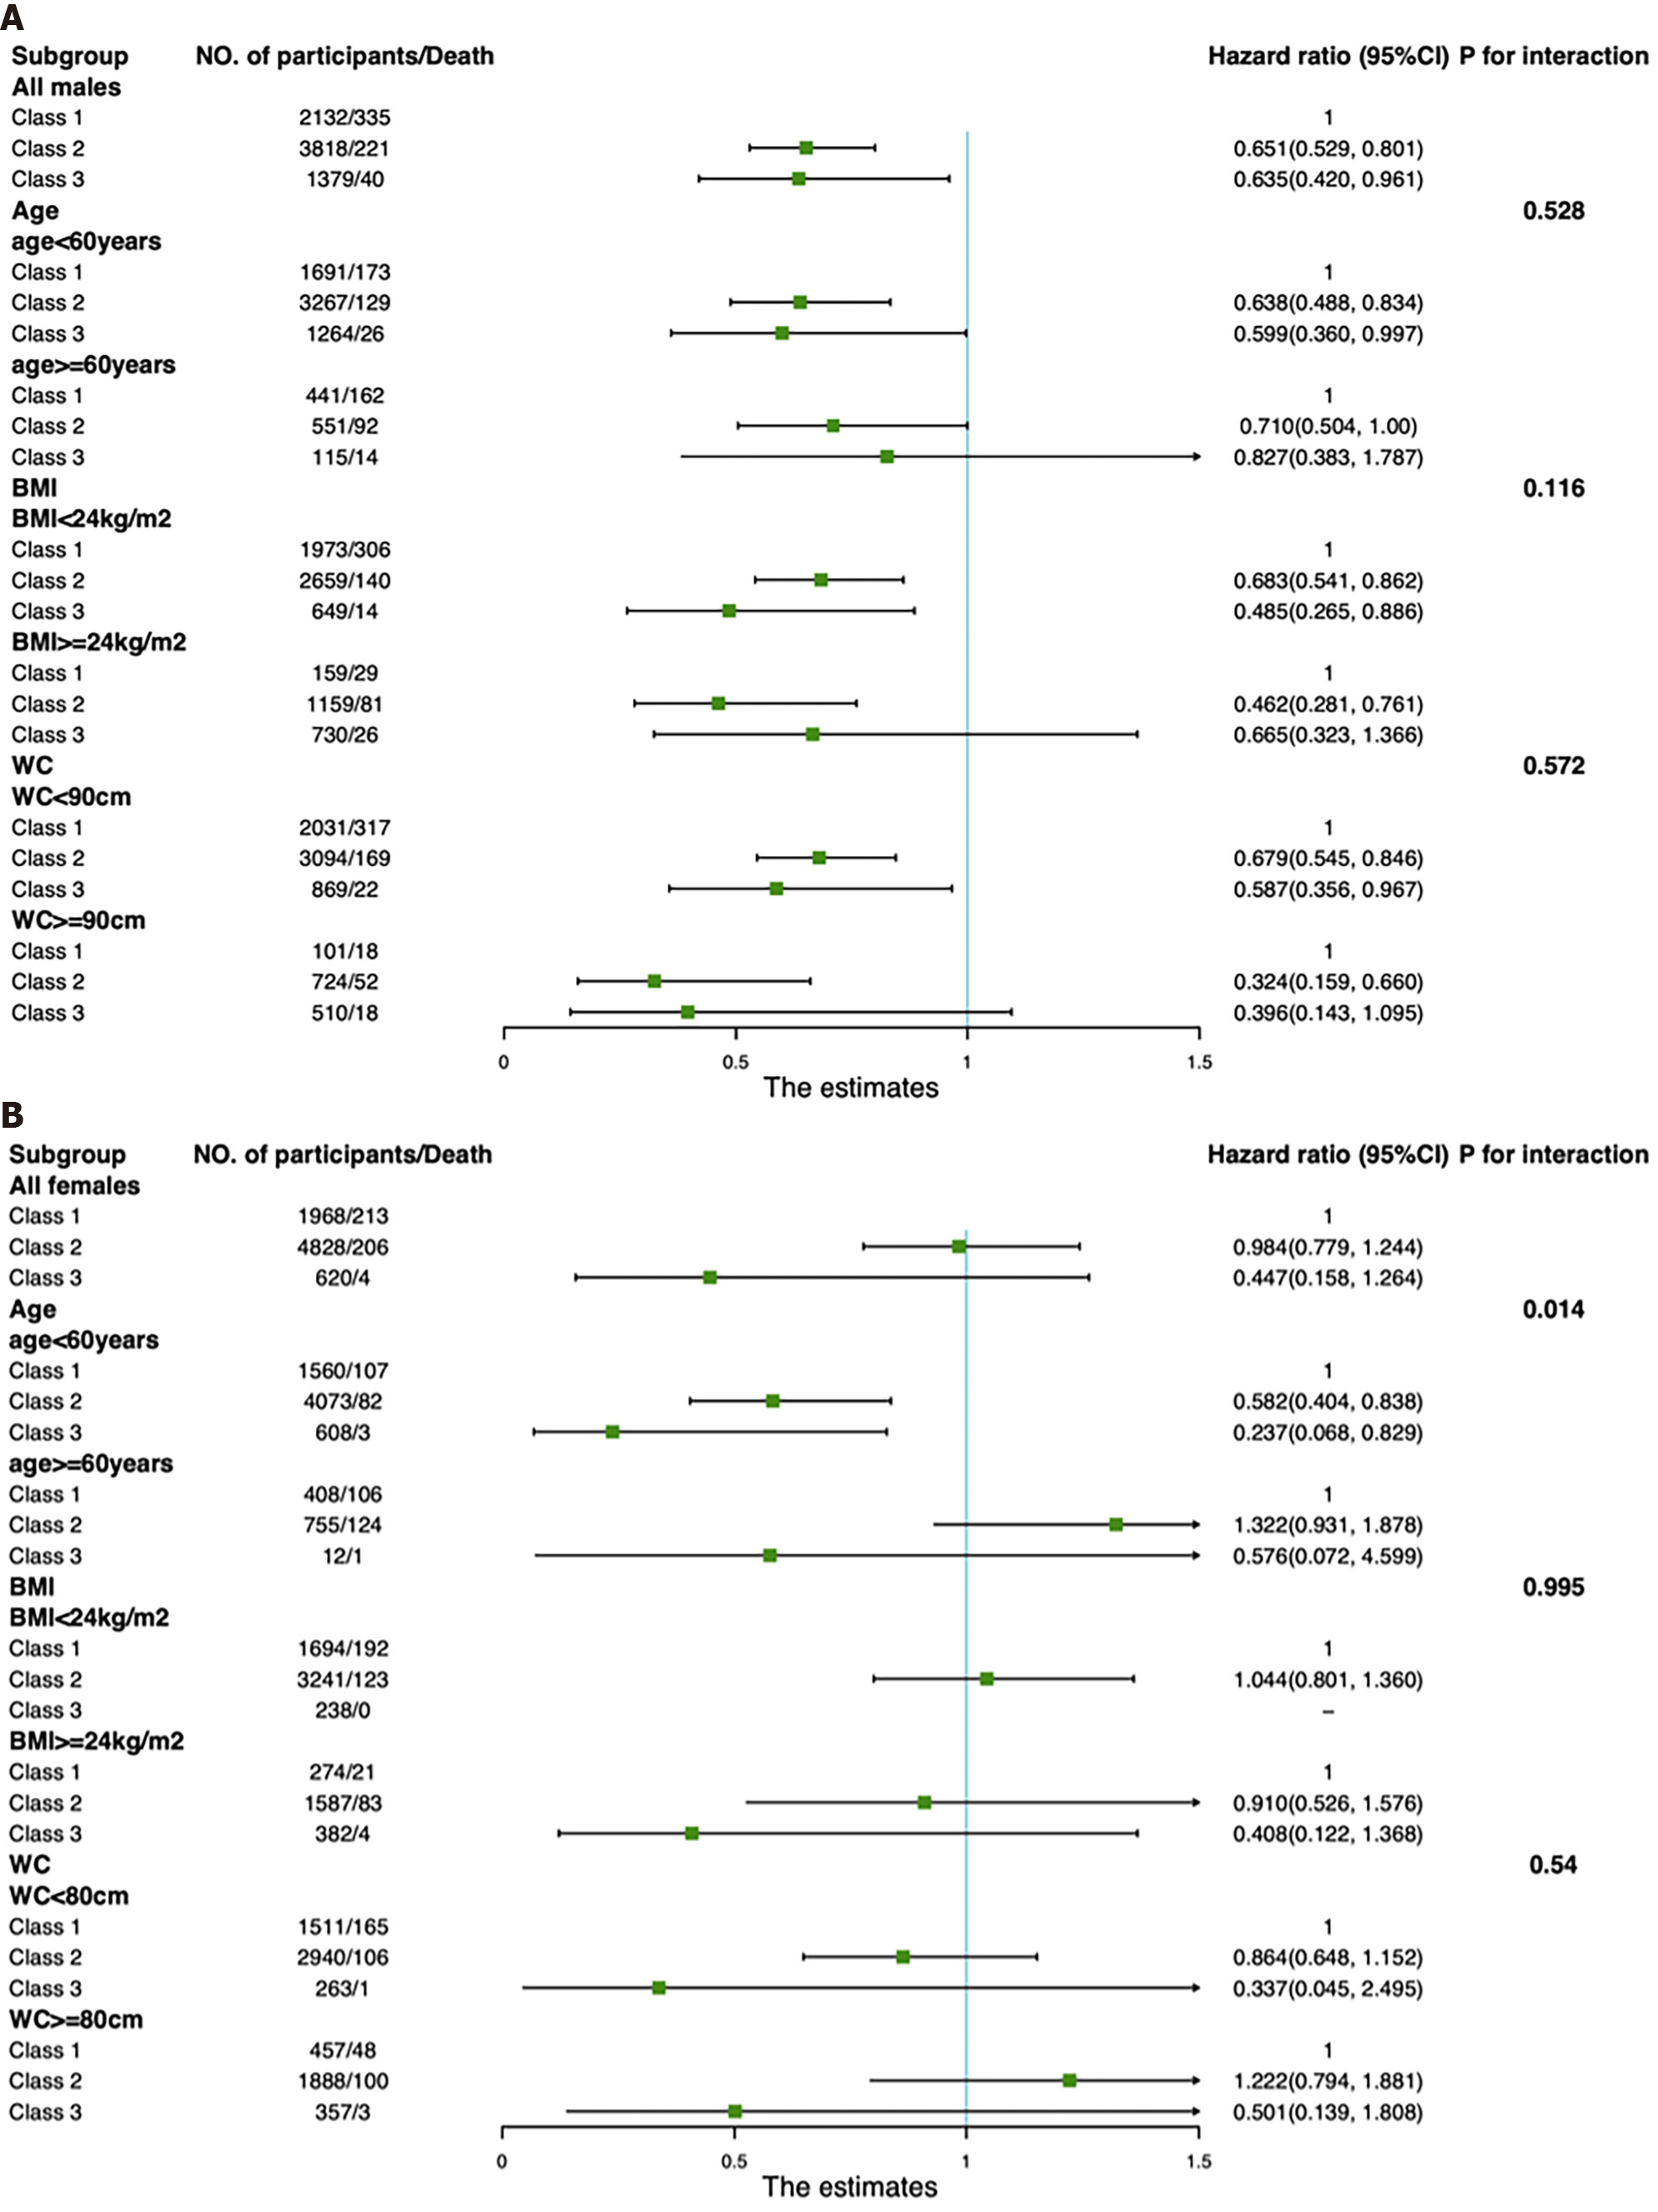
Figure 3 Association of triceps skinfold thickness trajectories with all-cause mortality stratified by age, body mass index, and waist circumference.
All models were adjusted for the cofounders in Table 1. A: Males; B: Females. 95%CI: 95% confidence interval; BMI: Body mass index; WC: Waist circumference.
- Citation: Yang N, He LY, Li ZY, Yang YC, Ping F, Xu LL, Li W, Zhang HB, Li YX. Triceps skinfold thickness trajectories and the risk of all-cause mortality: A prospective cohort study. World J Clin Cases 2024; 12(15): 2568-2577
- URL: https://www.wjgnet.com/2307-8960/full/v12/i15/2568.htm
- DOI: https://dx.doi.org/10.12998/wjcc.v12.i15.2568


