Copyright
©The Author(s) 2024.
World J Clin Cases. Apr 6, 2024; 12(10): 1750-1765
Published online Apr 6, 2024. doi: 10.12998/wjcc.v12.i10.1750
Published online Apr 6, 2024. doi: 10.12998/wjcc.v12.i10.1750
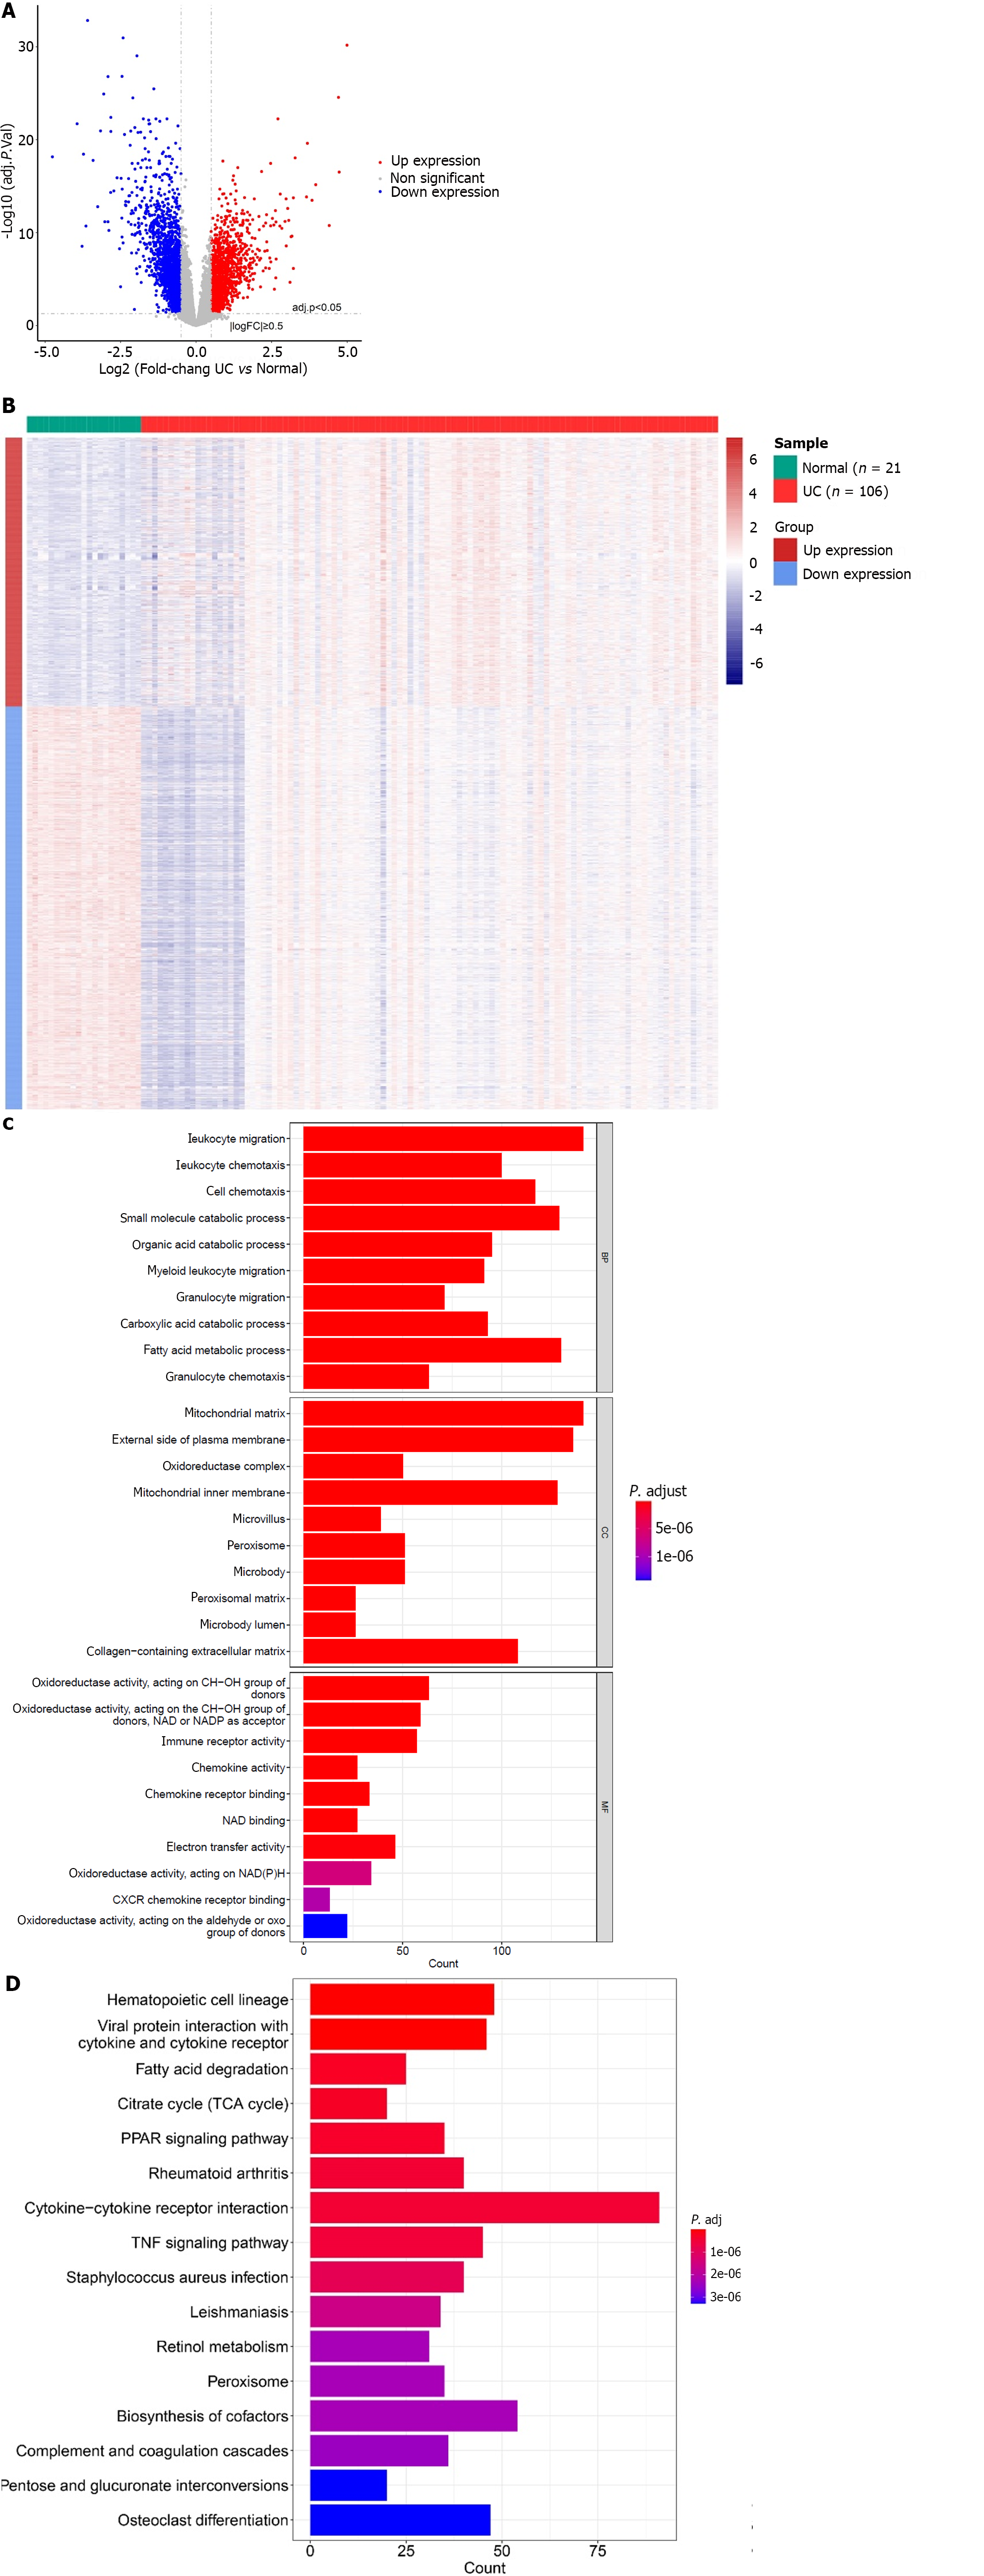
Figure 1 Analysis differentially expressed genes between the ulcerative colitis and normal groups.
A: Volcanic map of differentially expressed genes (DEGs); B: Heat map of DEGs; C: Enrichment results of Gene Ontology functional classification; D: Enrichment results of Kyoto Encyclopaedia of Genes and Genomes pathway.
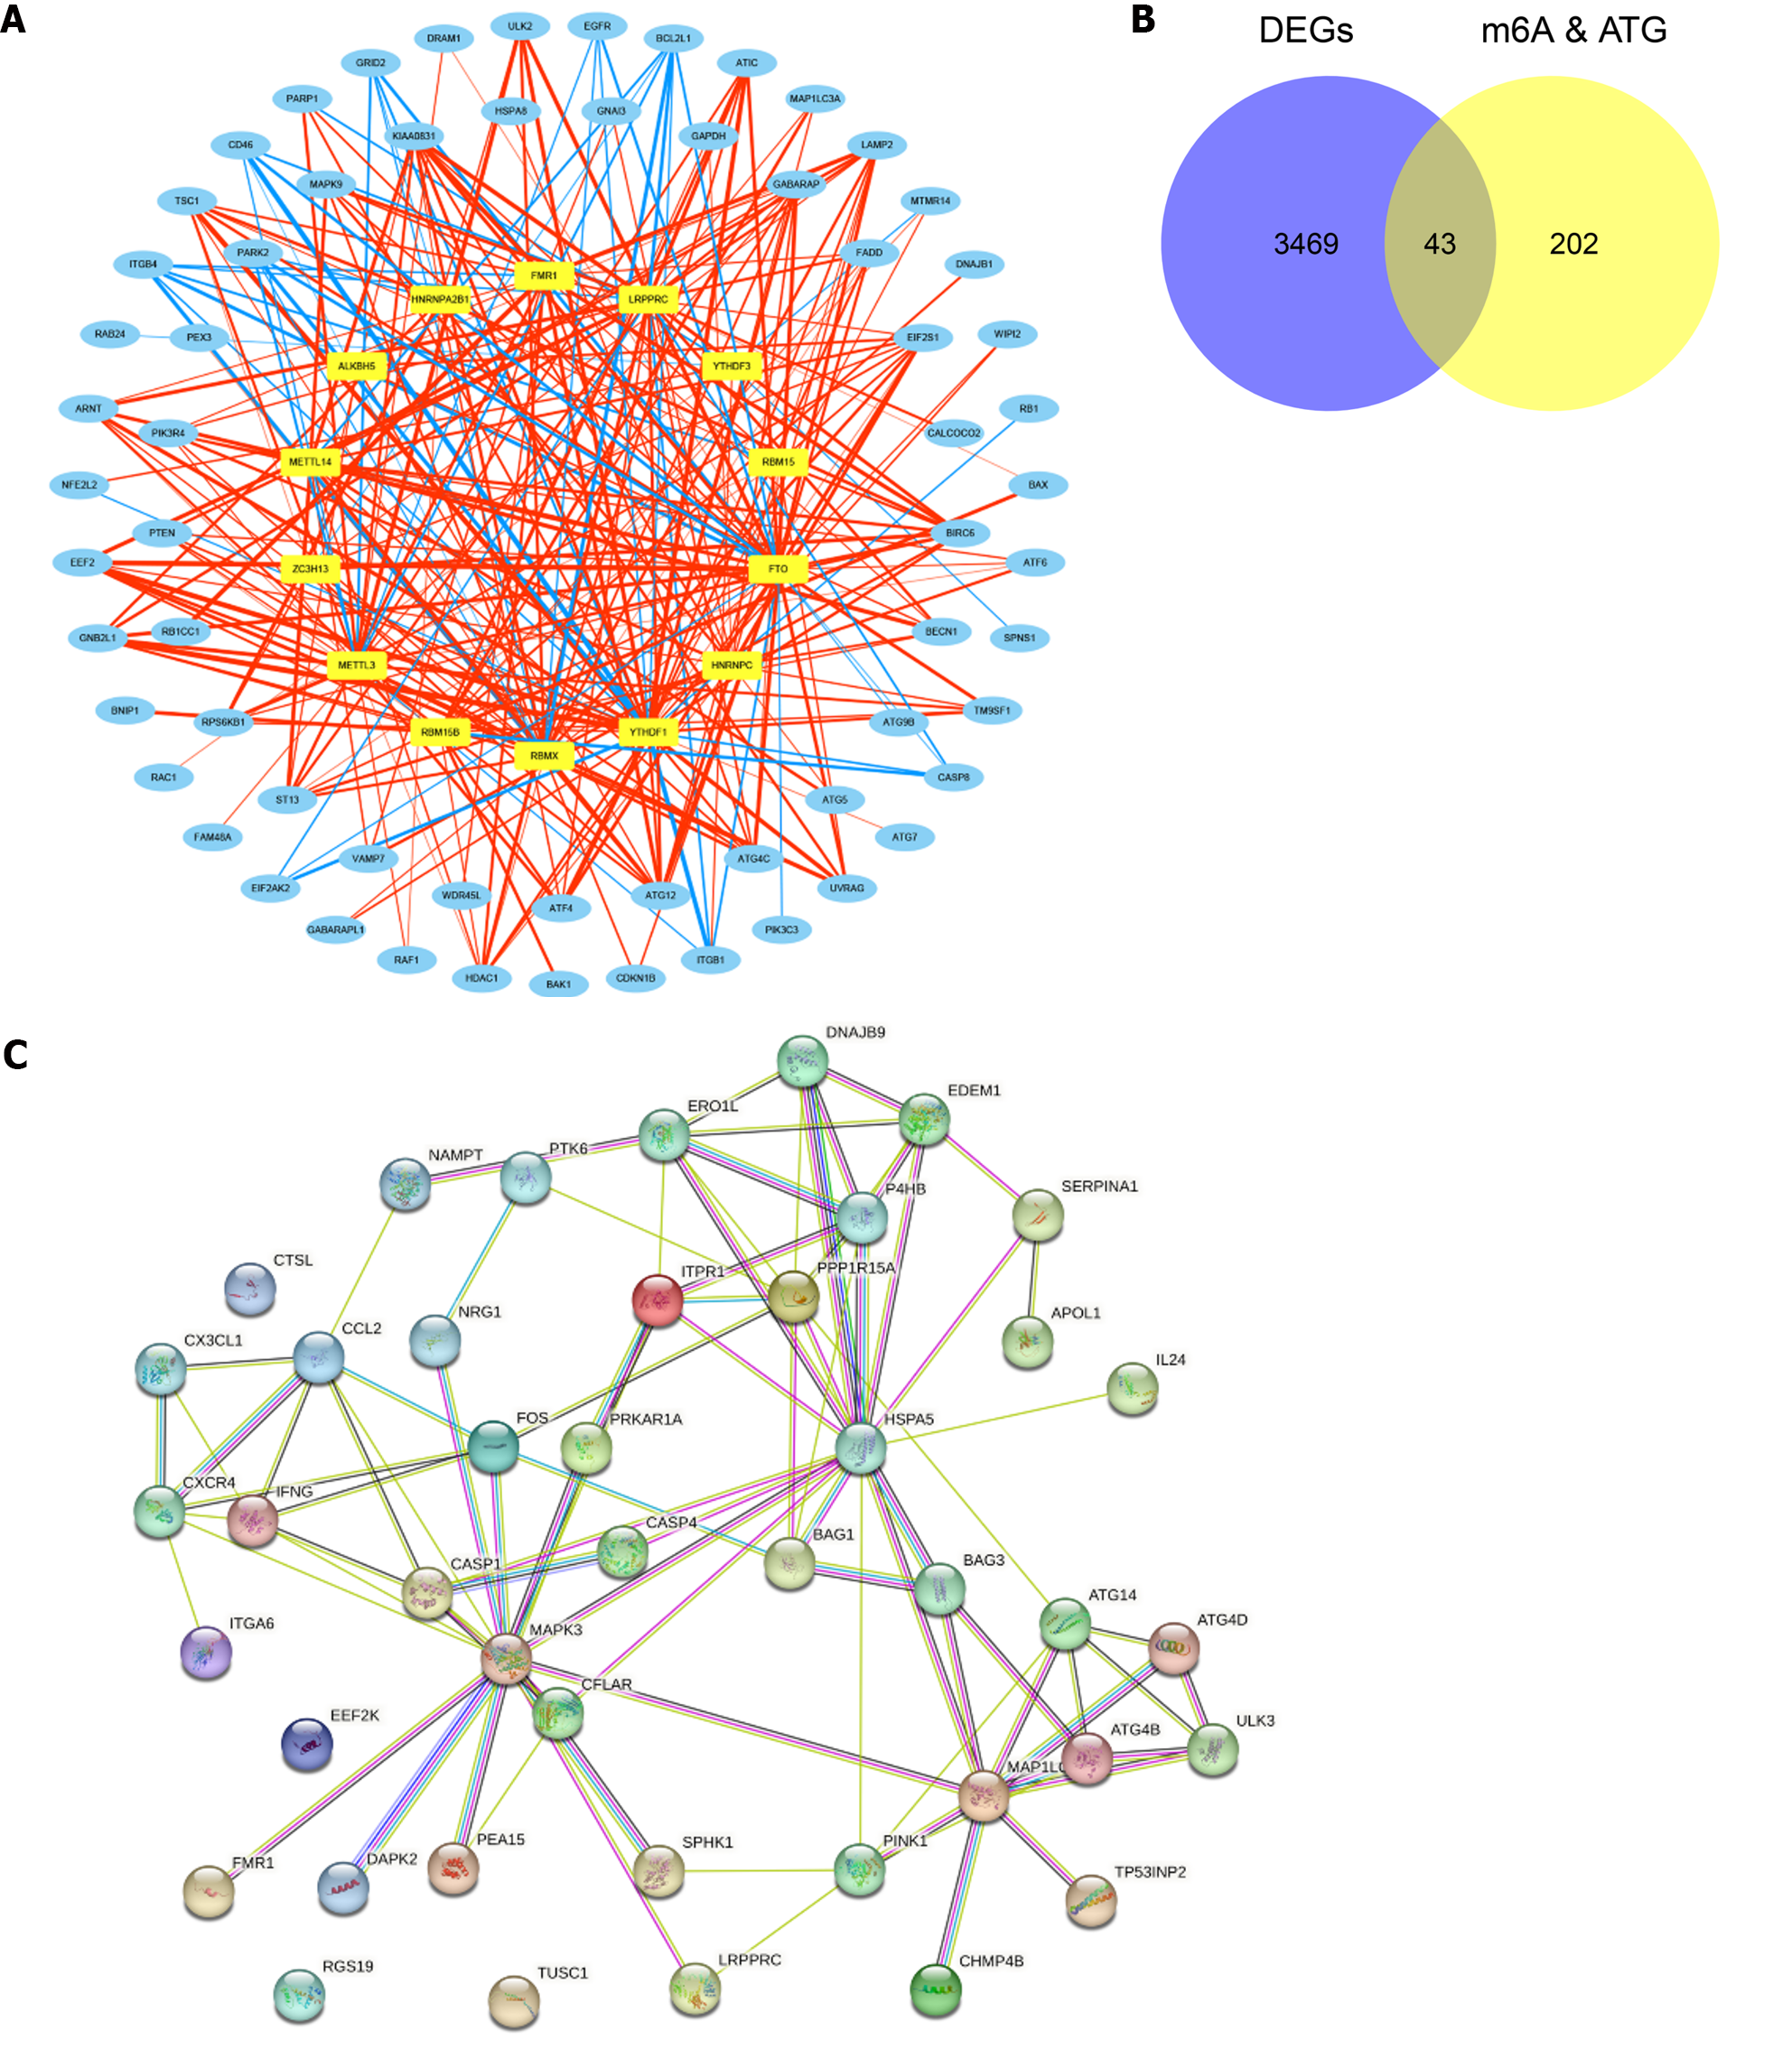
Figure 2 The protein-protein interaction network of m6A-autophagy-related differentially expressed genes.
A: N6-methyladenosine (m6A)-autophagy genes (ATG) related network; B: Venn diagrams of m6A-ATG and Differentially Expressed Genes. C: Protein-Protein Interaction network of differential m6A-Autophagy-Related Differentially Expressed Genes. DEGs: Differentially expressed genes; m6A: N6-methyladenosine; ATG: Autophagy genes.
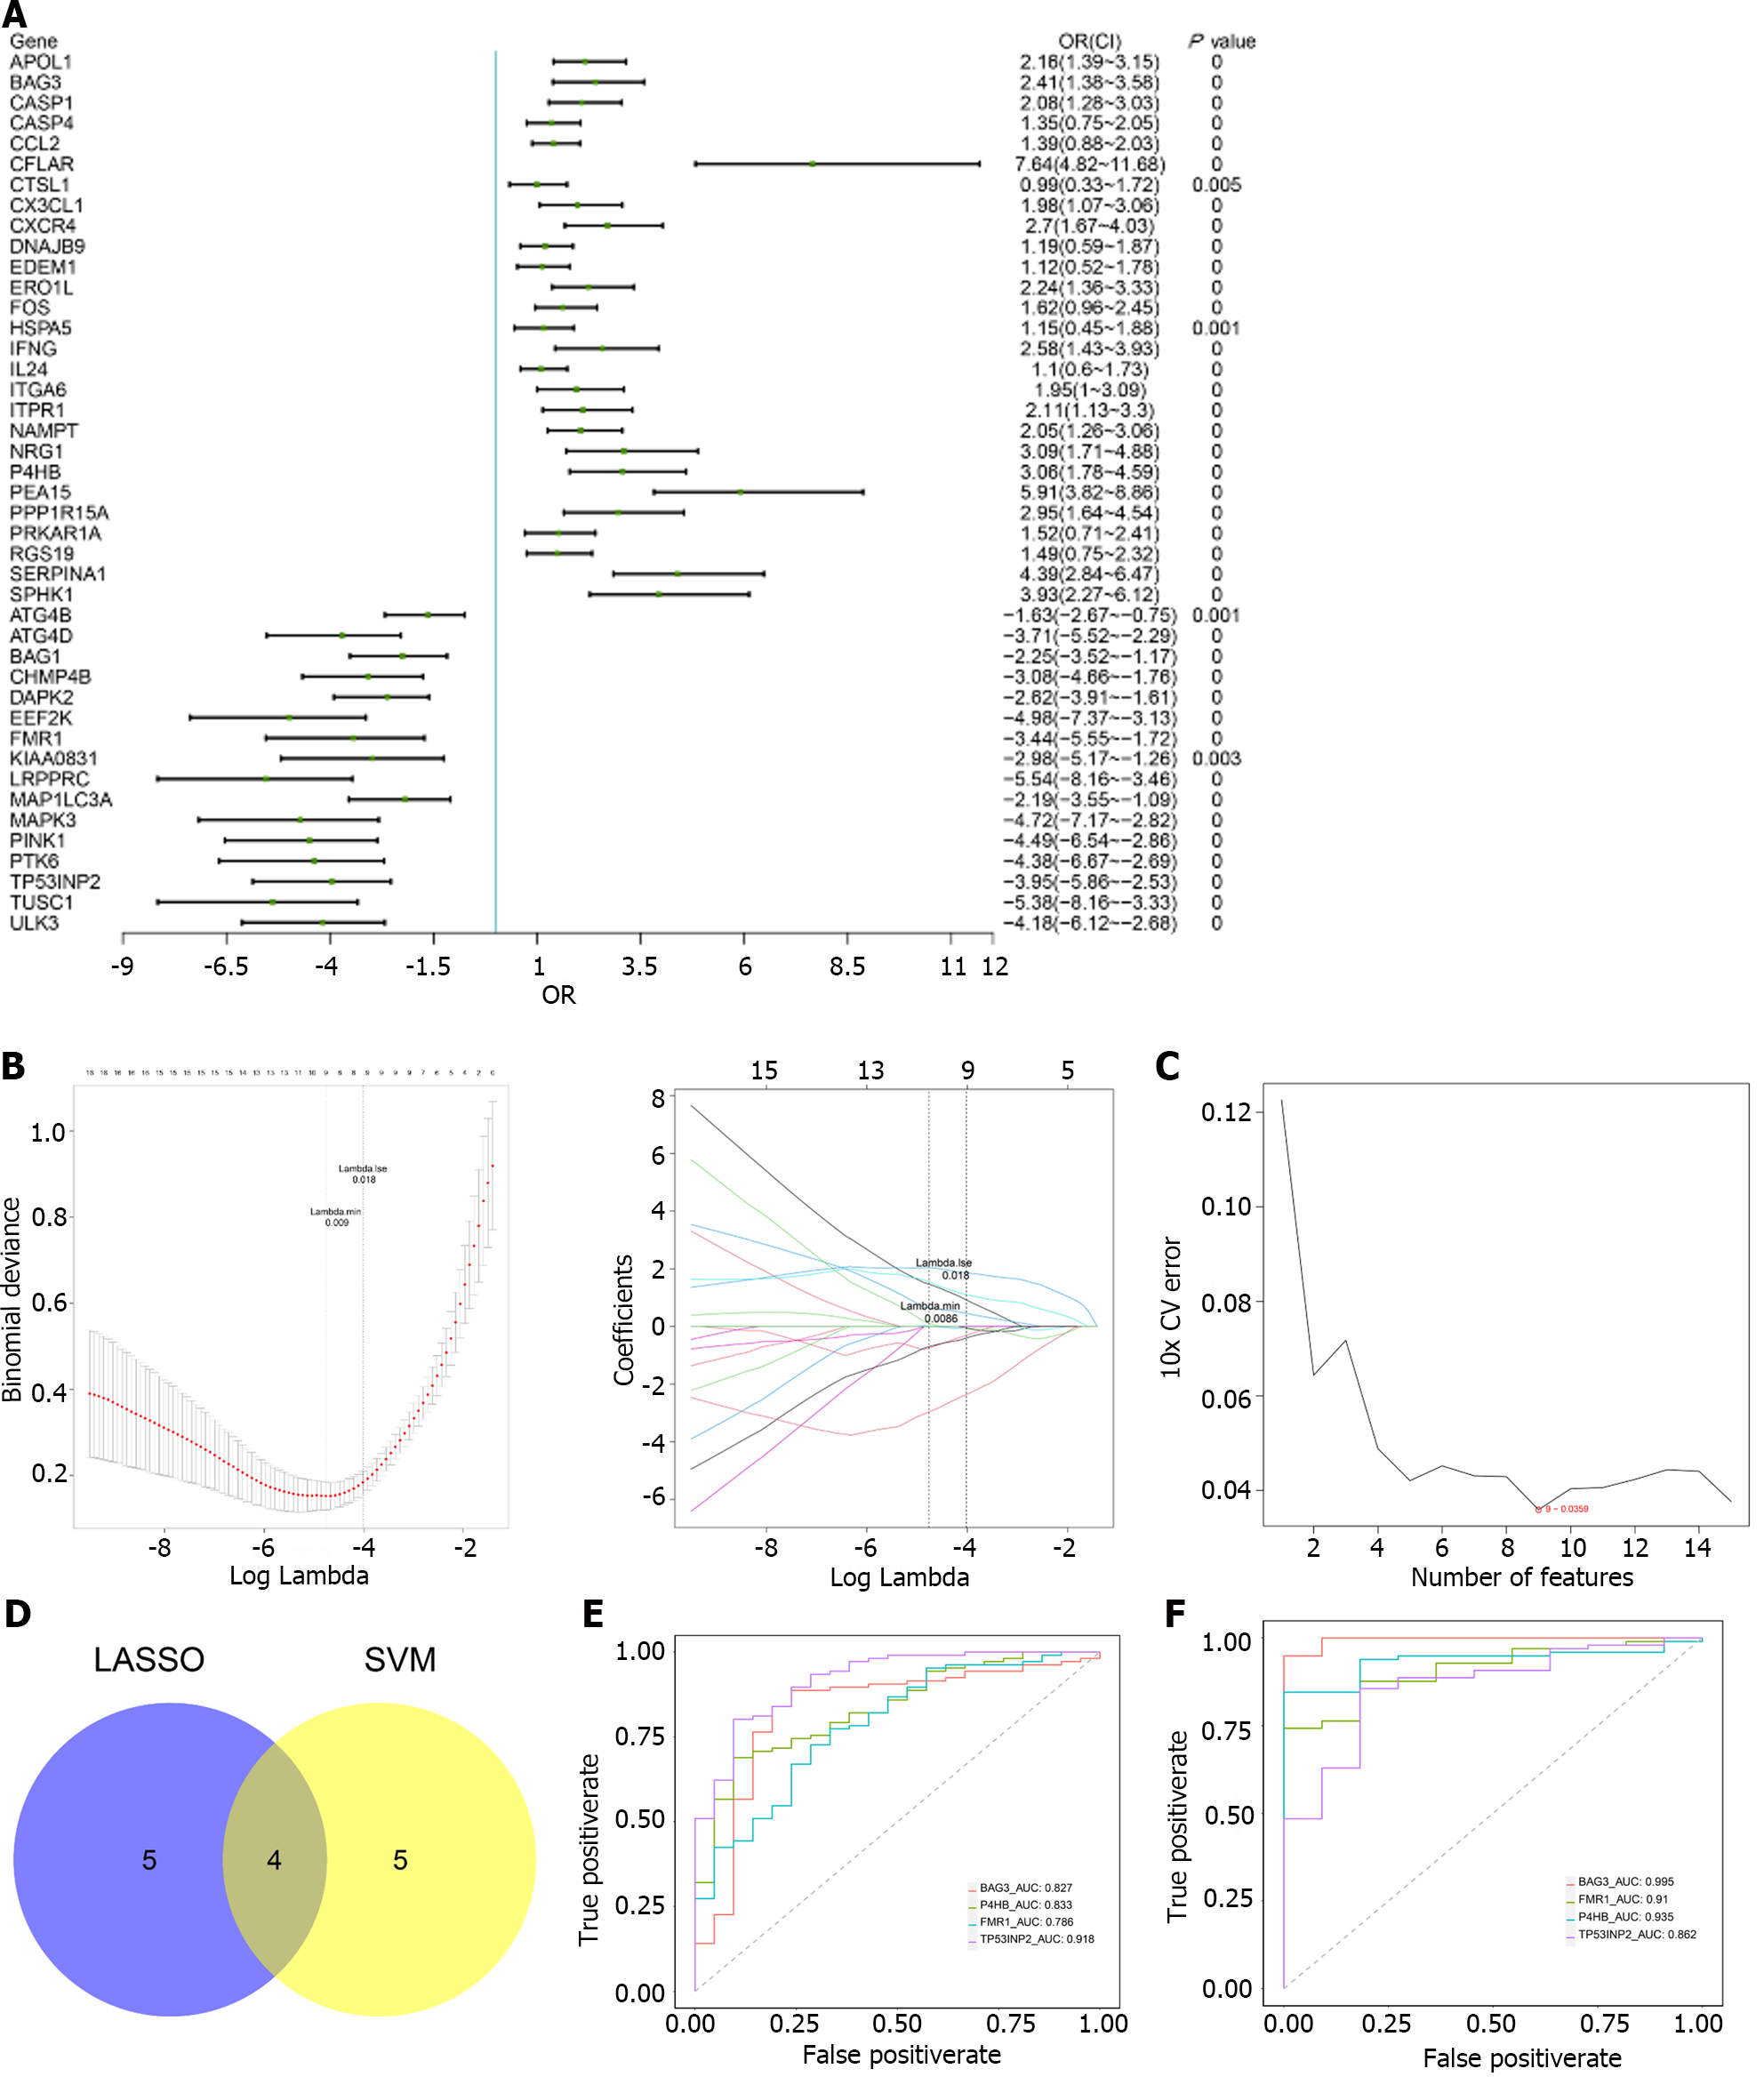
Figure 3 Analysis of characteristic genes.
A: Forest map of univariate logistic regression; B-I/II: Least absolute shrinkage and selection operator (LASSO) regression; C: Relationship between generalisation error and the characteristic number of support vector machines (SVM) algorithm; D: Venn diagram of LASSO and SVM; E: Training set: Receiver operating characteristic (ROC) curve; F: Validation set: ROC curve. LASSO: Least absolute shrinkage and selection operator; SVM: Support vector machines.
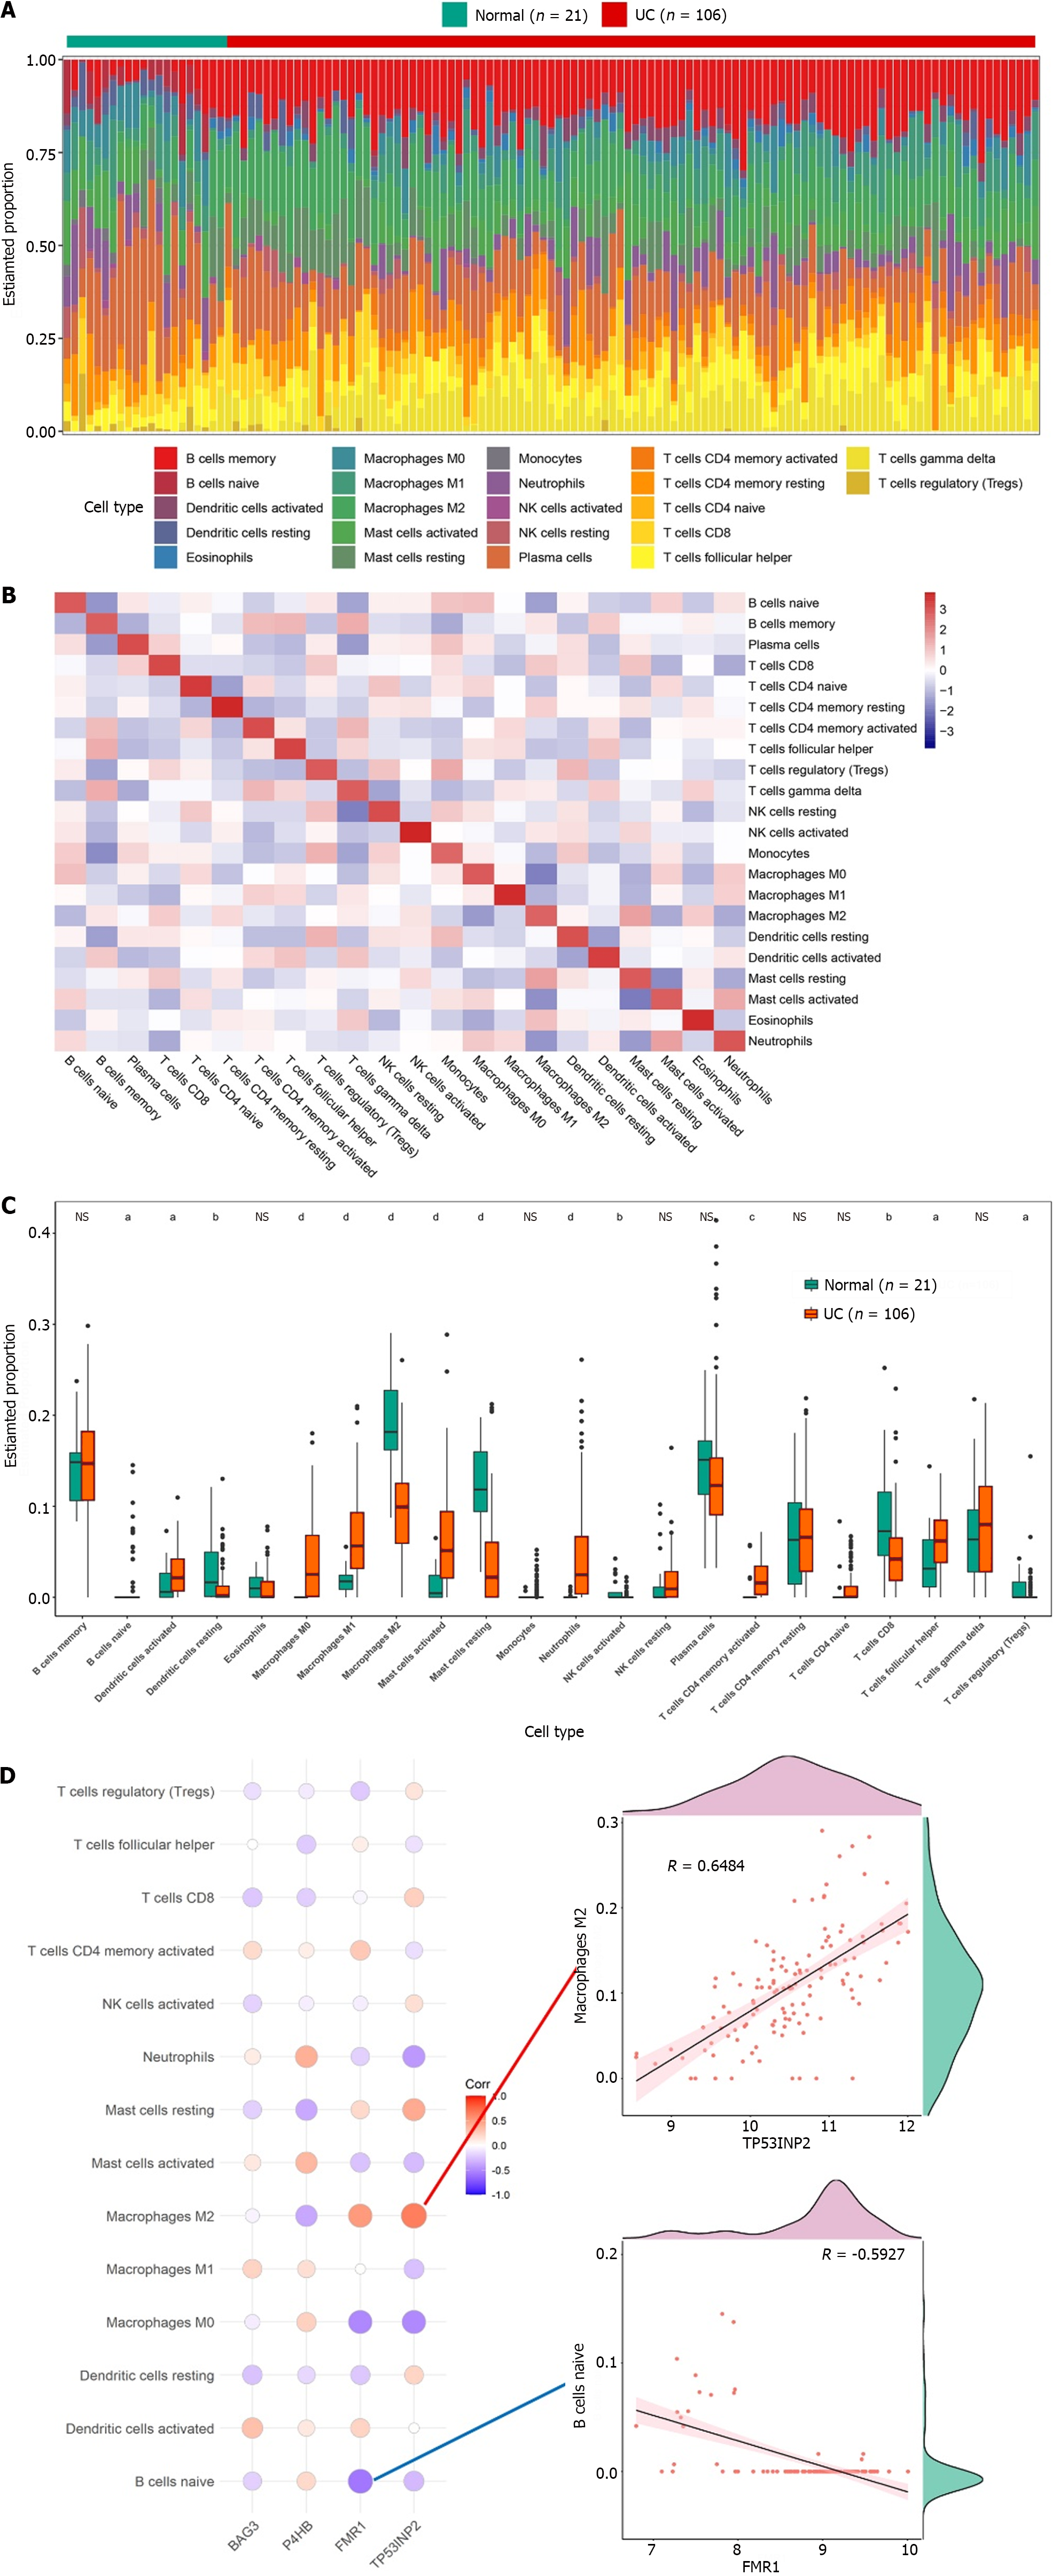
Figure 4 Immuno-infiltration analysis in the ulcerative colitis and normal groups.
A: The level of immune infiltration in each sample; B: Heat map of immune cell infiltration; C: Levels of immune cell infiltration between the groups; D: Correlation between characteristic genes and differential immune cells. aP < 0.05, bP < 0.01, cP < 0.001, dP < 0.001. NS: Not significant.
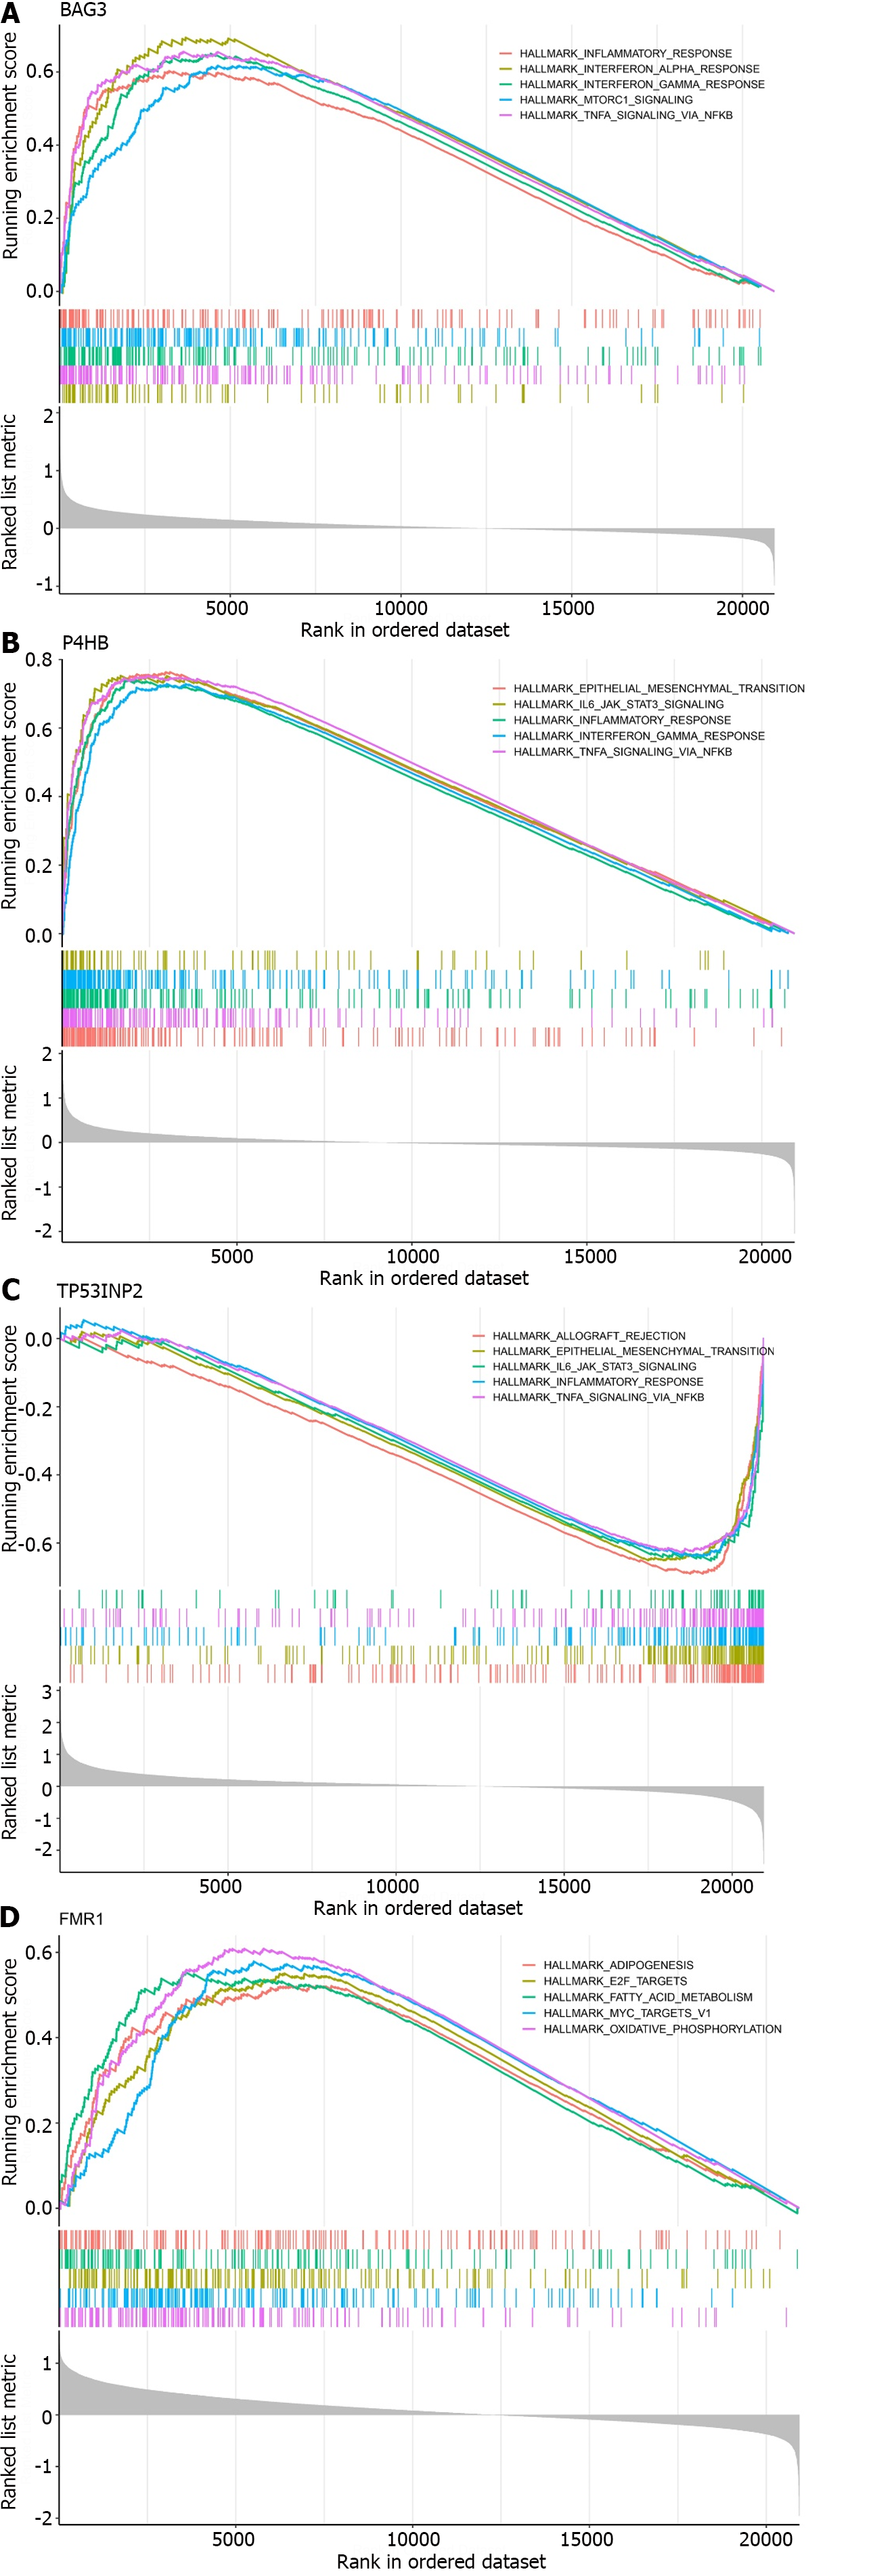
Figure 5 Gene set enrichment analysis of characteristic genes.
A: BAG3; B: P4HB; C: TP53INP2; D: FMR1.
Figure 6 The mRNA levels of characteristic genes.
A: Training set: expression of marker genes; B: Validation set: expression of marker genes. dP < 0.001.
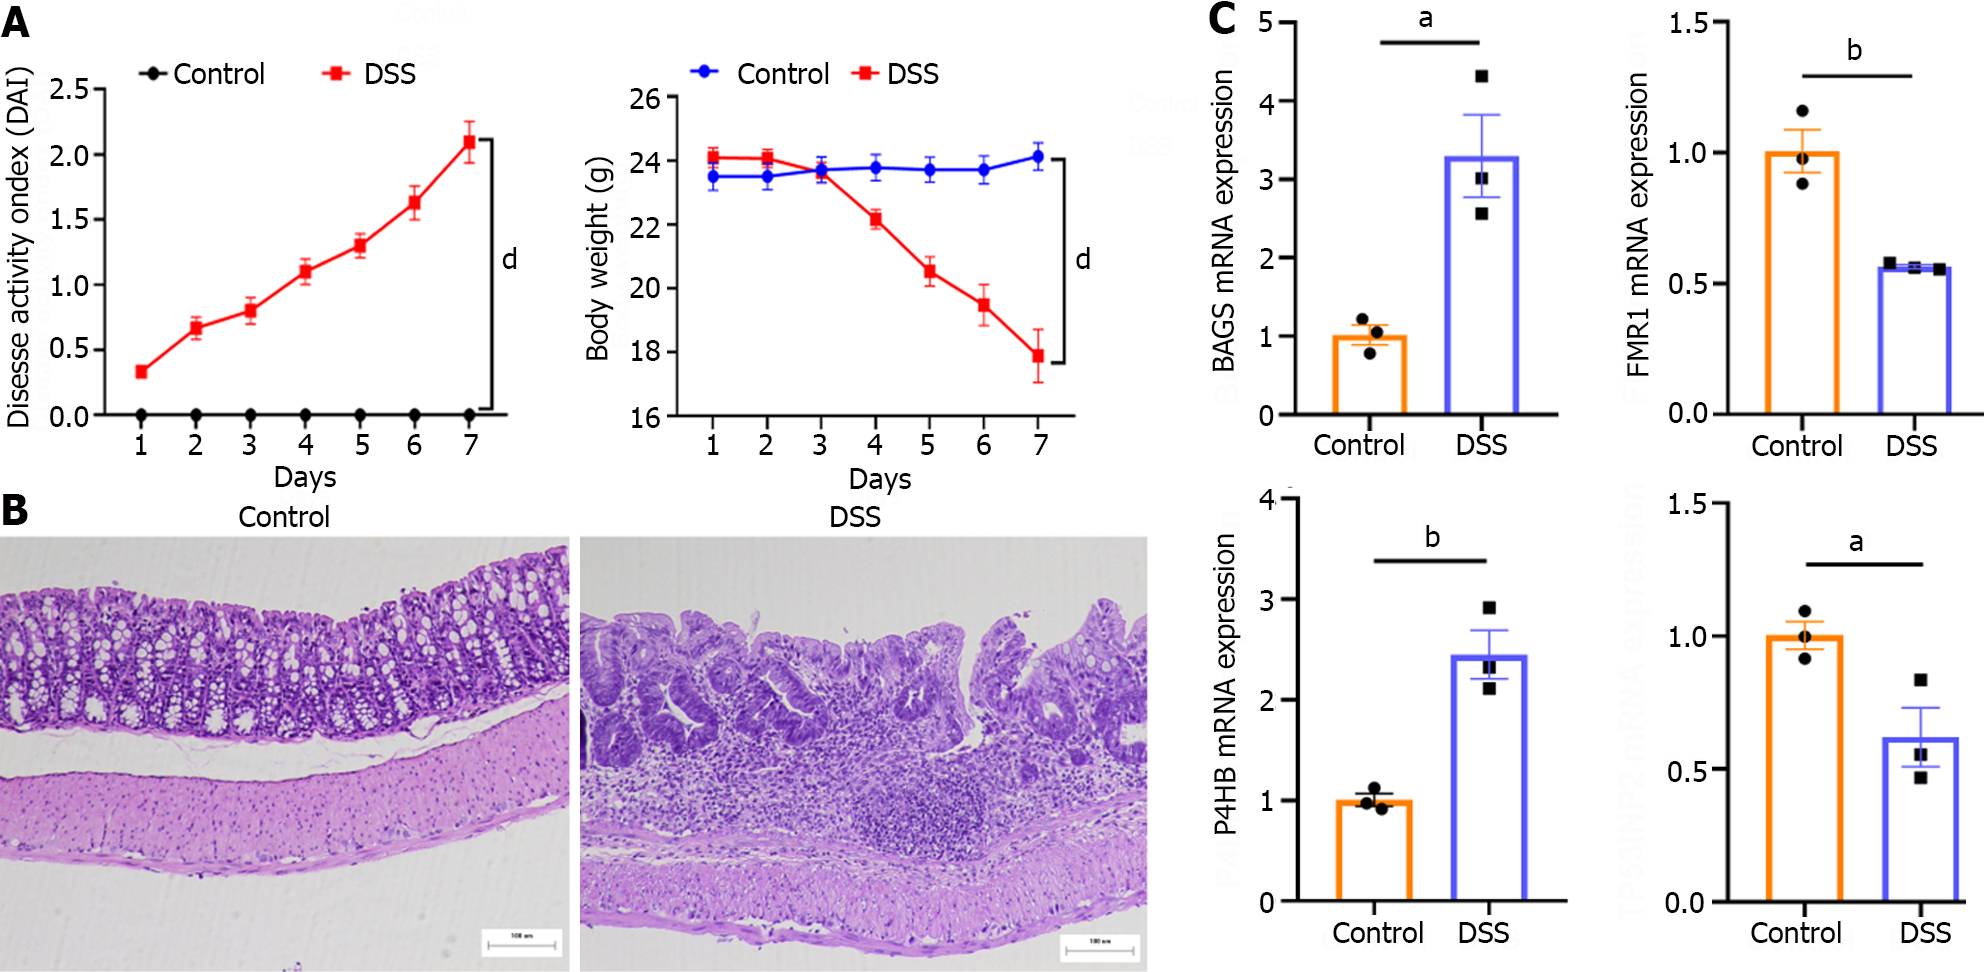
Figure 7 Validation of the animal model.
A: Disease activity index scores were recorded daily; B: H&E staining (×100); C: The relative mRNA level of characteristic genes. The relative mRNA level was detected using qPCR in Dextran sulfate sodium-induced colitis mice. Data are shown as the mean ± SEM. aP < 0.05, bP < 0.01, cP < 0.001, dP < 0.001. DSS: Dextran sulfate sodium.
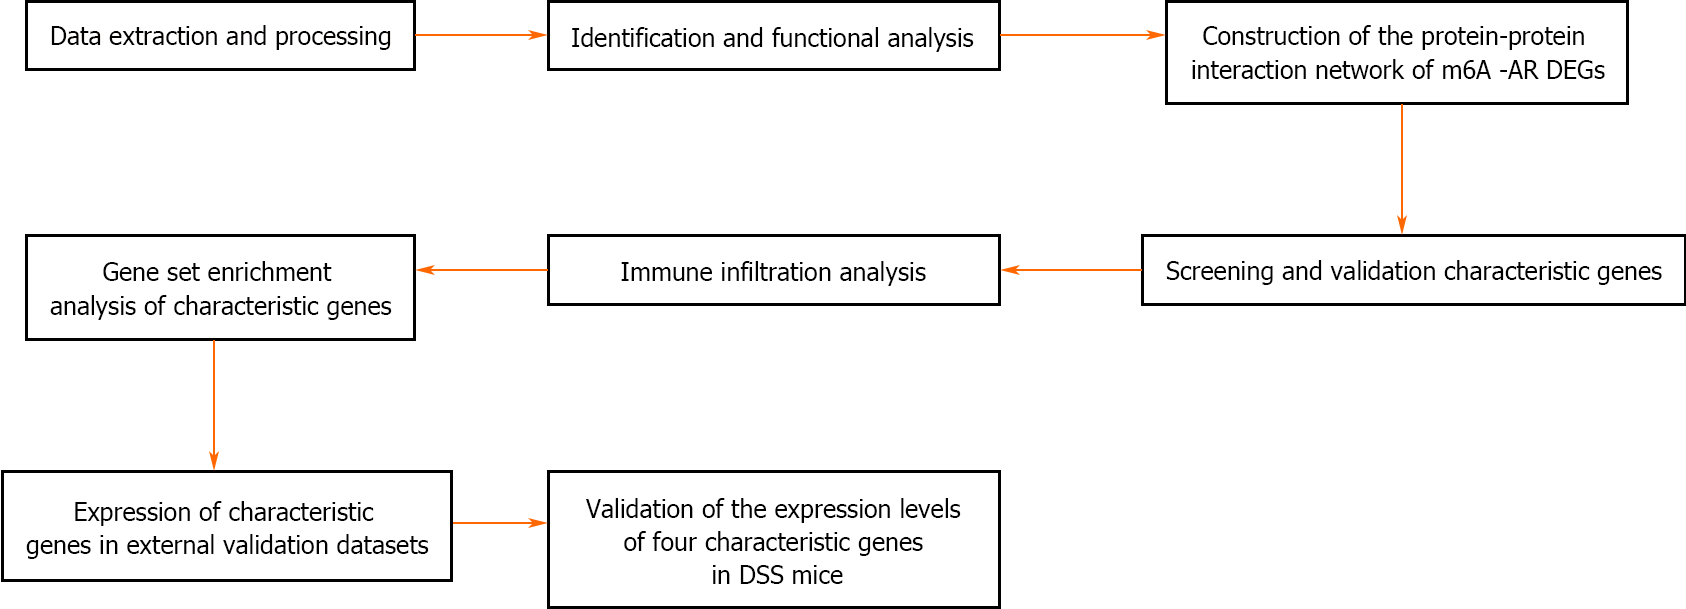
Figure 8 Flowchart of the research.
DEGs: Differentially expressed genes; m6A: N6-methyladenosine; DSS: Dextran sulfate sodium.
- Citation: Liu XY, Qiao D, Zhang YL, Liu ZX, Chen YL, Que RY, Cao HY, Dai YC. Identification of marker genes associated with N6-methyladenosine and autophagy in ulcerative colitis. World J Clin Cases 2024; 12(10): 1750-1765
- URL: https://www.wjgnet.com/2307-8960/full/v12/i10/1750.htm
- DOI: https://dx.doi.org/10.12998/wjcc.v12.i10.1750


