Copyright
©The Author(s) 2023.
World J Clin Cases. Feb 6, 2023; 11(4): 738-755
Published online Feb 6, 2023. doi: 10.12998/wjcc.v11.i4.738
Published online Feb 6, 2023. doi: 10.12998/wjcc.v11.i4.738
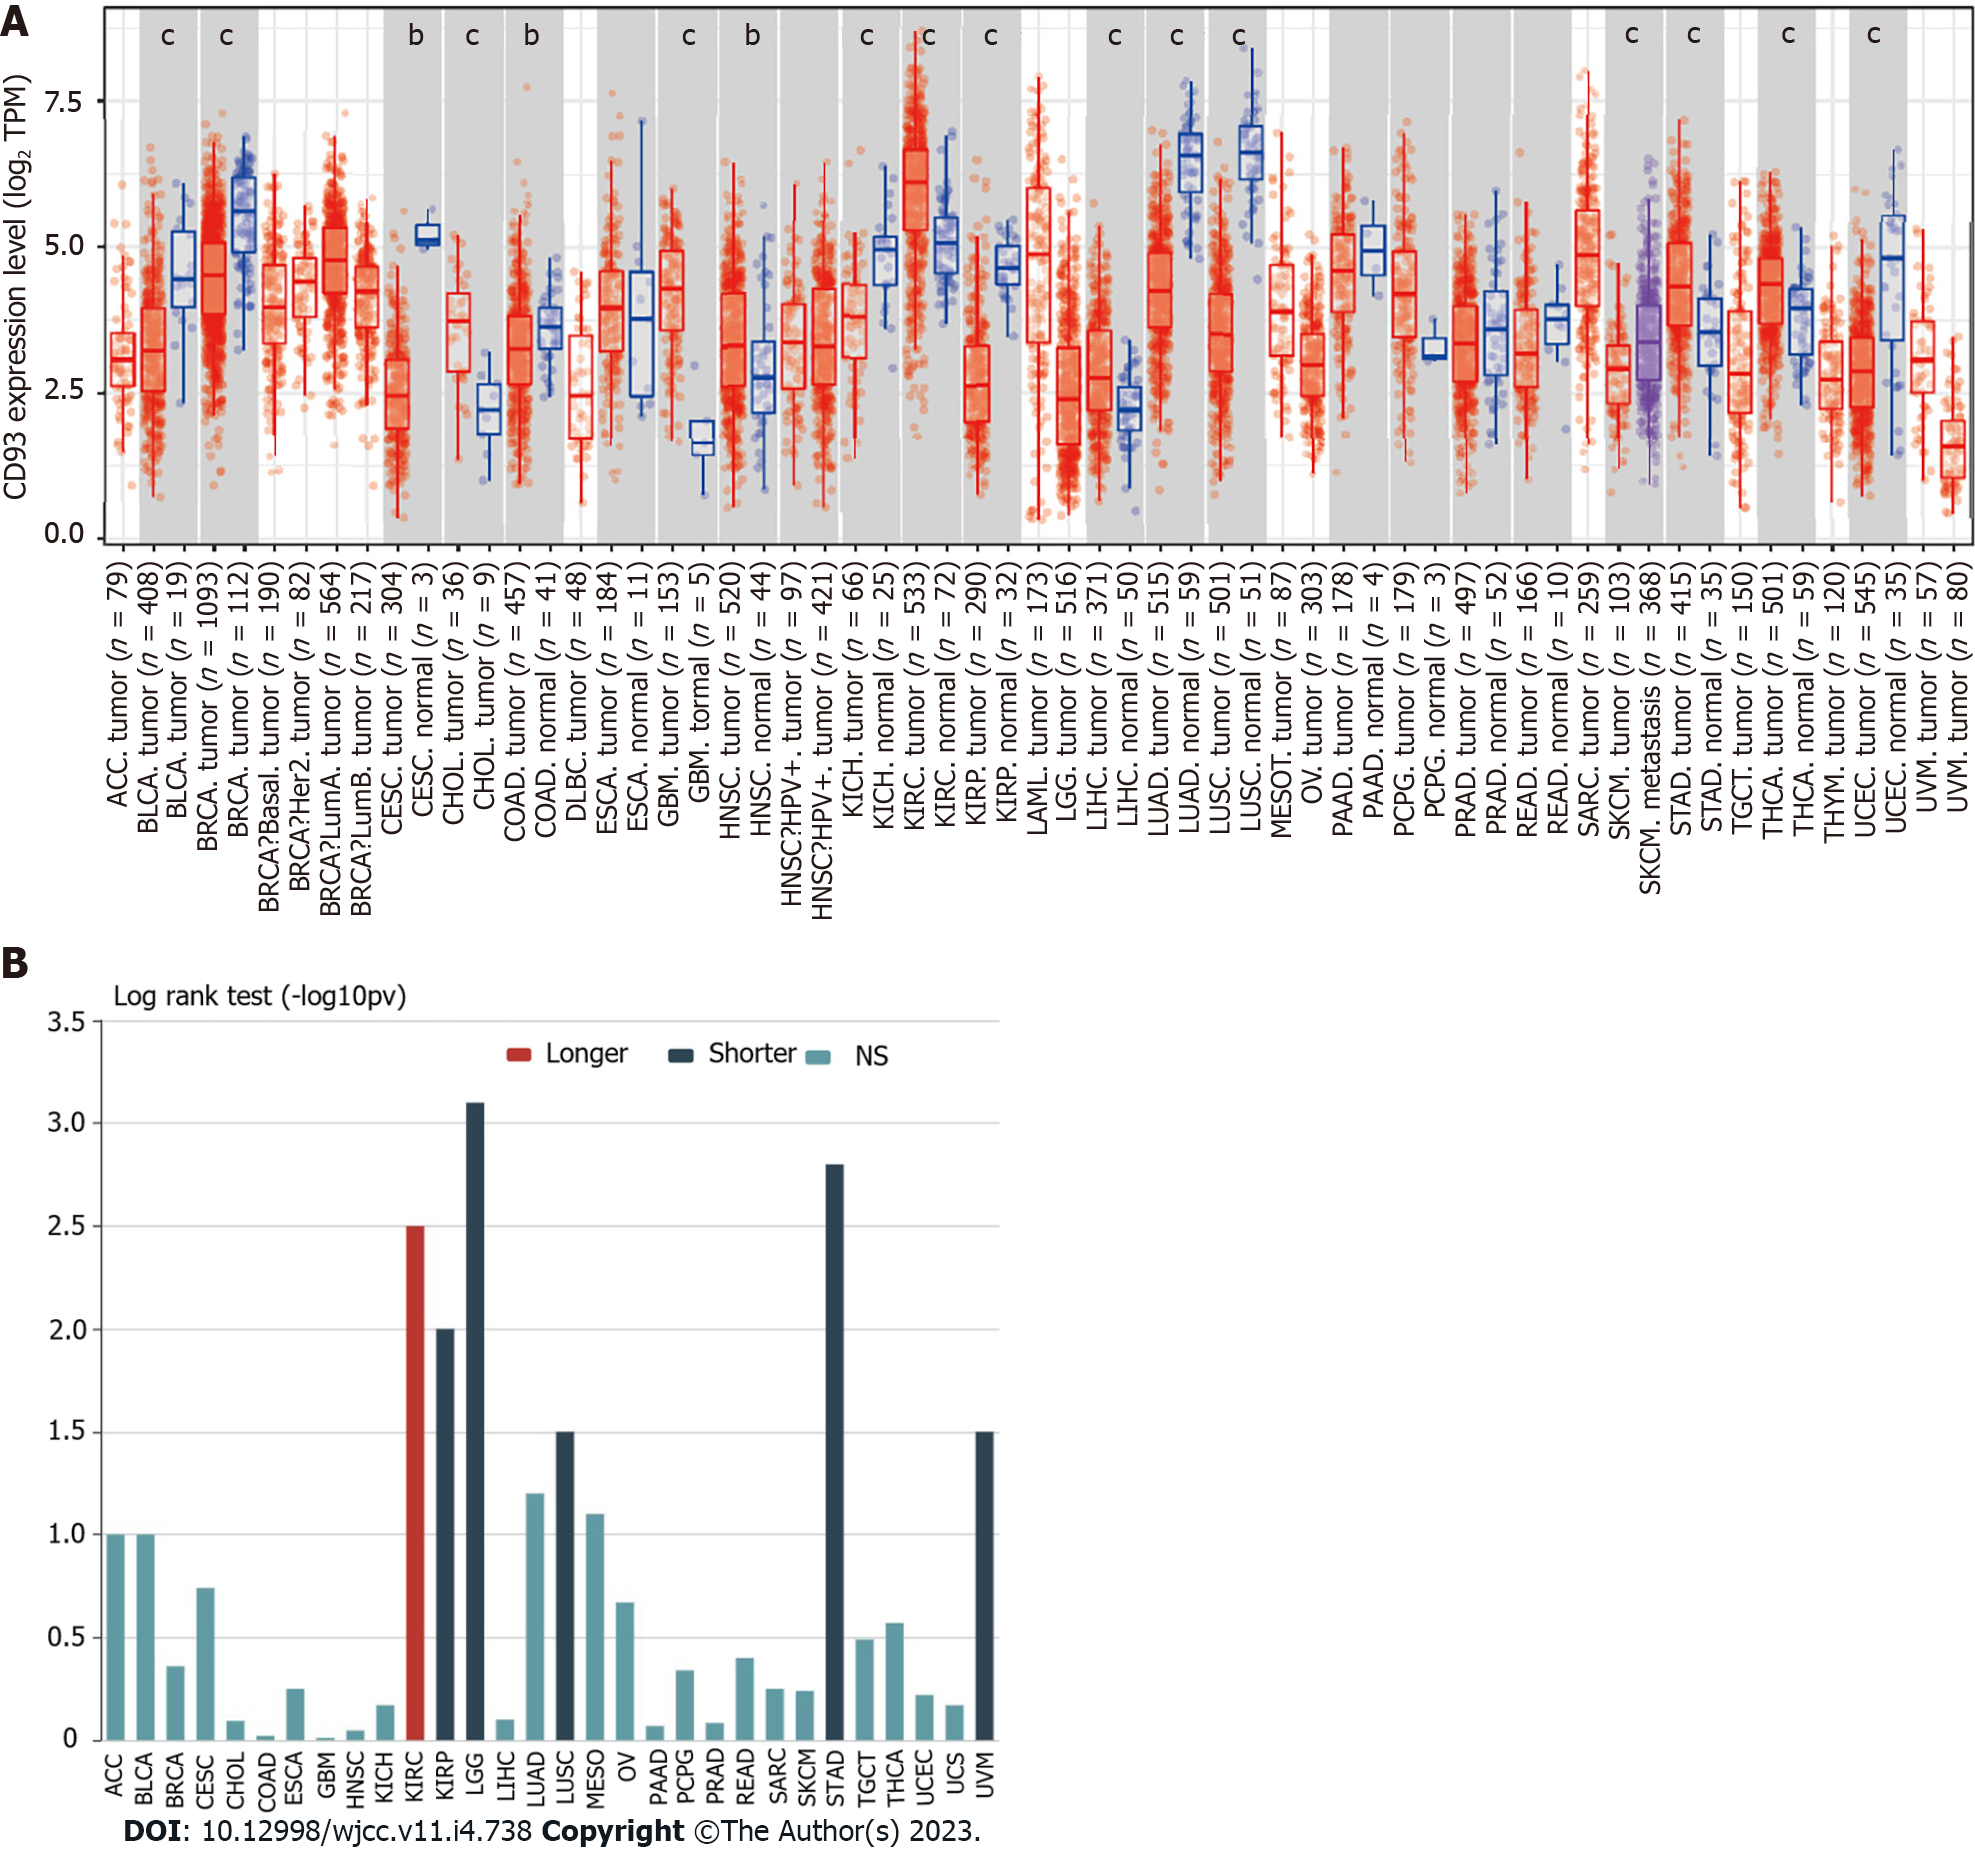
Figure 1 Pan-cancer analysis of CD93.
A: Differential expression of CD93 between normal and tumor tissues in pan-cancer based on the TIMER2.0; B: Associations between CD93 expression and overall survival in pan-cancer. The P values are labeled as aP < 0.05, bP < 0.01, cP < 0.001.
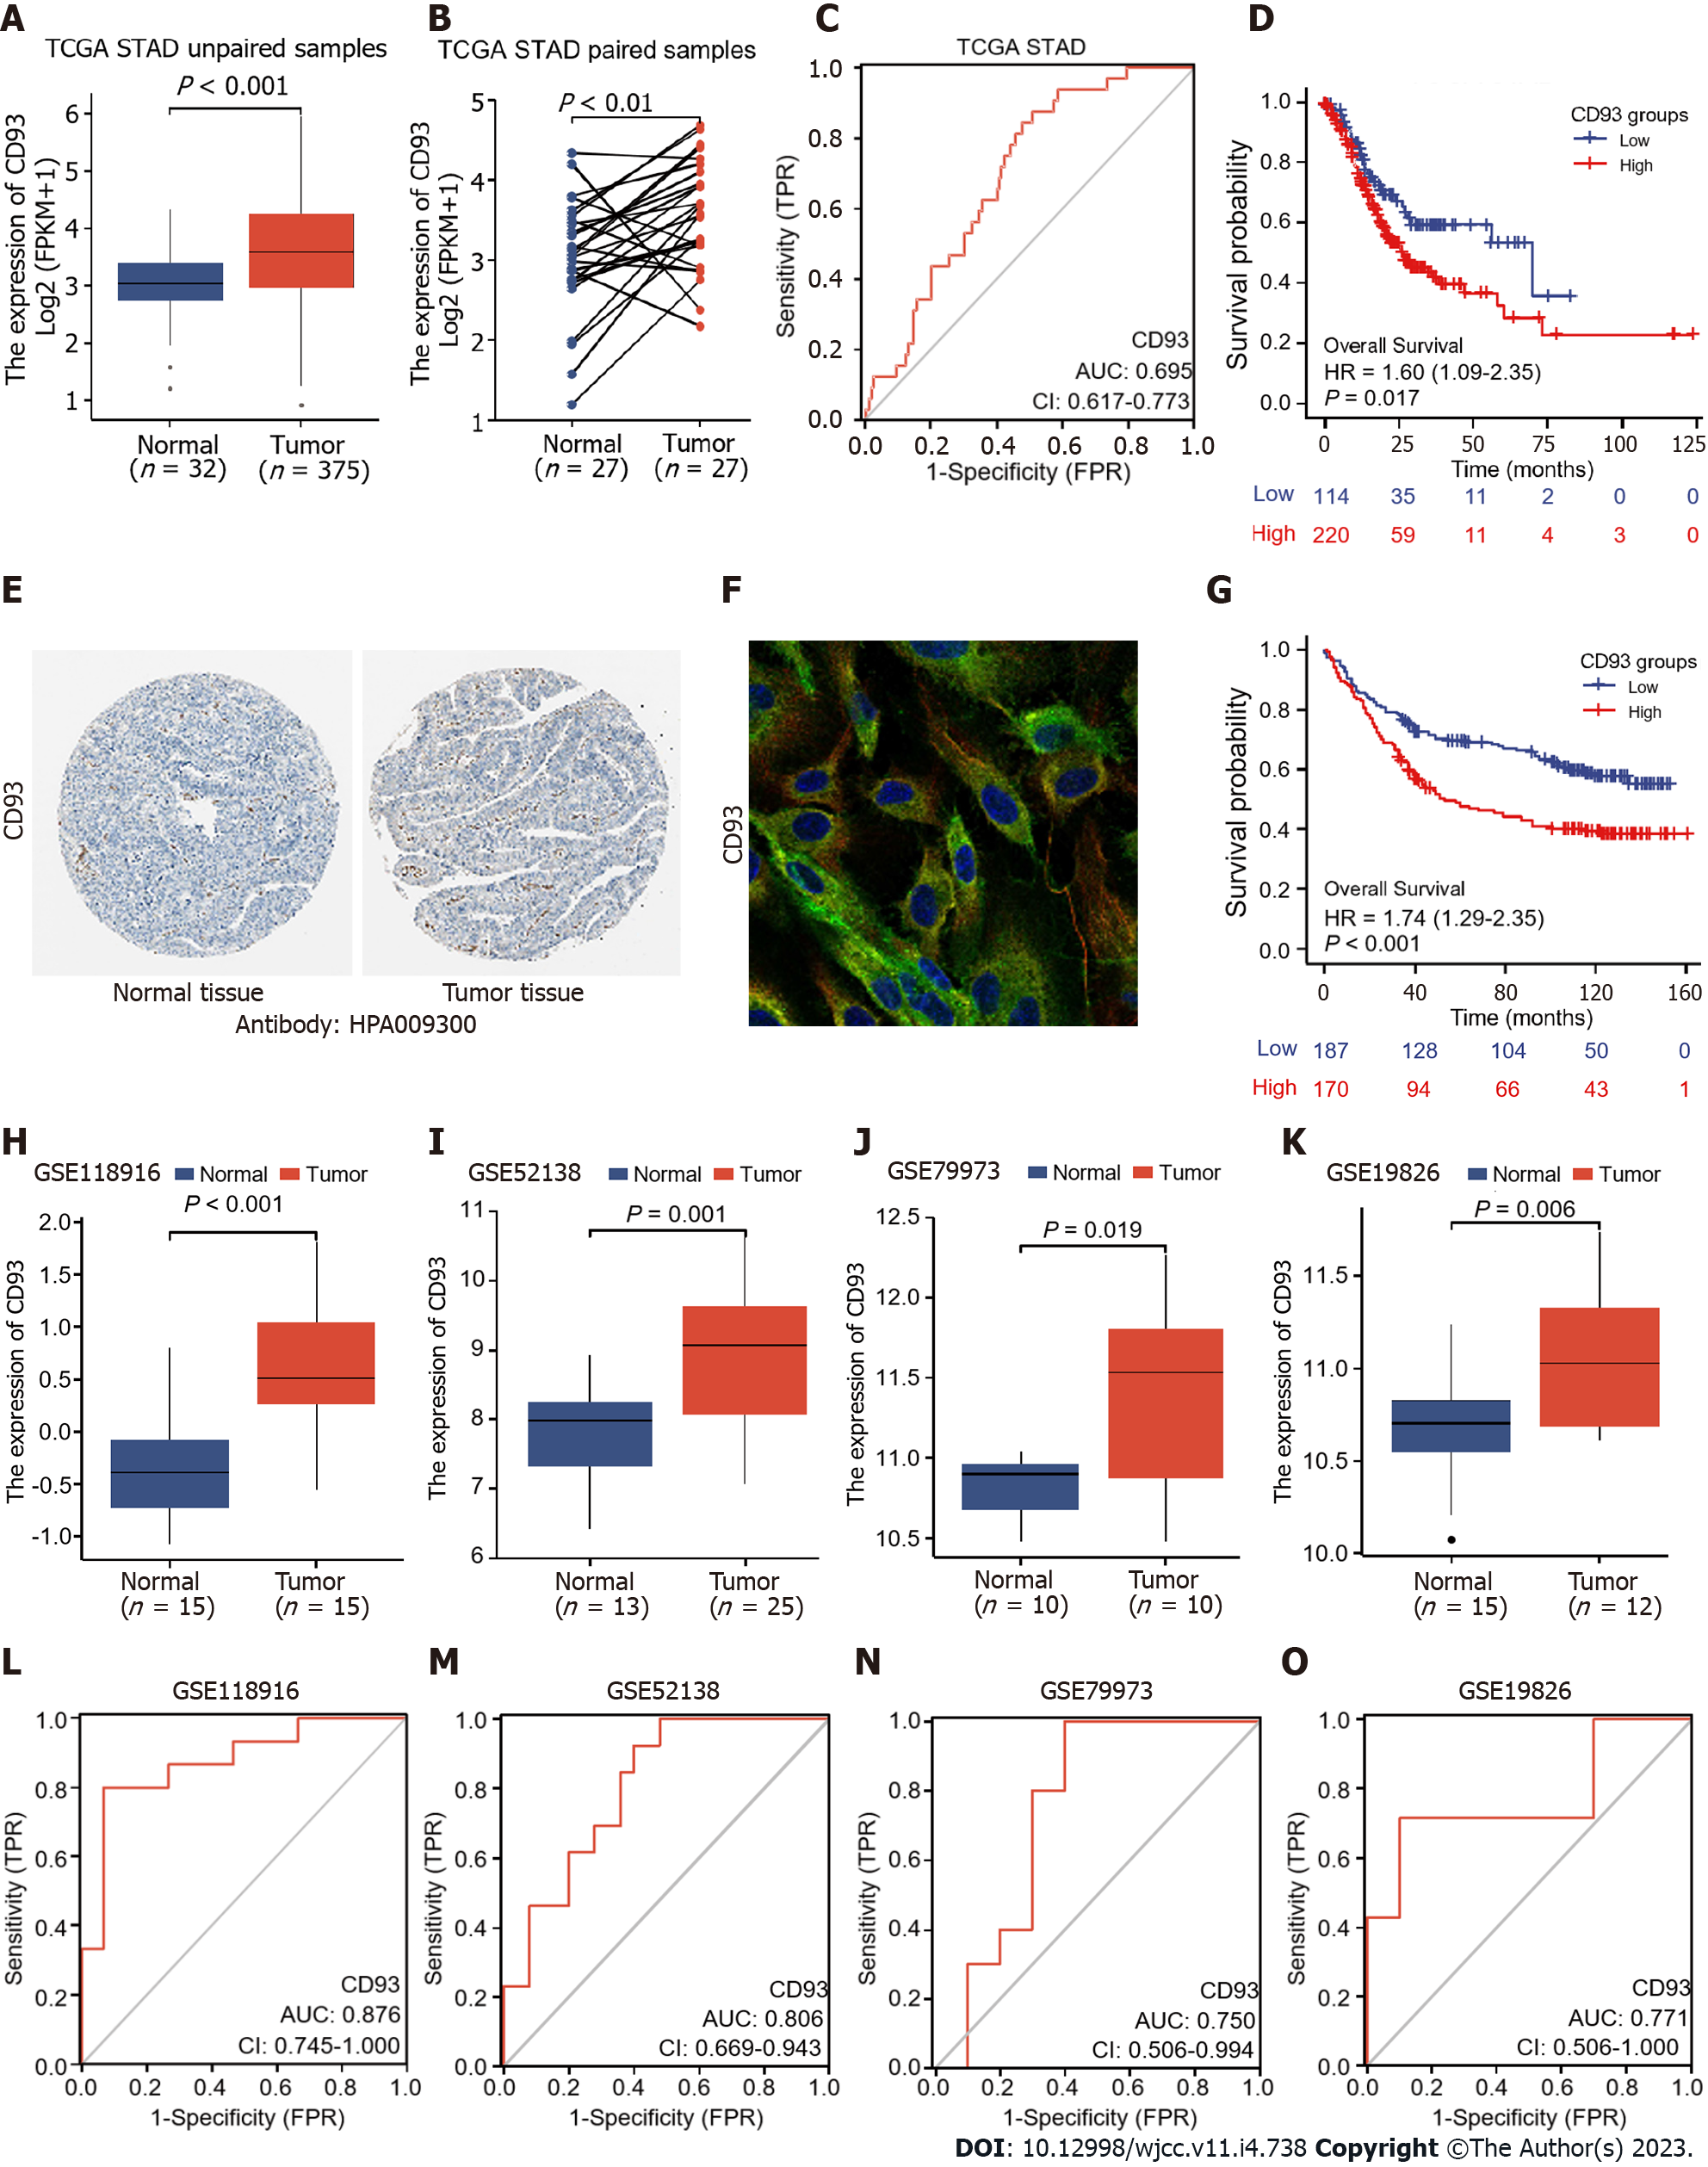
Figure 2 Diagnostic and prognostic value analysis.
A and B: Differential expression of CD93 between gastric cancer (GC) and normal tissues in unpaired samples (A), paired samples (B); C: Receiver operating characteristic (ROC) curve of overall survival based on CD93 in The Cancer Genome Atlas stomach adenocarcinoma; D: Kaplan-Meier analysis of OS between two groups; E: Immunohistochemistry of CD93 between GC and normal tissues; F: Immunofluorescence of CD93; H-K: Differential expression of CD93 in 4 validation datasets (GSE118916, GSE52138, GSE79973, and GSE19826); L-O: ROC curves of 4 validation datasets based on CD93.
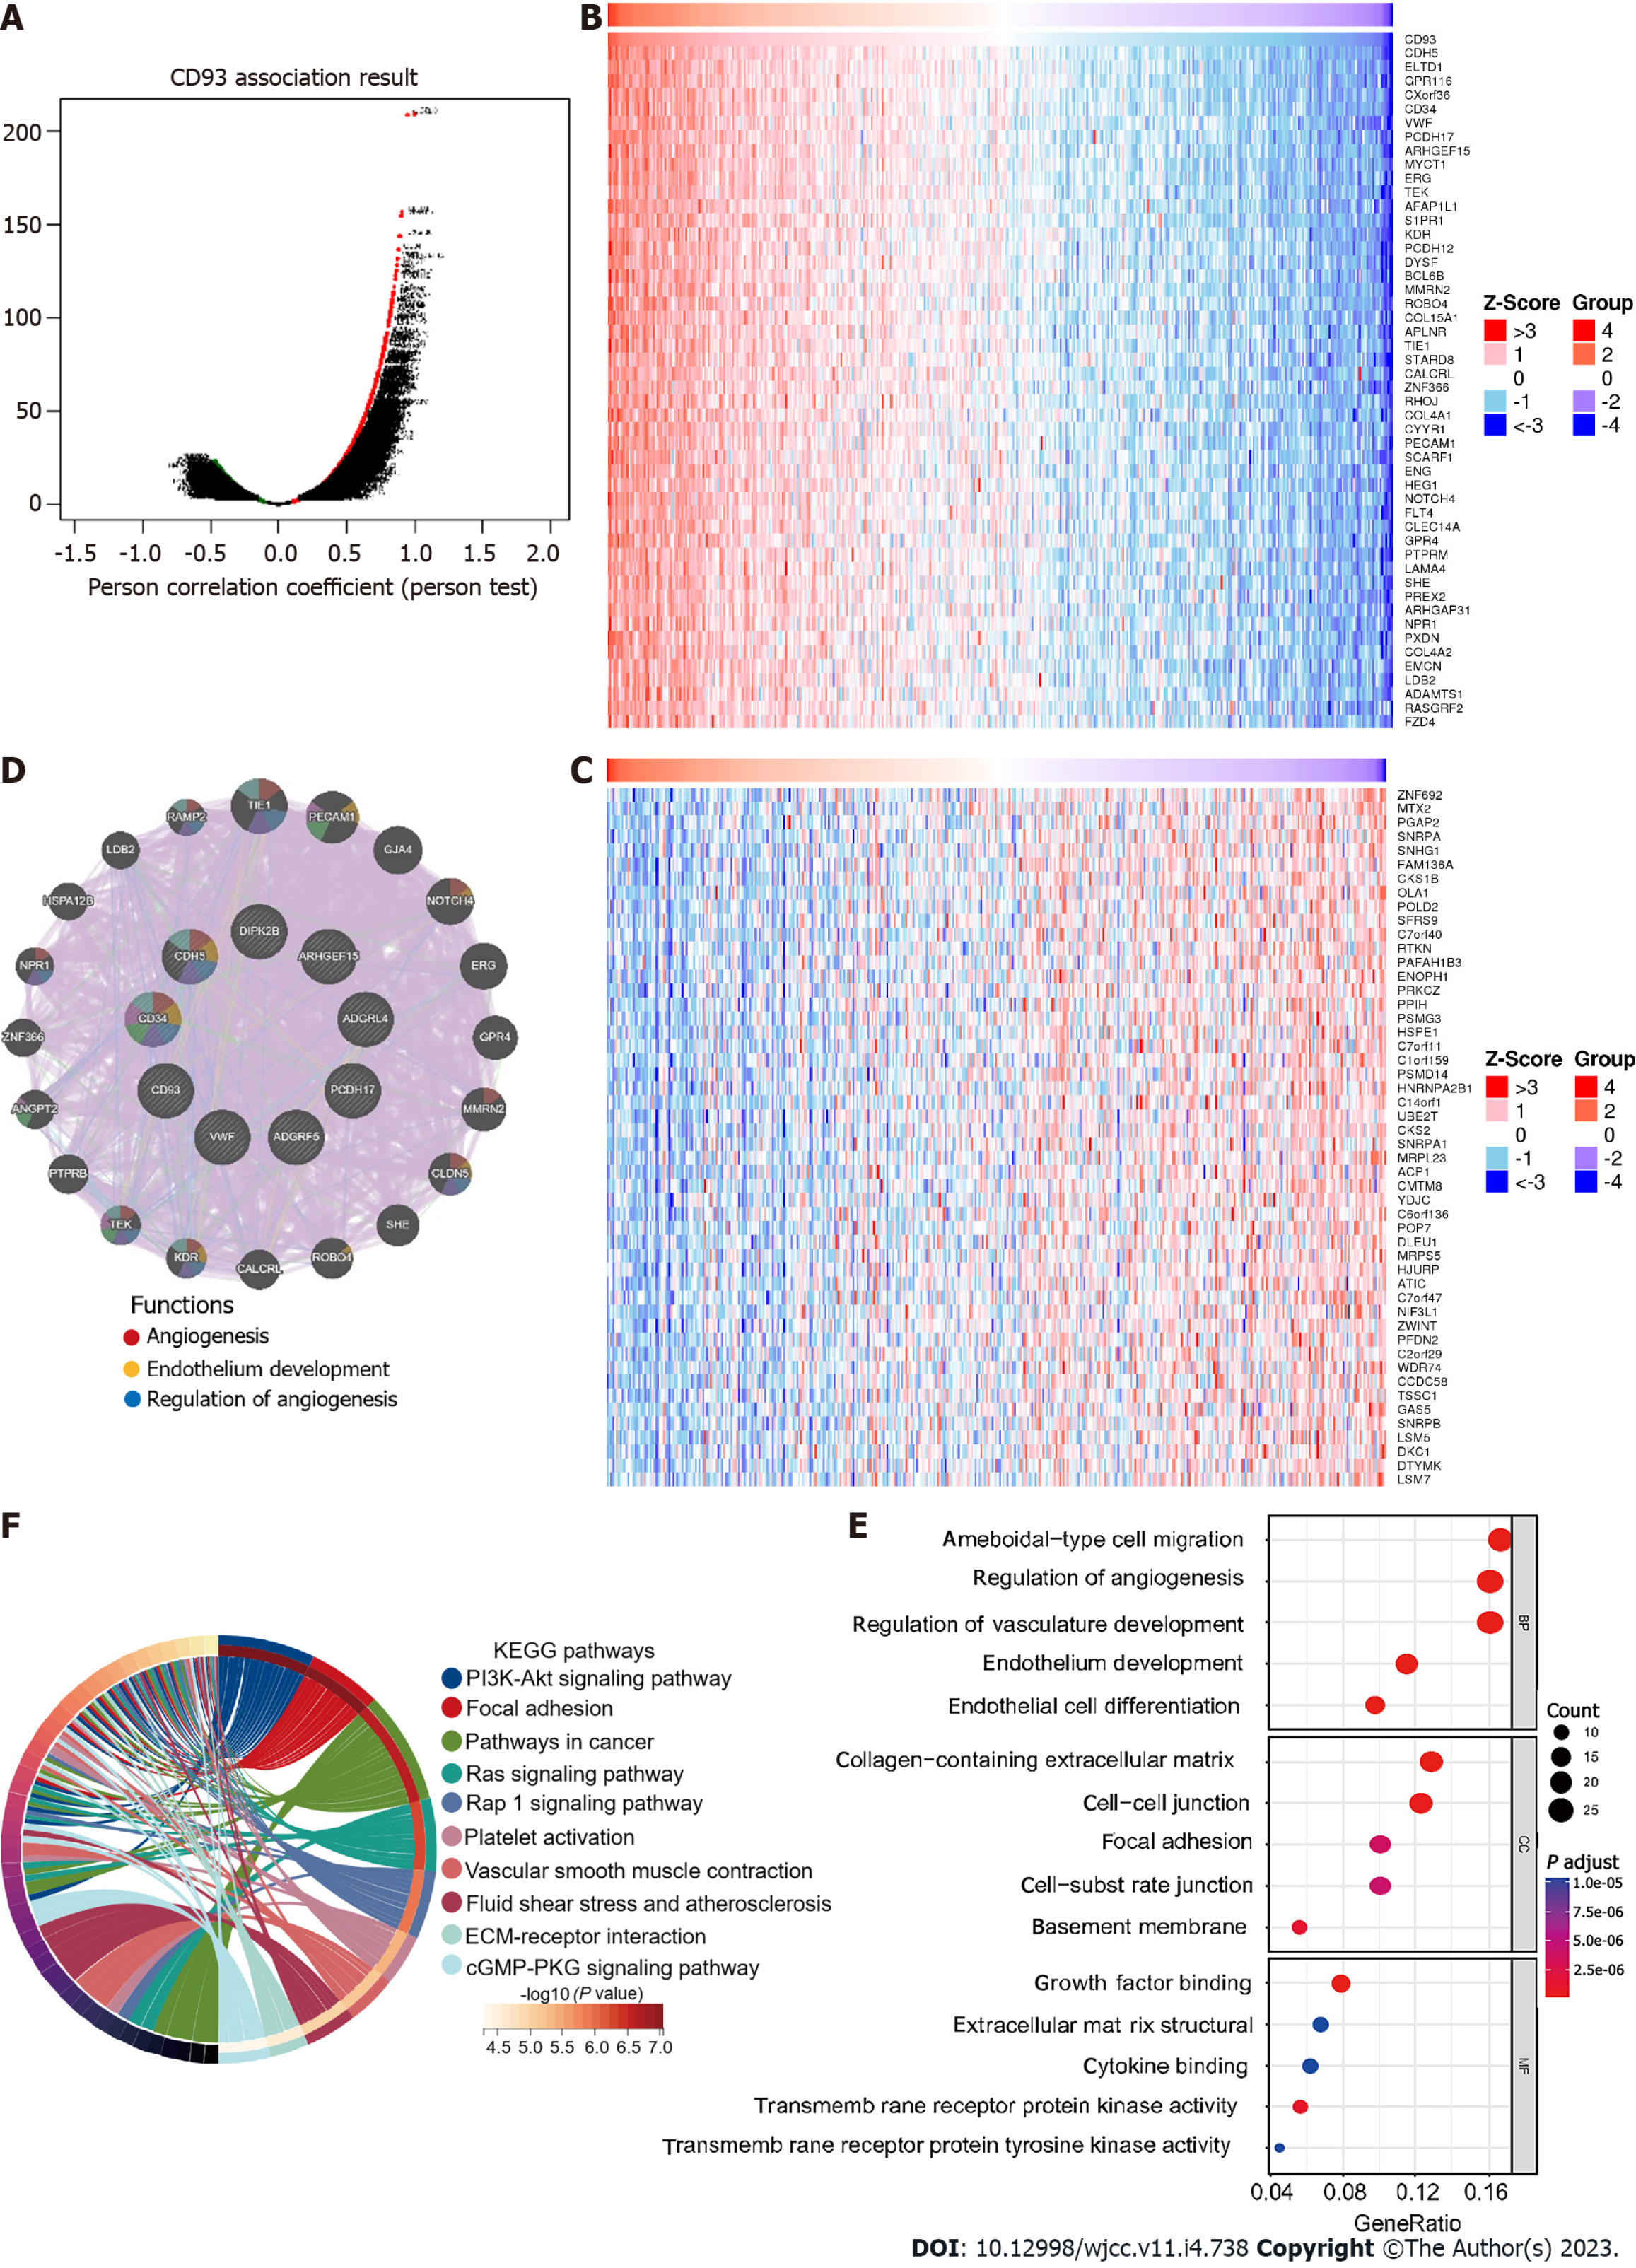
Figure 3 Function and pathway analysis.
A: Genes are highly correlated with CD93; B: Heatmap of the top 50 positive correlation genes; C: Heatmap of the top 50 negative correlation genes; D: Protein-protein interaction of the top positive correlation genes; E: The Gene Ontology enrichment analysis; F: The Kyoto Encyclopedia of Genes and Genomes pathways enrichment analysis.
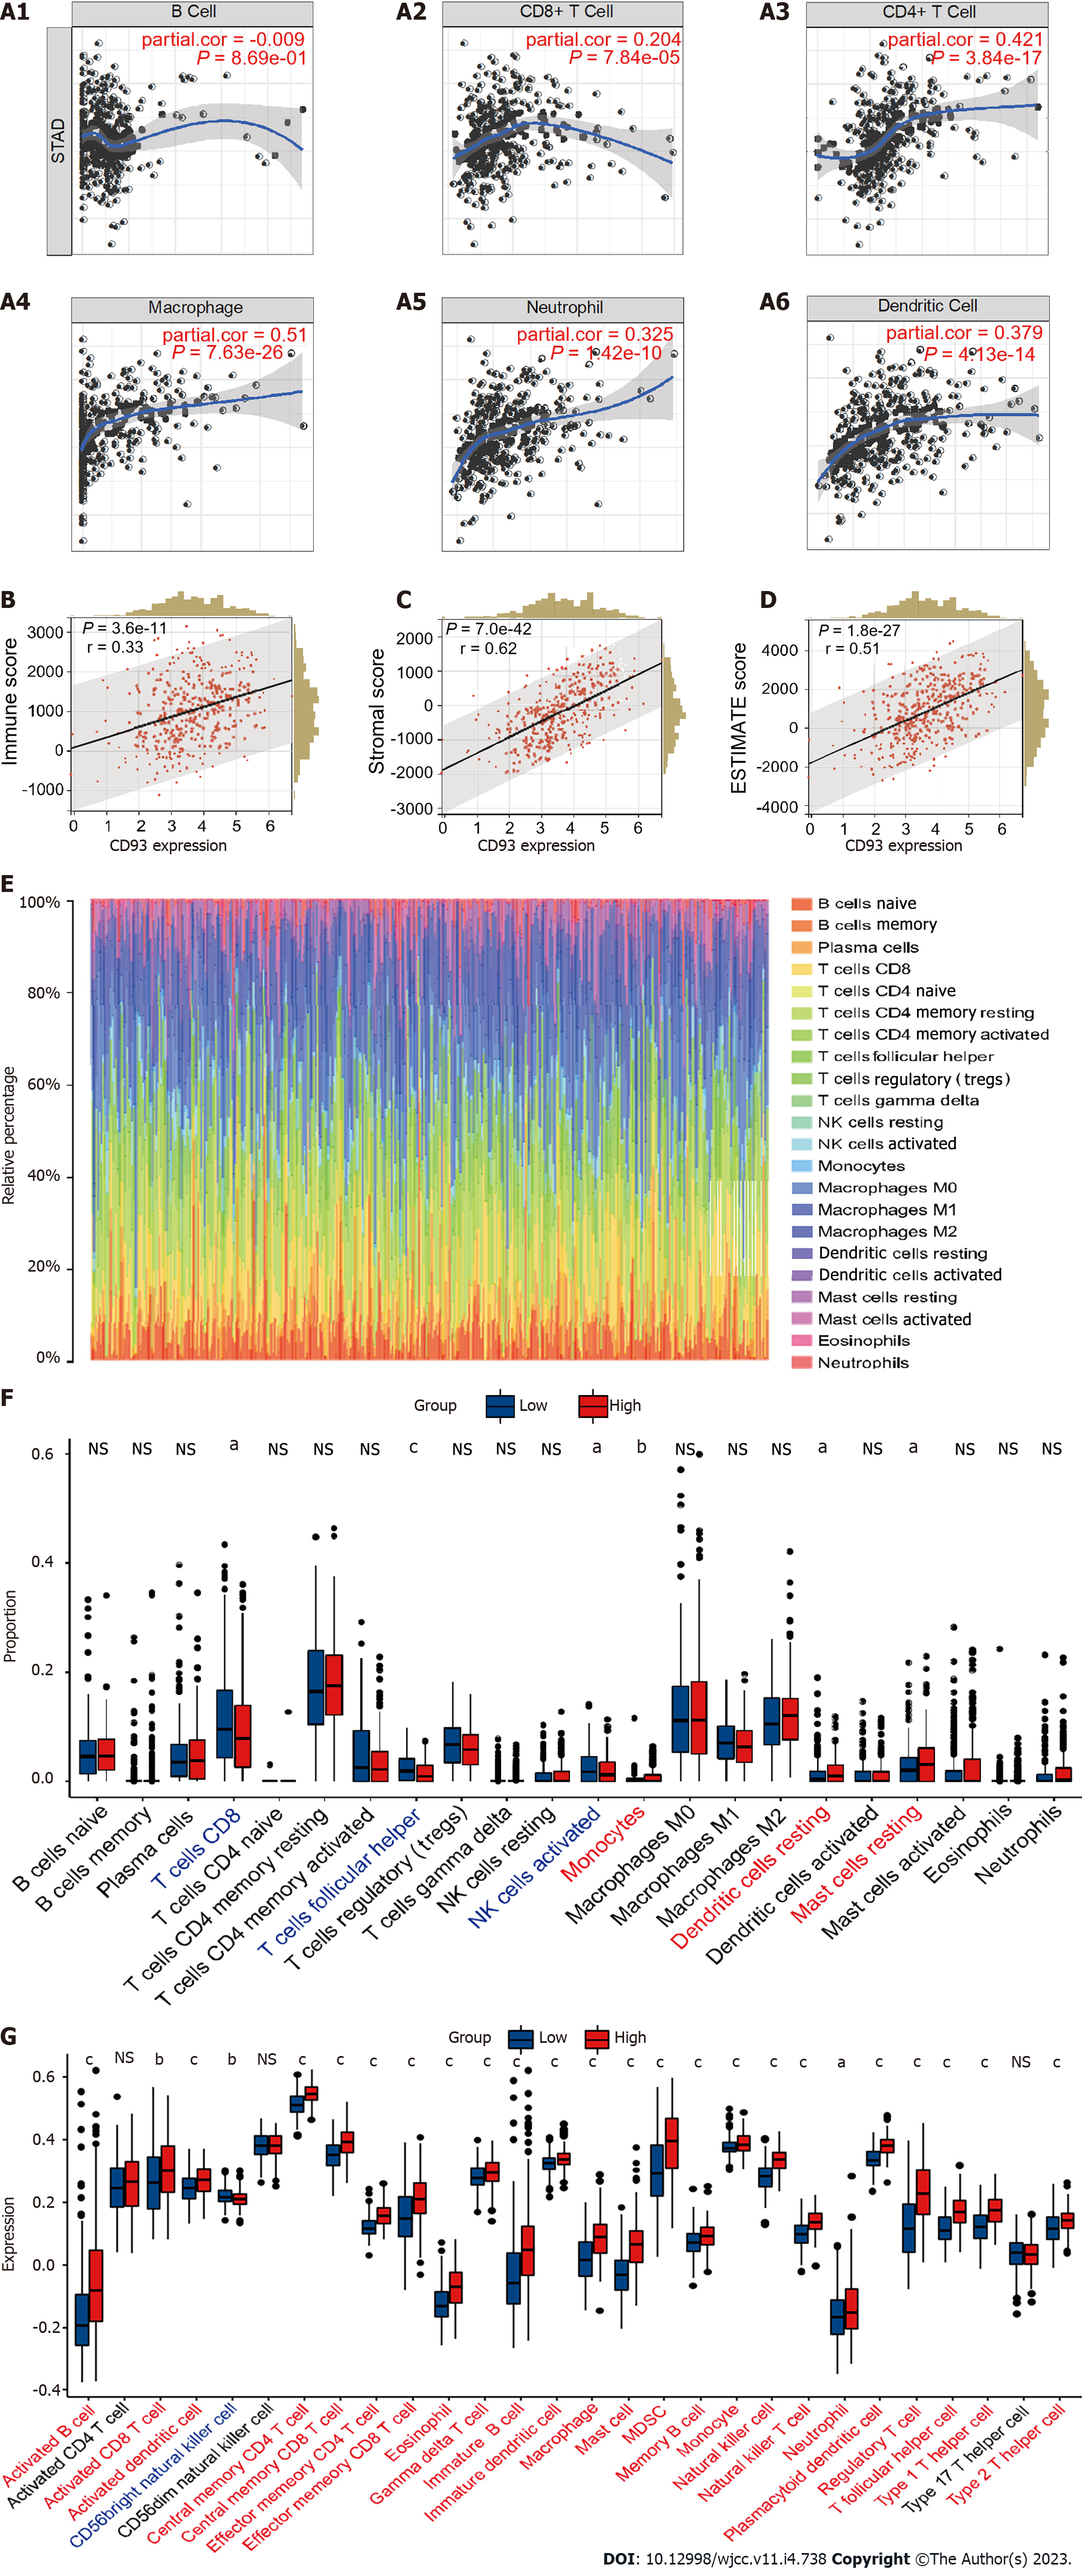
Figure 4 Immune characteristics in tumor microenvironment.
A: Correlation between CD93 and six types of immune cells based on TIMER; B-D: Correlation between CD93 and immune score (B), stromal score (C), ESTIMATE score (D); E: The proportion of immune cell infiltration; F: Different proportions of immune cells infiltration between two groups; G: Expression of immune cells between two groups via ssGSEA. The P values are labeled as aP < 0.05, bP < 0.01, cP < 0.001, NS: No significance.
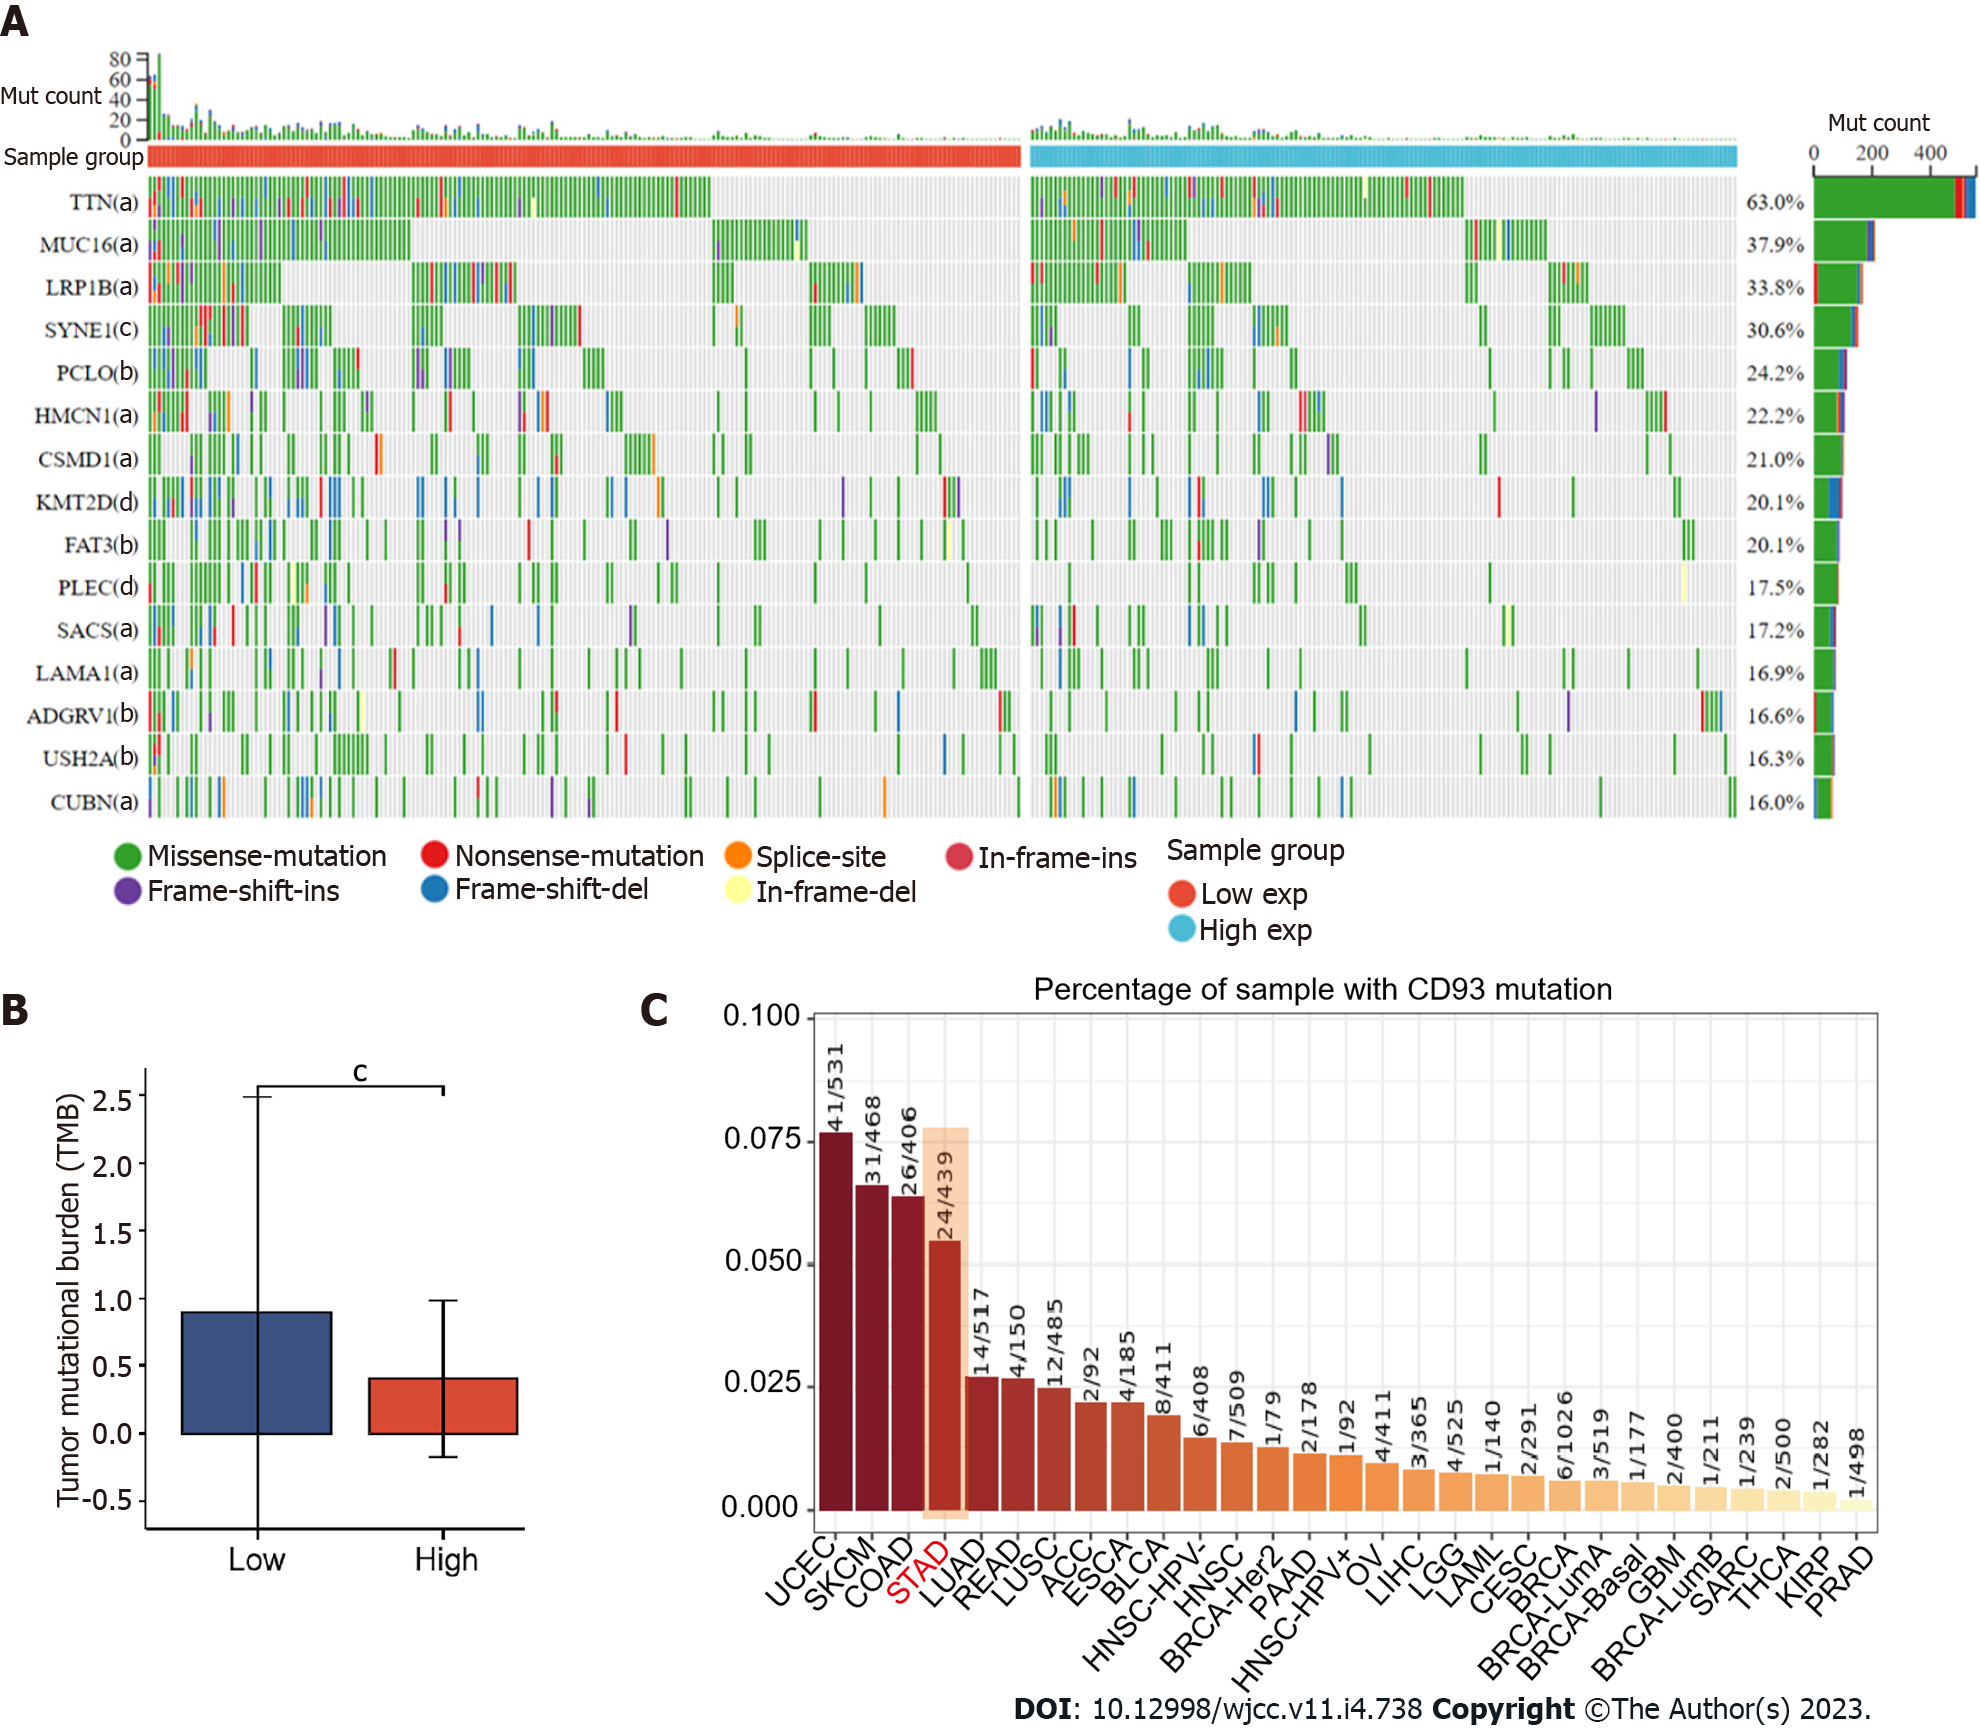
Figure 5 Gene mutation and tumor mutational burden comparison.
A: Comparison of mutational landscapes between two groups; B: Comparison of tumor mutational burden between two groups; C: The mutation rate of CD93 in gastric cancer ranked fourth in pan-cancer. The P values are labeled as aP < 0.05, bP < 0.01, cP < 0.001.
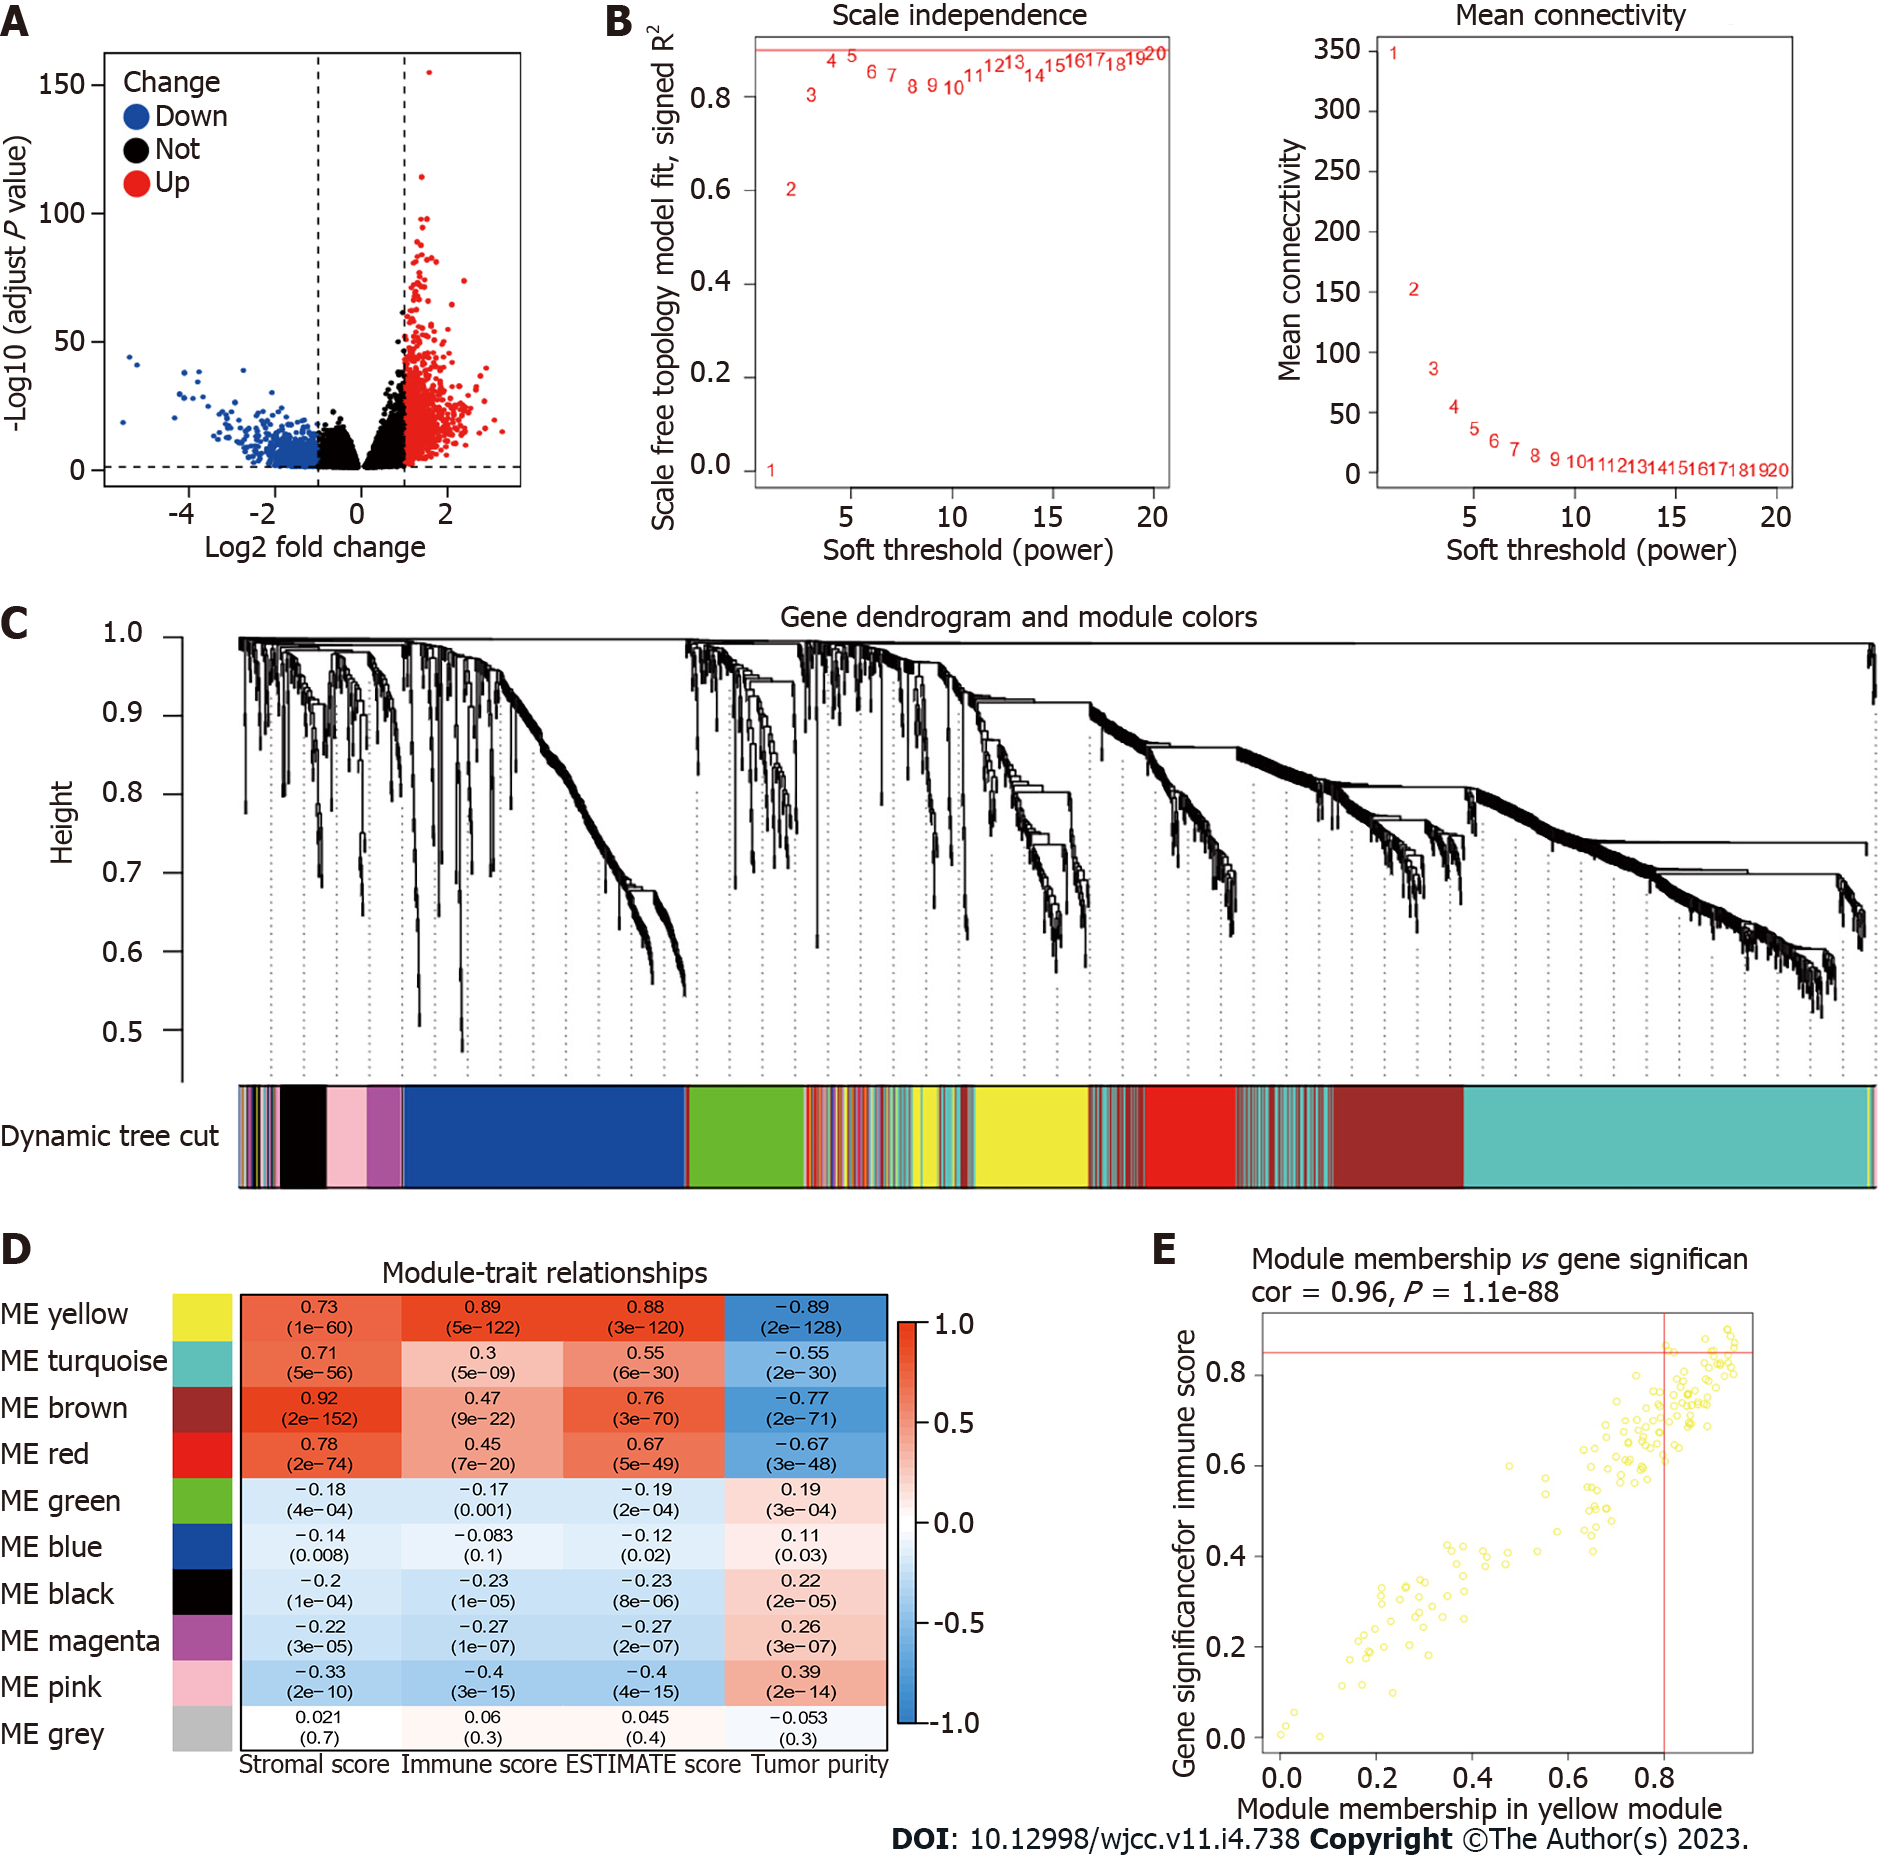
Figure 6 Identification of the key genes related to CD93 in the tumor immune microenvironment.
A: Volcano plot of variance analysis; B: Analysis of network topology for soft powers; C: Gene dendrogram and module colors; D: Heatmap between modules and ESTIMATE results; E: Scatter plot of genes in the yellow module.
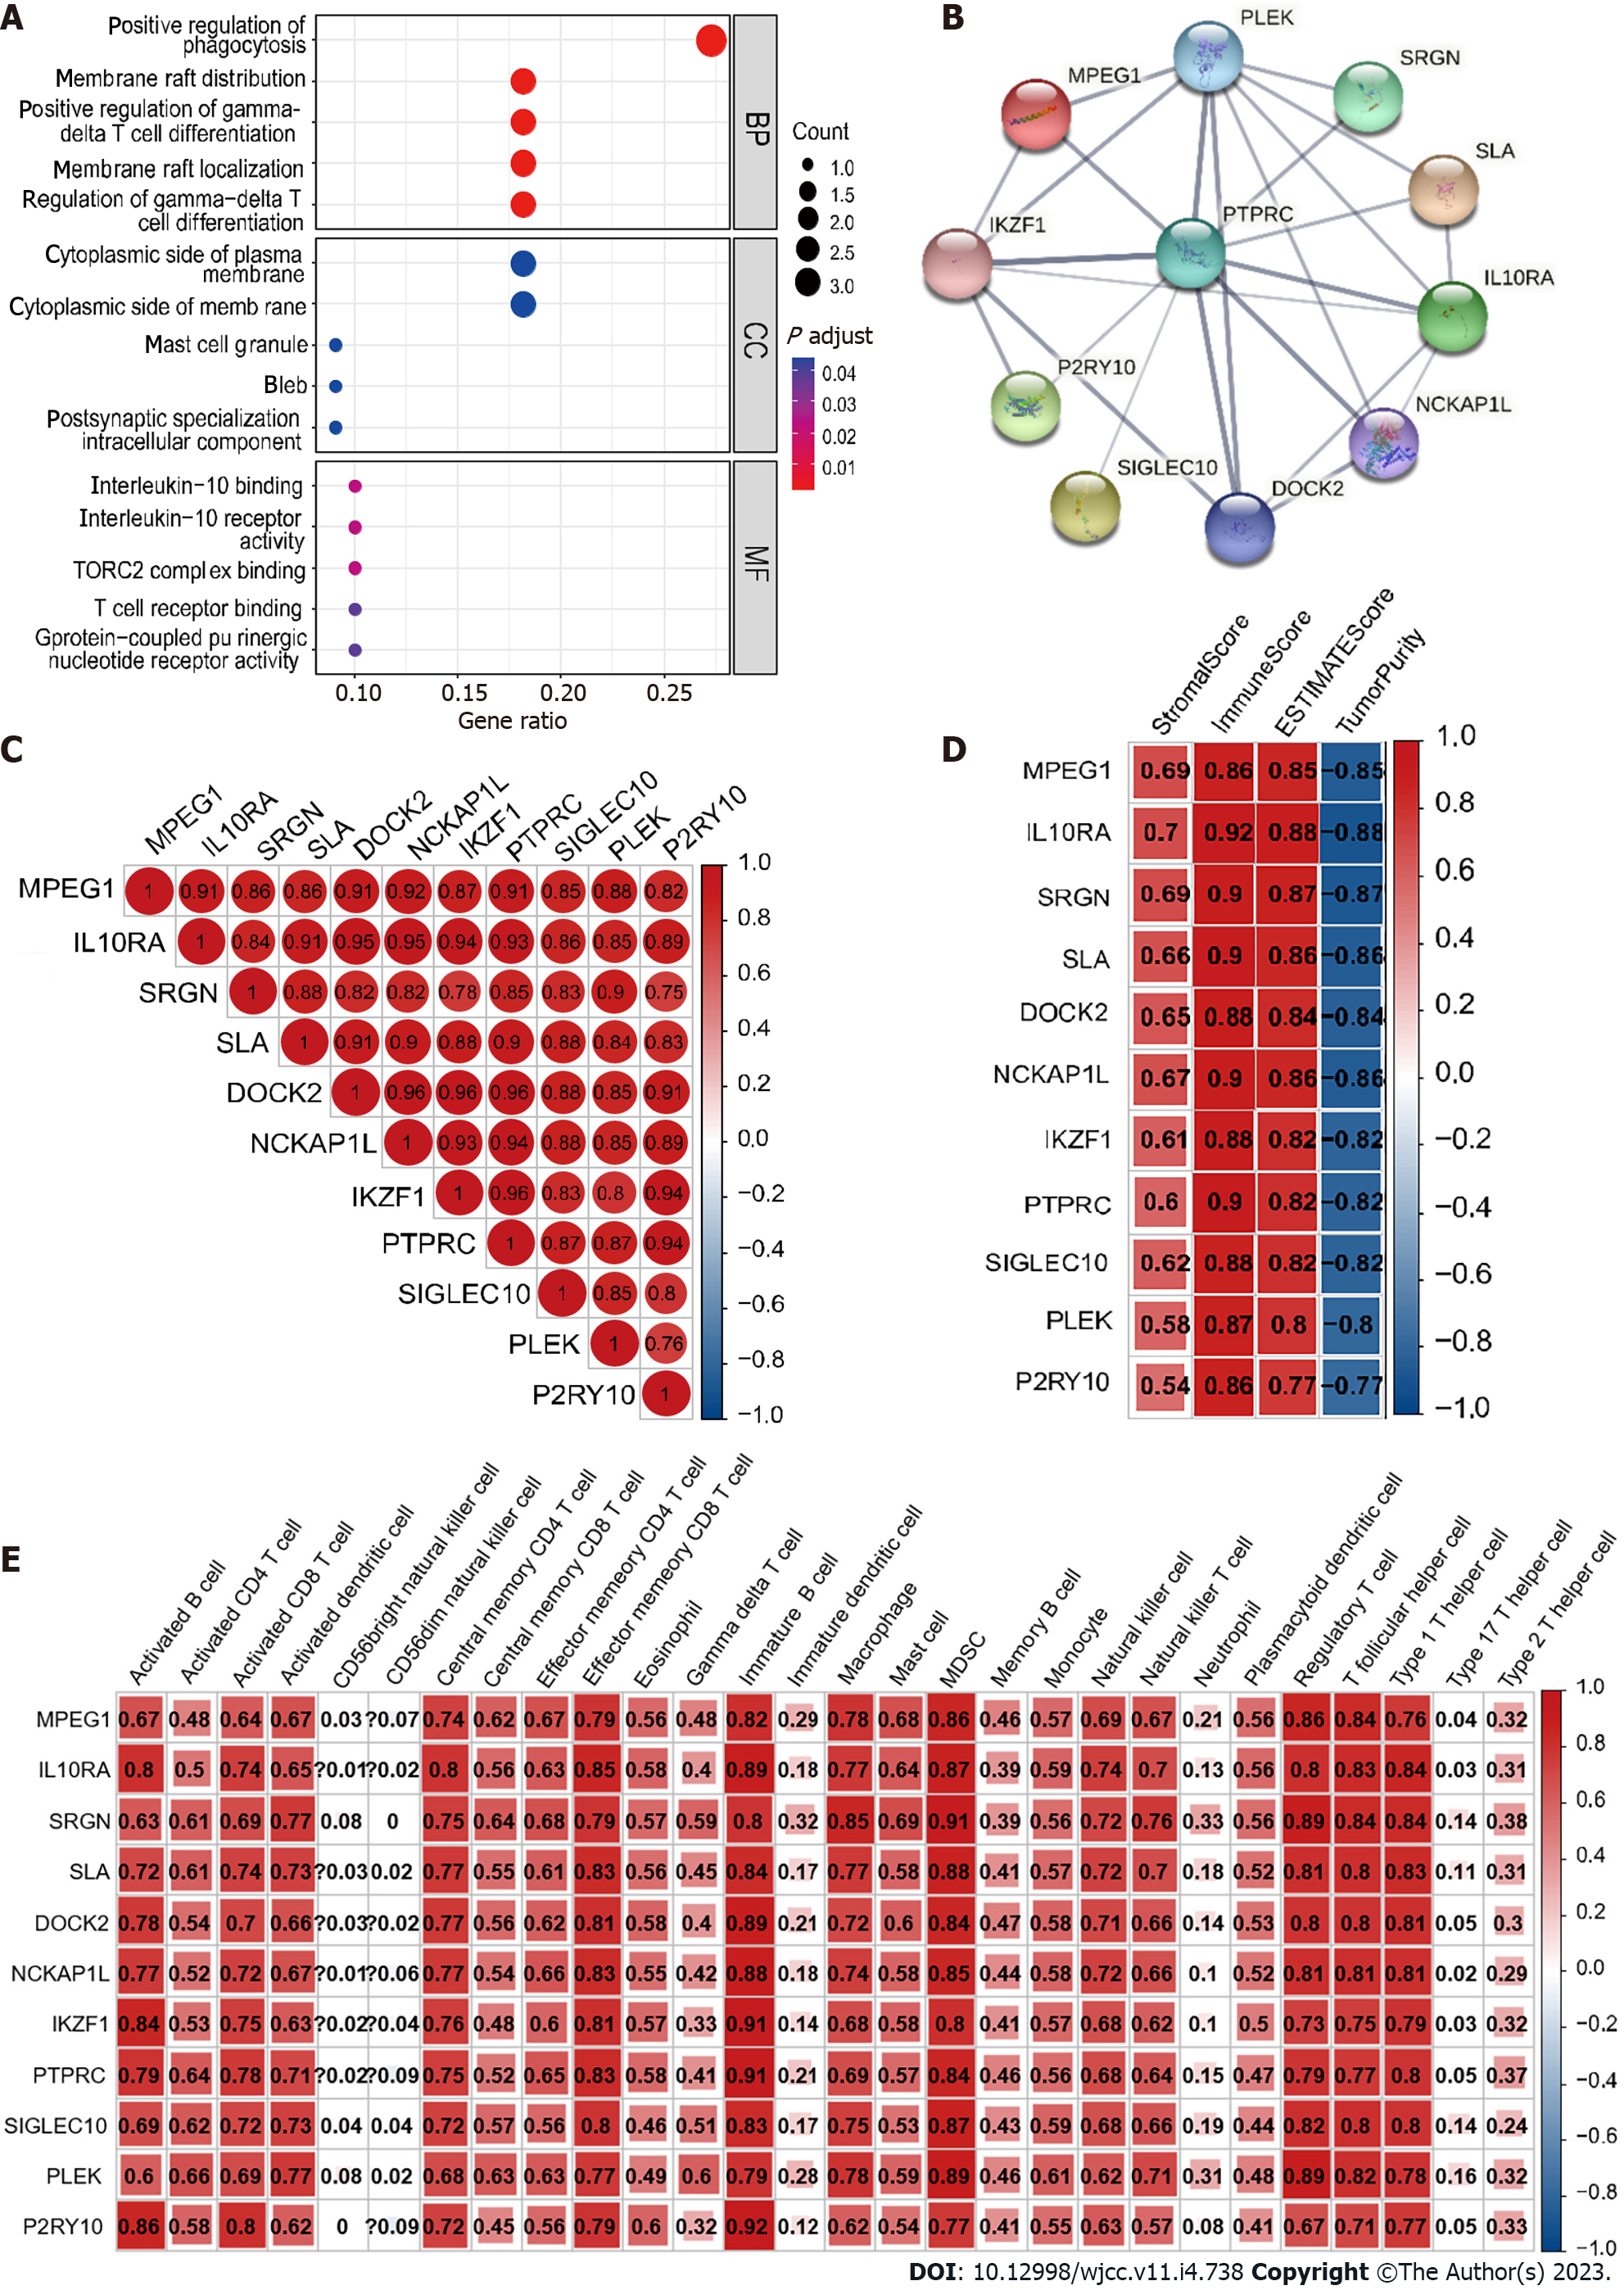
Figure 7 Analysis of 11 hub genes.
A: The Gene Ontology analysis of hub genes; B: Protein-protein interaction network of hub genes; C: Relevance between hub genes; D: Correlation between hub genes and ESTIMATE results; E: Correlation between hub genes and expression of immune cells.
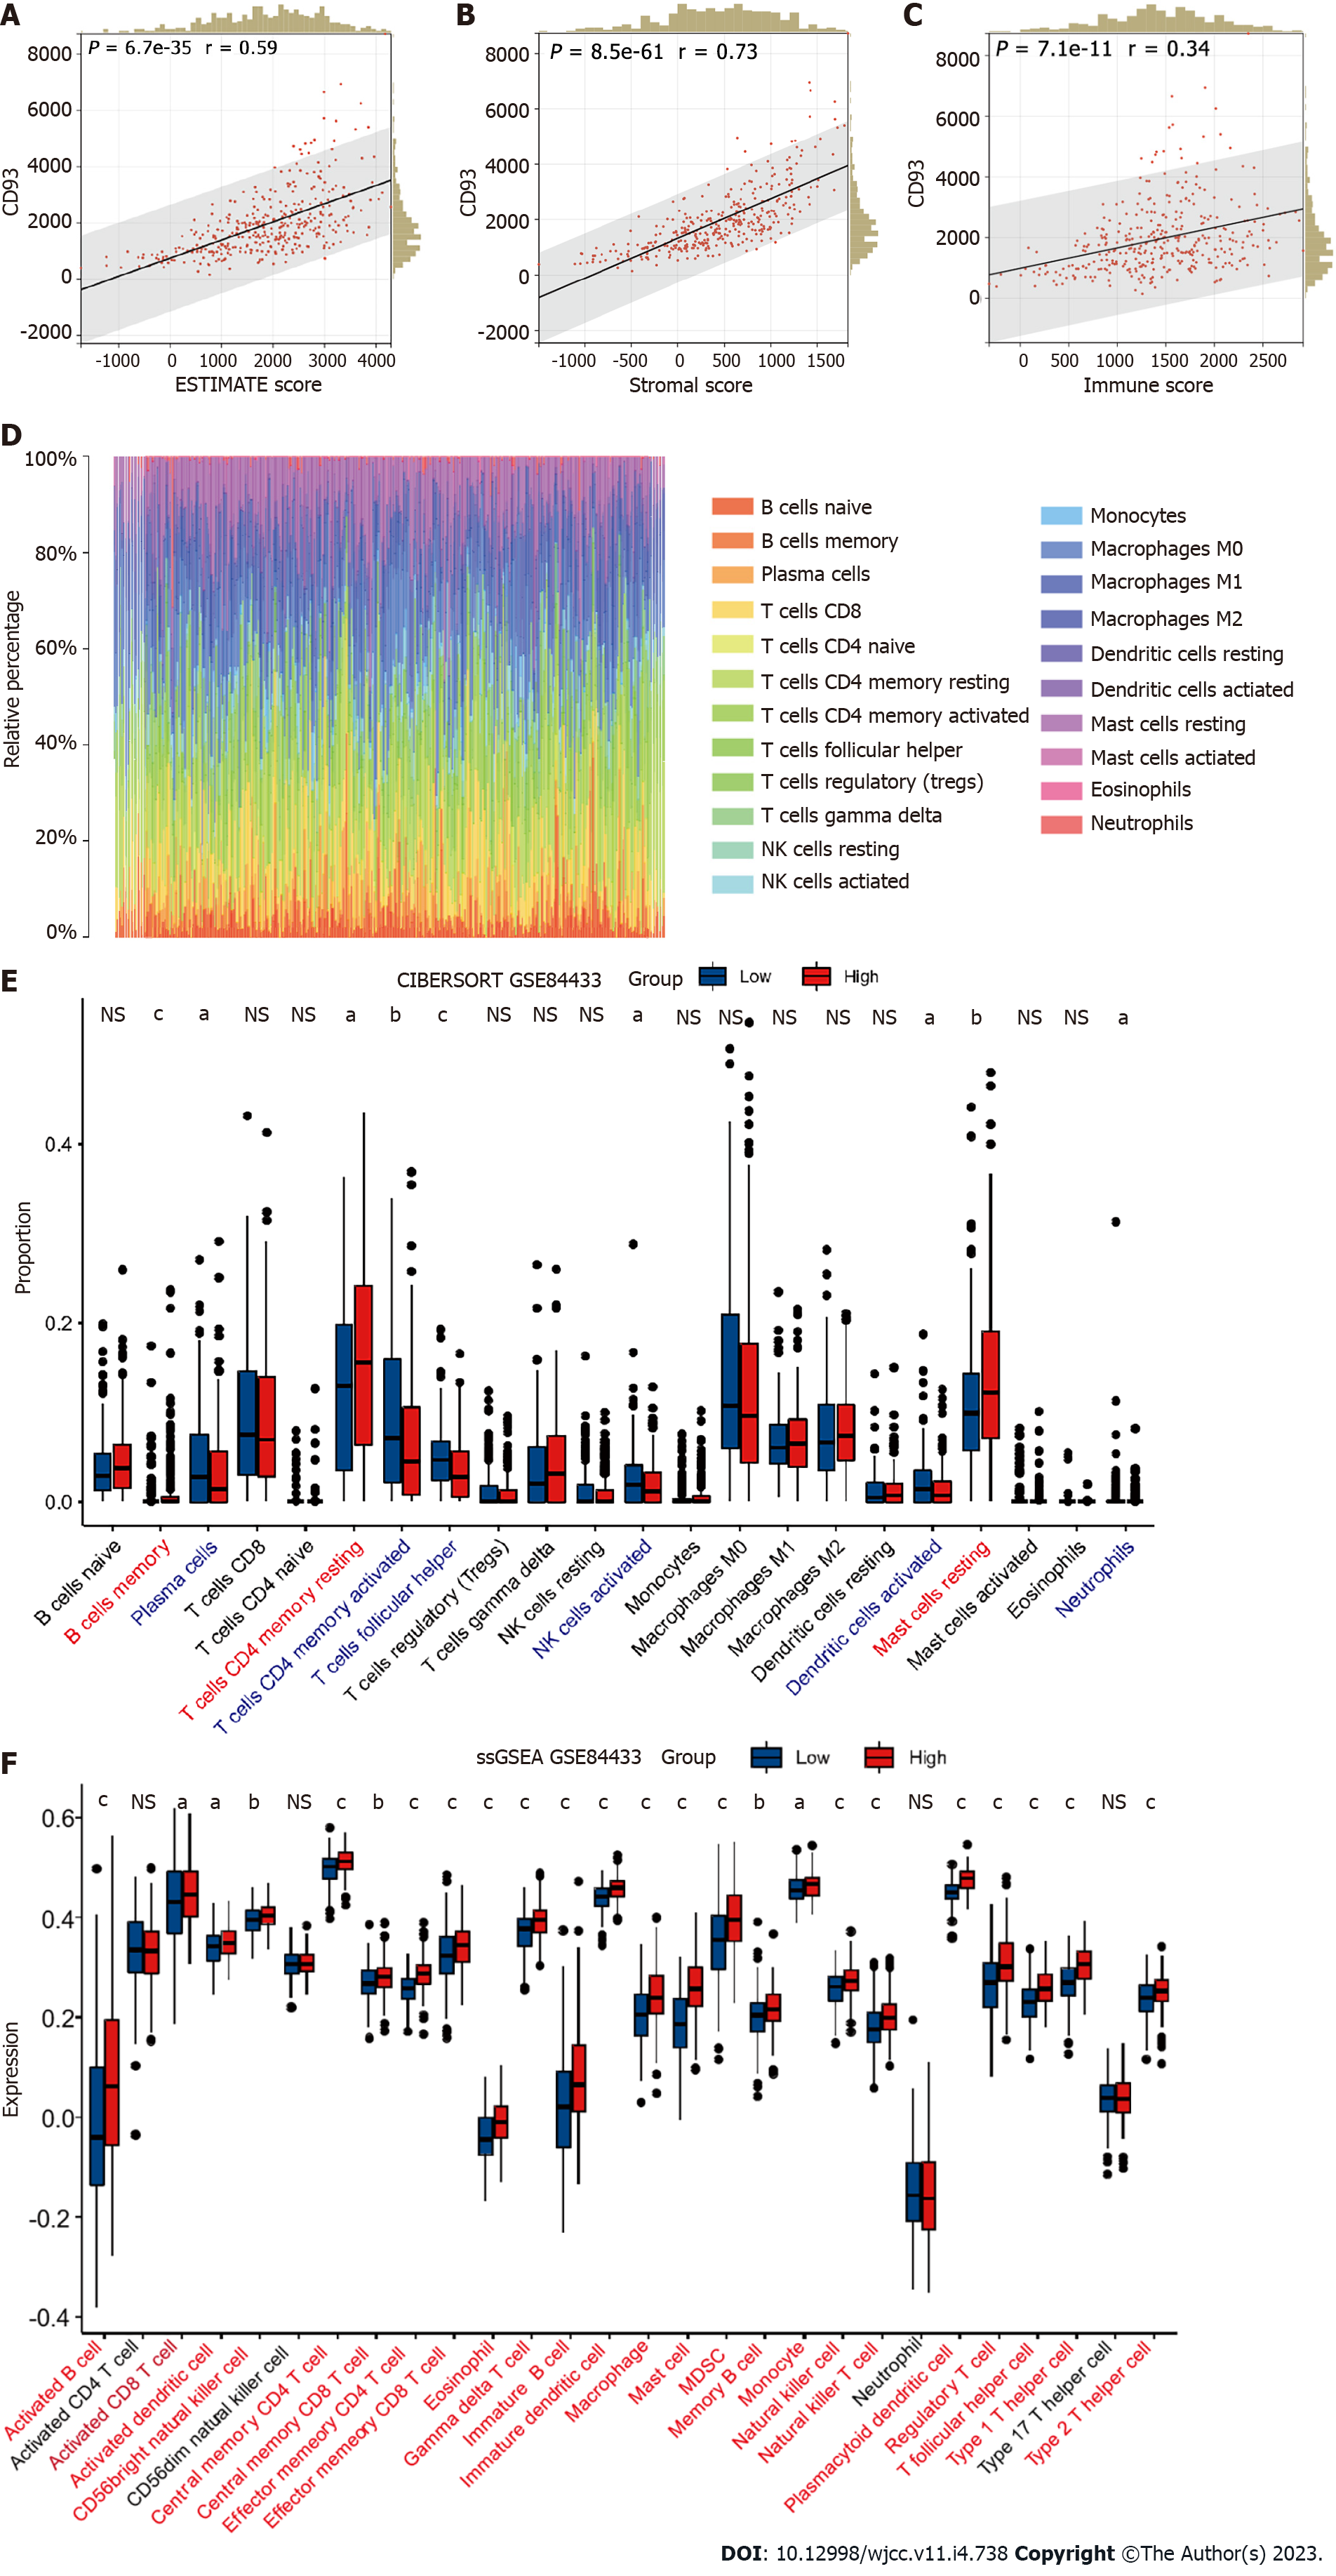
Figure 8 Validation of immune characteristics.
A-C: Correlation between CD93 and ESTIMATE score (A), stromal score (B), immune score (C). D: Cibersort; E: Different proportions of immune cells infiltration between two groups; F: ssGSEA. The P values are labeled as aP < 0.05, bP < 0.01, cP < 0.001, NS: No significance.
- Citation: Li Z, Zhang XJ, Sun CY, Fei H, Li ZF, Zhao DB. CD93 serves as a potential biomarker of gastric cancer and correlates with the tumor microenvironment. World J Clin Cases 2023; 11(4): 738-755
- URL: https://www.wjgnet.com/2307-8960/full/v11/i4/738.htm
- DOI: https://dx.doi.org/10.12998/wjcc.v11.i4.738


