Copyright
©The Author(s) 2023.
World J Clin Cases. Jan 26, 2023; 11(3): 645-654
Published online Jan 26, 2023. doi: 10.12998/wjcc.v11.i3.645
Published online Jan 26, 2023. doi: 10.12998/wjcc.v11.i3.645
Figure 1 Magnetic resonance imaging results of the patient after admission.
A and B: Pelvic magnetic resonance imaging (MRI) showed a rounded abnormal signal shadow in the left seminal vesicle, with low signal on T1-weighted imaging (T1WI) and high signal on T2-weighted imaging (T2WI) + lipid inhibition, and a size of approximately 2.3 cm × 1.6 cm; C and D: Pelvic MRI showed a nodular mass in the left inguinal region, with low signal on T1WI and high signal on T2WI + lipid inhibition, and a size of approximately 5.0 cm × 4.0 cm. The white arrowheads show the left seminal vesicle. The white arrows show the pelvic abscess (secondary focus).
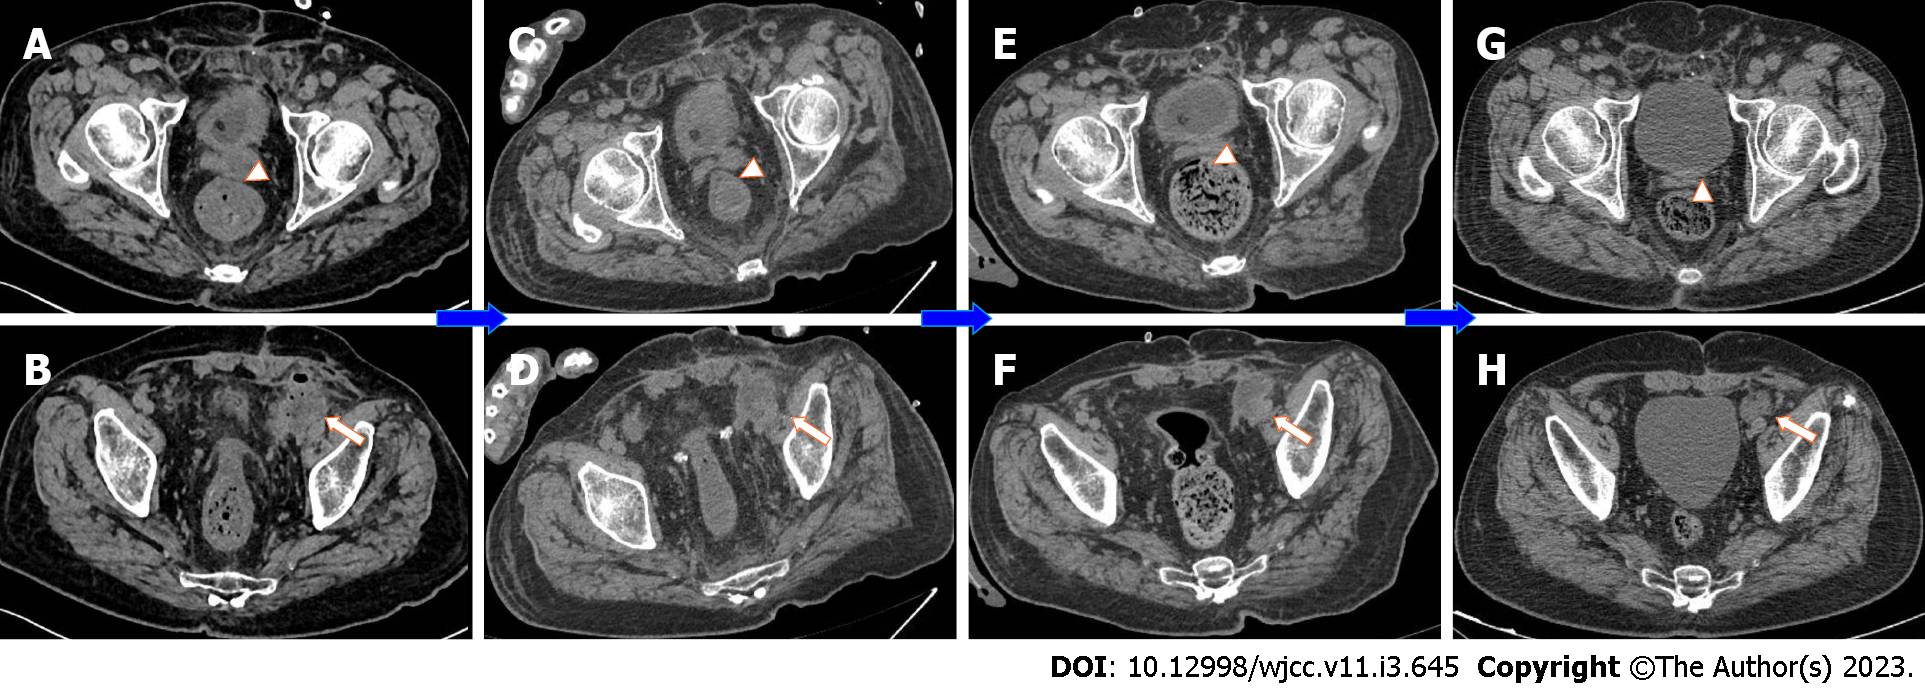
Figure 2 Computed tomography results of the patient throughout the diagnosis and treatment processes.
A-D: The results of pelvic computed tomography examinations on the 2nd day after admission, on the 10th day after surgery, at 1 mo after discharge, and at 3 mo after discharge; E-H: The primary focus of the left seminal vesicle abscess and the secondary focus of the extraperitoneal fascial abscess were gradually controlled and narrowed after treatment and outpatient and emergency follow-up. The white arrowheads show the left seminal vesicle. The white arrows show the pelvic abscess (secondary focus).
Figure 3 The appendix.
A and B: During the operation, the appendix was congested and edematous, with accumulation of the surrounding suppurative fluid, and the sigmoid colon was coated with a large amount of pus; C: A section of the appendix with a length of 3.5 cm and a diameter of 0.8-1.2 cm was cut; D: The suppurative inflammation of the appendix was confined outside the serosa (microscopy, × 100).
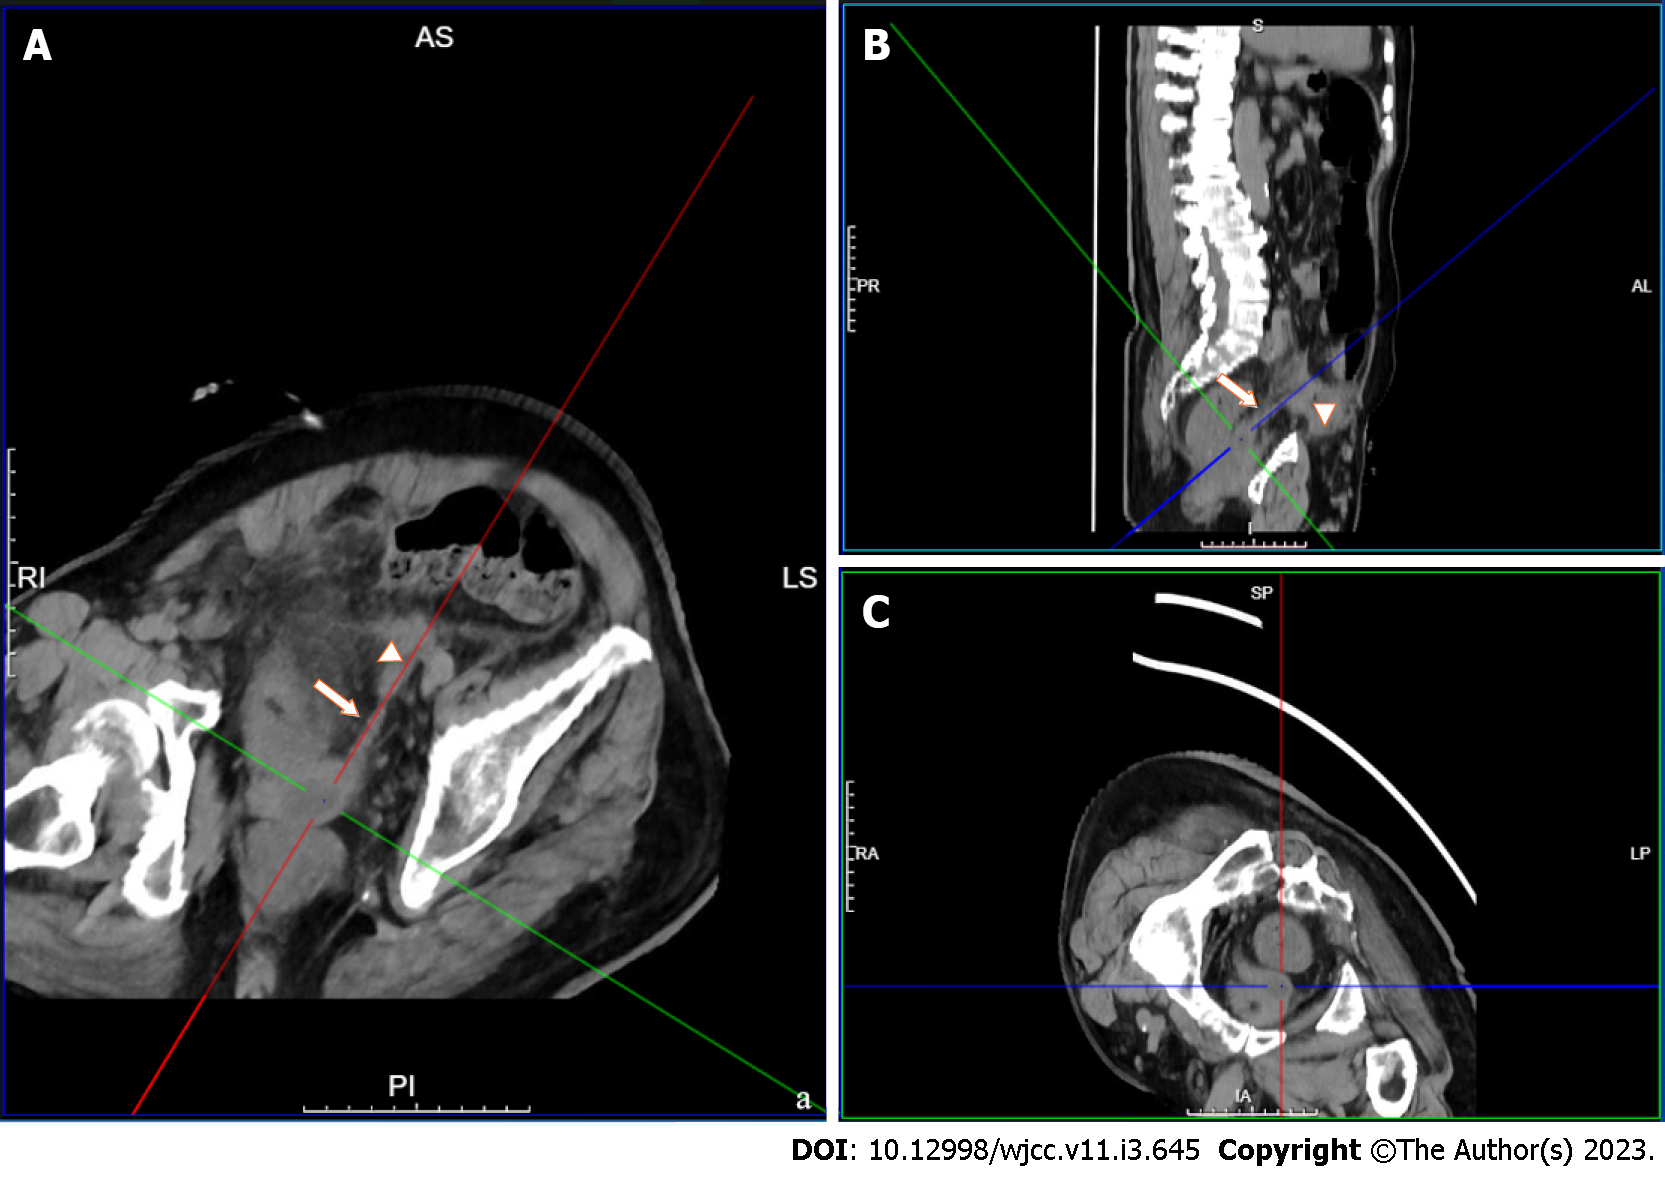
Figure 4 Three-dimensional computed tomography reconstruction showing the primary and secondary abscesses.
A: Transverse view; B: Sagittal view; C: Coronal view. The primary focus is located at the baseline center, the white arrows indicate the vas deferens, and the arrowheads show the secondary focus.
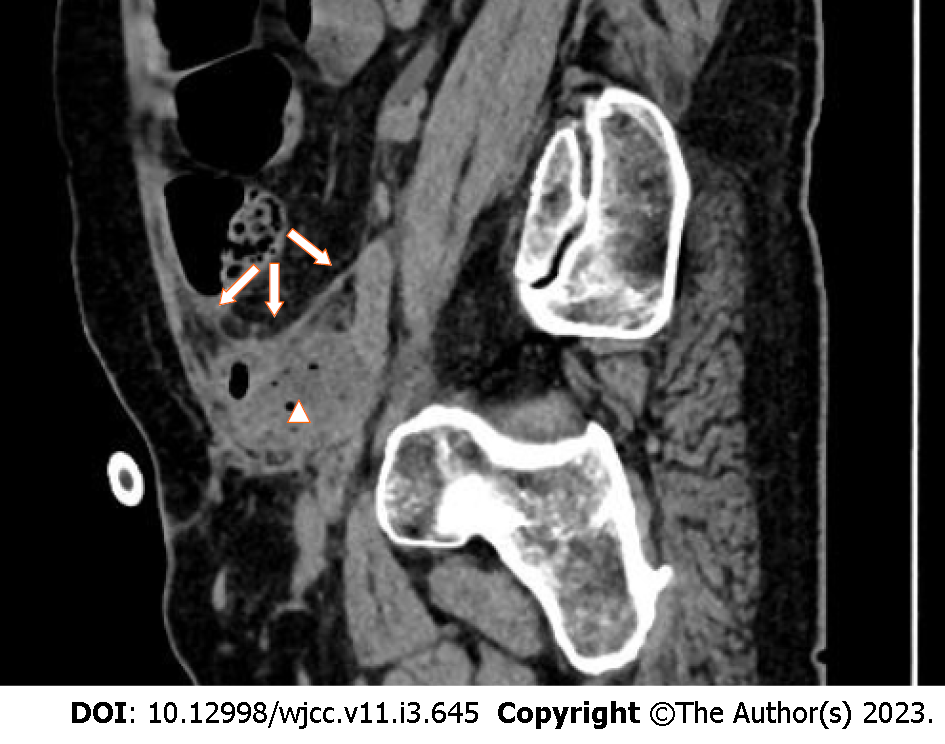
Figure 5 Sagittal computed tomography image showing the relationship between the secondary focus and the pelvis and abdominal cavity.
The white arrows indicate the peritoneum, and the arrowhead shows the secondary focus.
- Citation: Li K, Liu NB, Liu JX, Chen QN, Shi BM. Acute diffuse peritonitis secondary to a seminal vesicle abscess: A case report. World J Clin Cases 2023; 11(3): 645-654
- URL: https://www.wjgnet.com/2307-8960/full/v11/i3/645.htm
- DOI: https://dx.doi.org/10.12998/wjcc.v11.i3.645


