Copyright
©The Author(s) 2023.
World J Clin Cases. Jan 26, 2023; 11(3): 610-620
Published online Jan 26, 2023. doi: 10.12998/wjcc.v11.i3.610
Published online Jan 26, 2023. doi: 10.12998/wjcc.v11.i3.610
Figure 1 Target propofol concentrations in plasma for consecutive patients of each group and the response to the procedures.
A: Target propofol concentrations in plasma for consecutive patients in the control group (group C); B: Target propofol concentrations in plasma for consecutive patients in group B1; C: Target propofol concentrations in plasma for consecutive patients in group B2. The target propofol concentrations in plasma for consecutive patients in each group and the response to the procedures were used to calculate the median effective concentration (EC50), which is the concentration required to achieve the half maximal effectiveness of propofol. The resulting EC50 for each group and 95% confidence intervals are presented in Table 2.
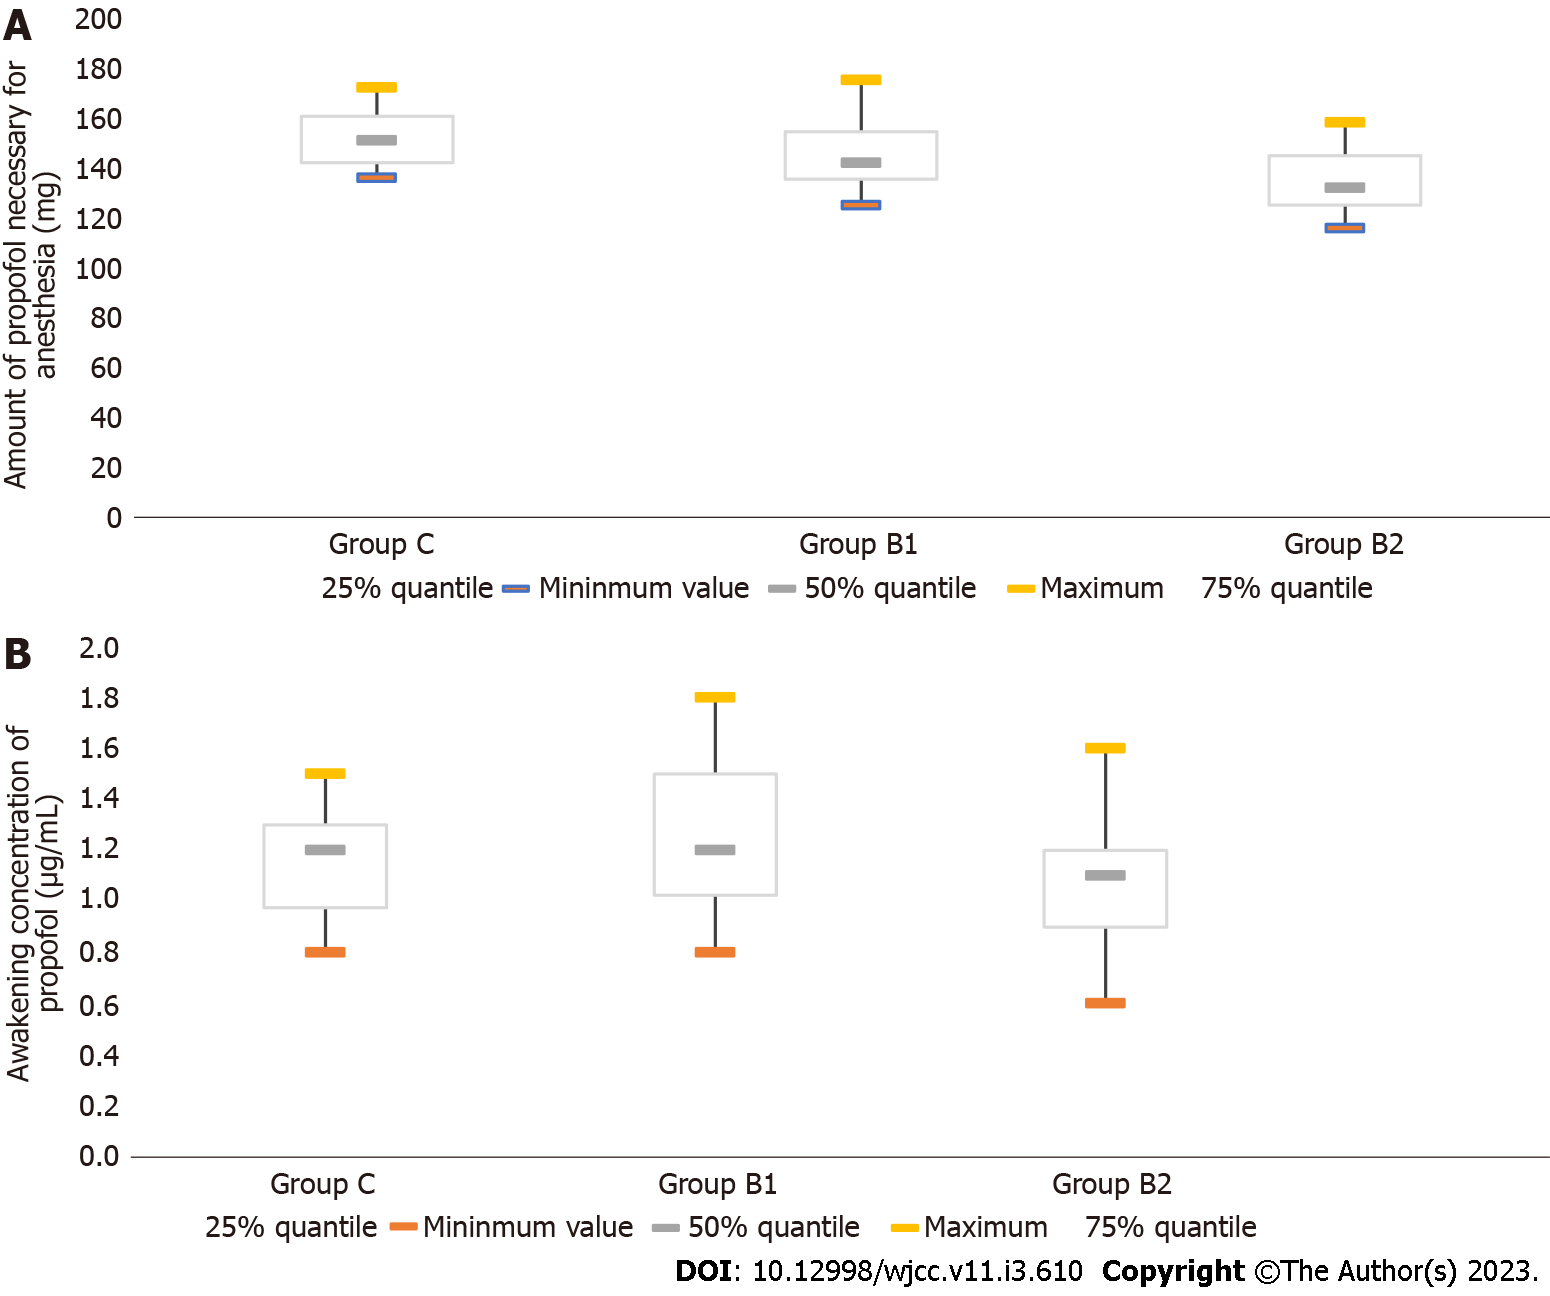
Figure 2 Bar graphs for the amount of propofol used during the sedated colonoscopy and the awakening concentration of propofol in each group.
A: The amount of propofol used during the sedated colonoscopy in each group; B: The awakening concentration of propofol in each group. The amount of propofol used for the sedated colonoscopic procedure and the awakening concentration of propofol in group C, group B1 and group B2 are illustrated in the bar graphs. The lowest mean amount of propofol used for sedated colonoscopic procedures was observed in group B2, and there was a significant difference among the groups. The wakening concentration of propofol was defined as the effect-site concentration of propofol in association with eye opening in response to verbal command. The mean awakening concentration of propofol was lower in group B2, when compared to group B1.
Figure 3 The mean arterial pressure and heart rate at different time points during the procedures in each group are shown.
A: The mean arterial pressure at different time points during the procedures in each group; B: The heart rate at different time points during the procedures in each group. The mean arterial pressure (MAP) and heart rate (HR) were examined at the following four time points: prior to anesthesia (T0), immediately after consciousness disappeared in response to induction of anesthesia (T1), when the colonoscope reached the ileocecal region (T2), and when consciousness was regained (T3). The MAP represents the average arterial pressure throughout one cardiac cycle, with a normal range of 70-110 mmHg. The MAP values at time points T1 and T2 were significantly lower in group C, when compared to groups B1 and B2 (P < 0.05). The HR value at time point of T1 was significantly lower in group C, when compared to groups B1 and B2 (P < 0.05).
- Citation: Guo F, Sun DF, Feng Y, Yang L, Li JL, Sun ZL. Efficacy and safety of propofol target-controlled infusion combined with butorphanol for sedated colonoscopy. World J Clin Cases 2023; 11(3): 610-620
- URL: https://www.wjgnet.com/2307-8960/full/v11/i3/610.htm
- DOI: https://dx.doi.org/10.12998/wjcc.v11.i3.610


