©The Author(s) 2023.
World J Clin Cases. Sep 16, 2023; 11(26): 6132-6146
Published online Sep 16, 2023. doi: 10.12998/wjcc.v11.i26.6132
Published online Sep 16, 2023. doi: 10.12998/wjcc.v11.i26.6132
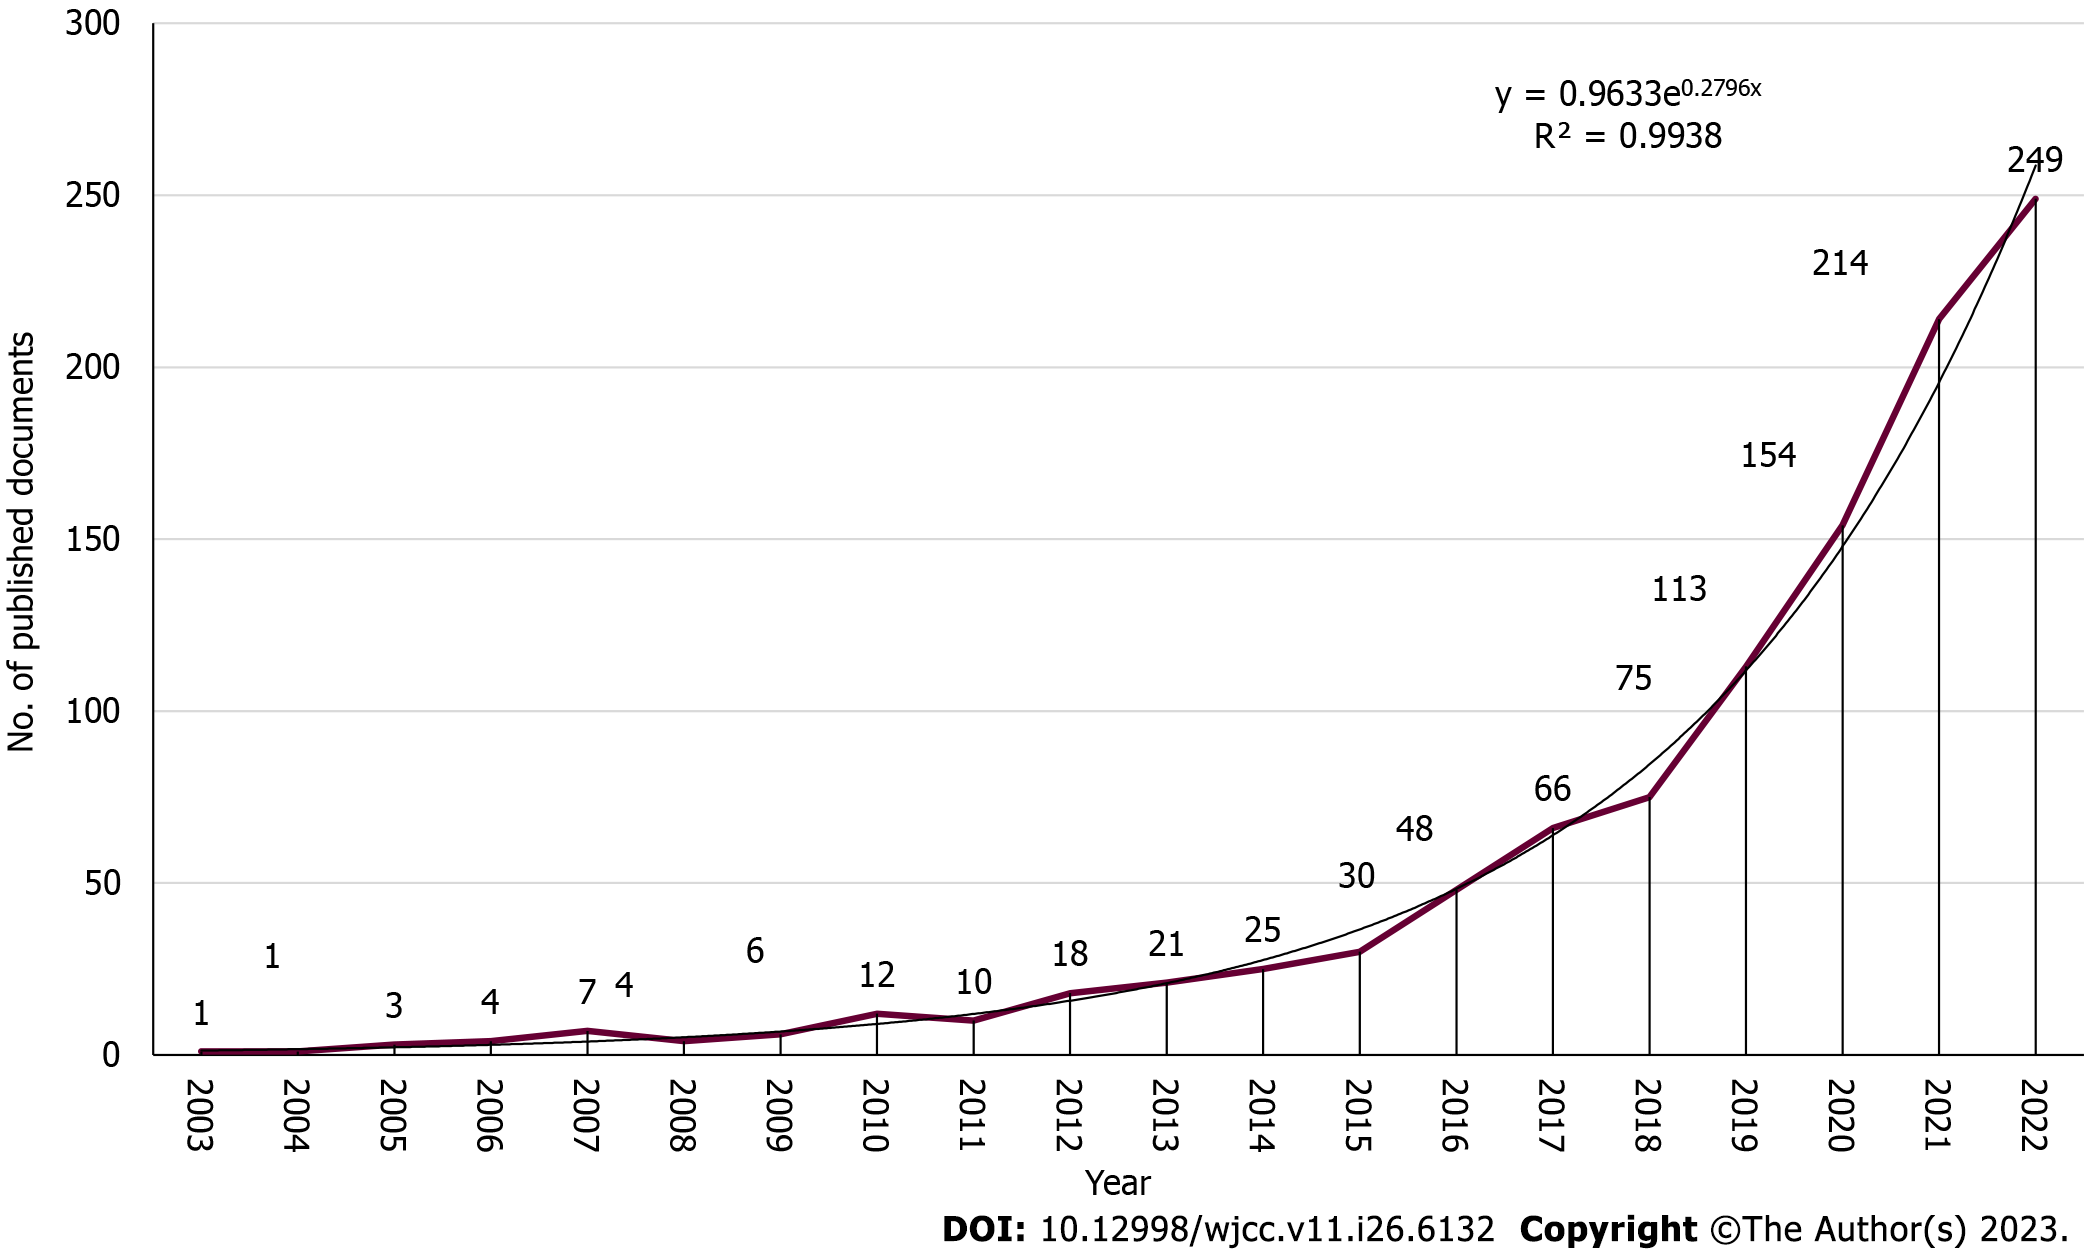
Figure 1 Trends in publications for research related to randomized controlled trials involving gut microbiota from 2003 to 2022.
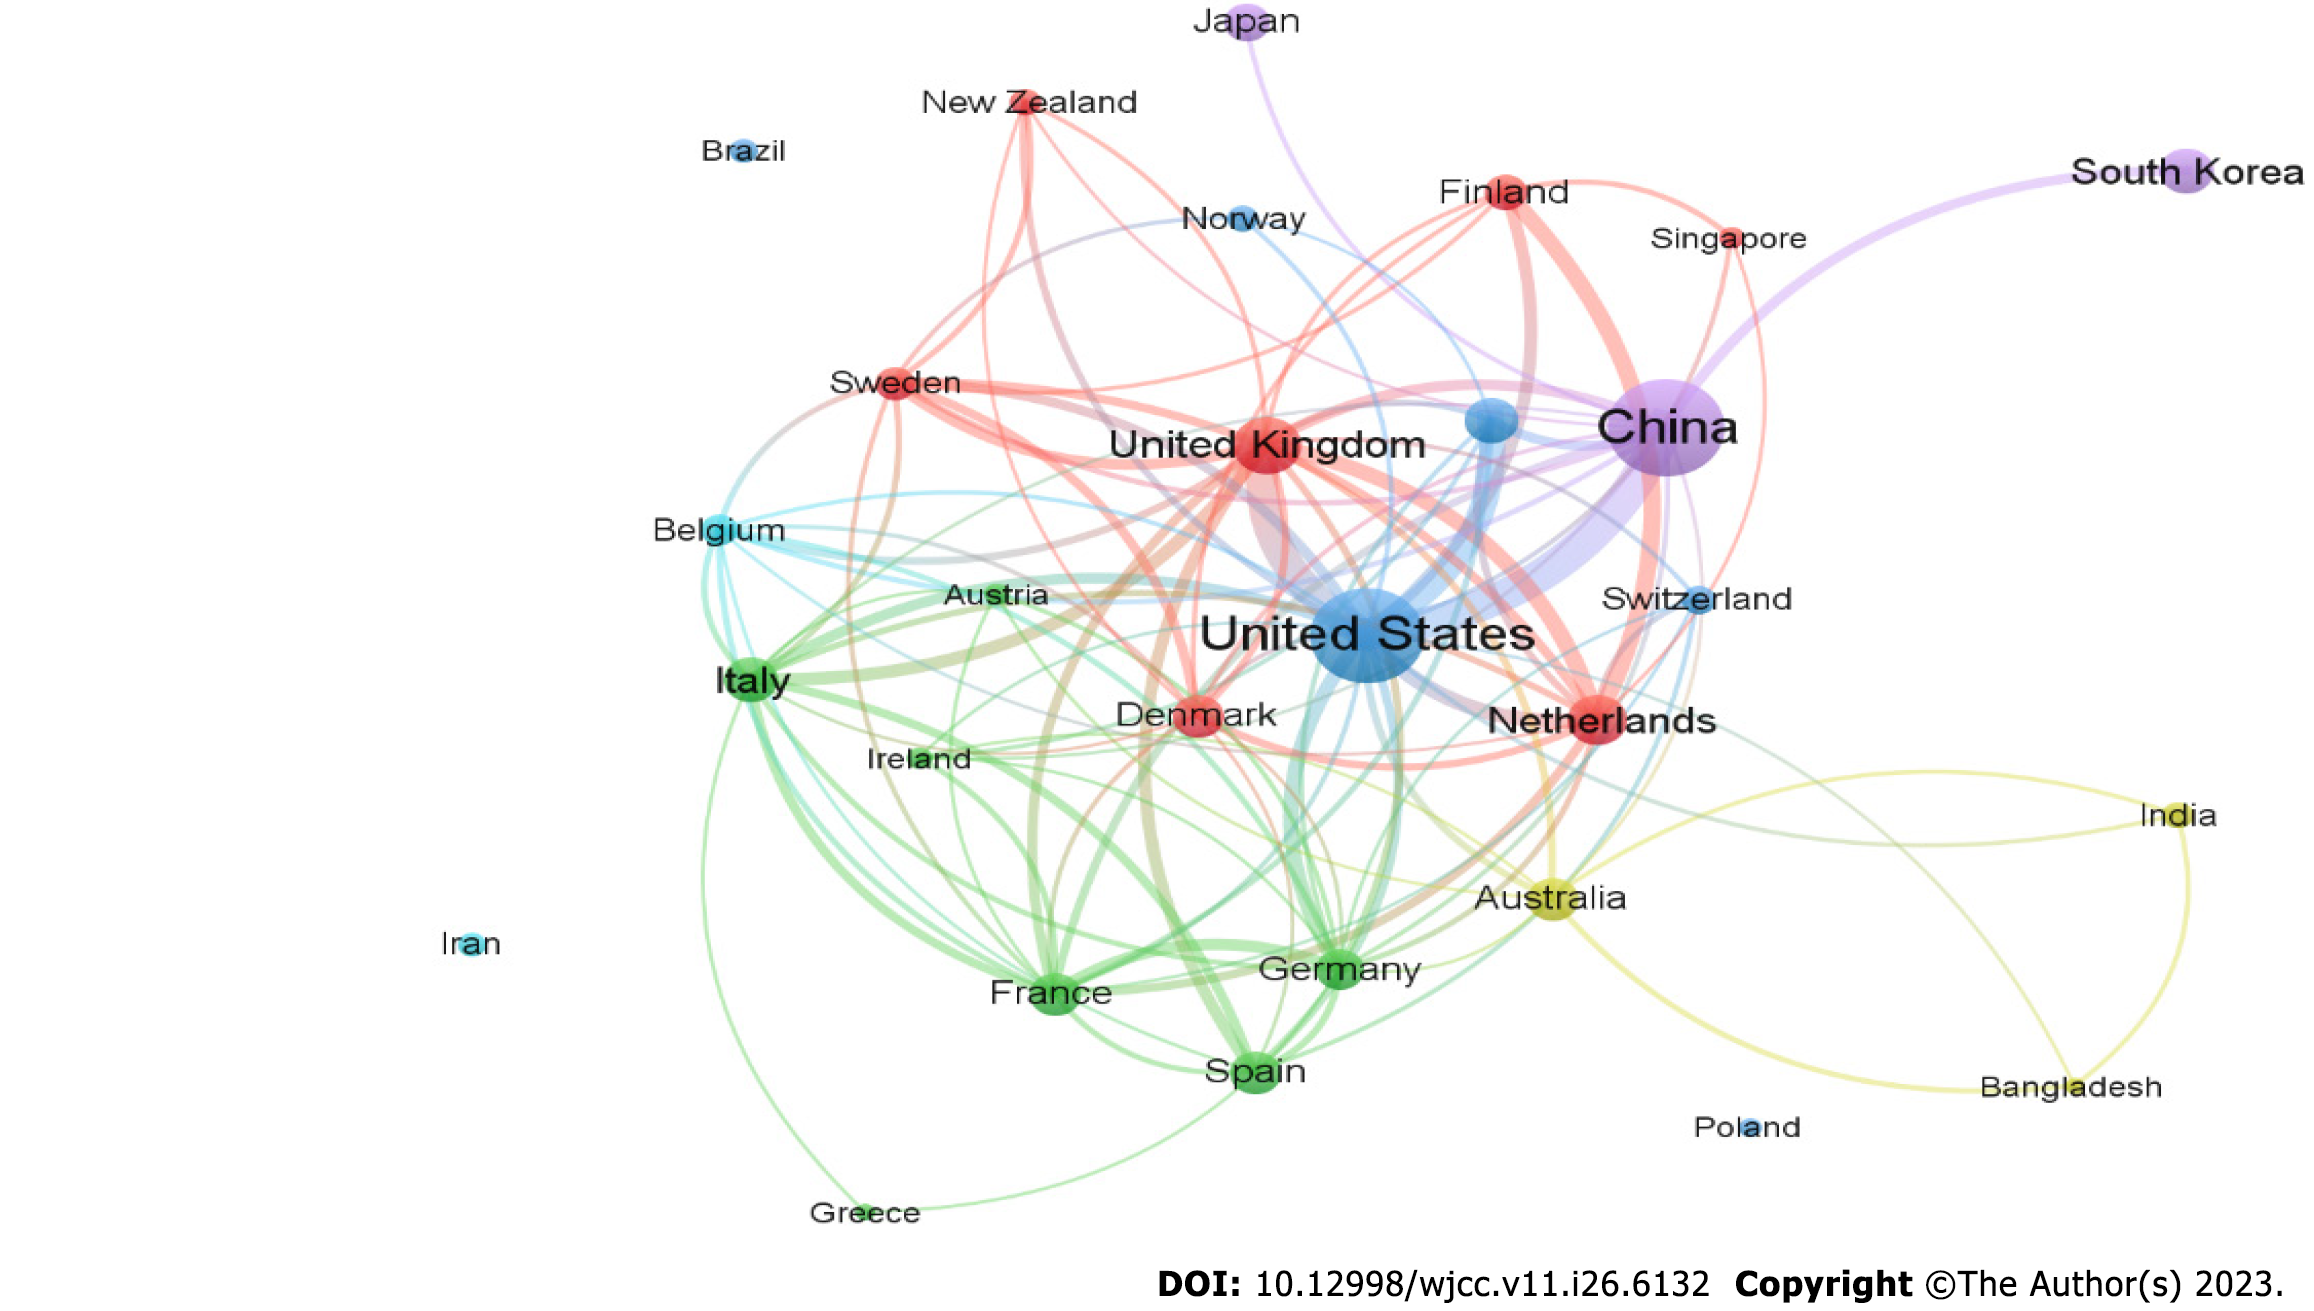
Figure 2 International (cross-country) research collaboration between countries with a minimum contribution of 10 articles.
There were 28 countries on the map. VOSviewer software version 1.6.19 was used to create the map.
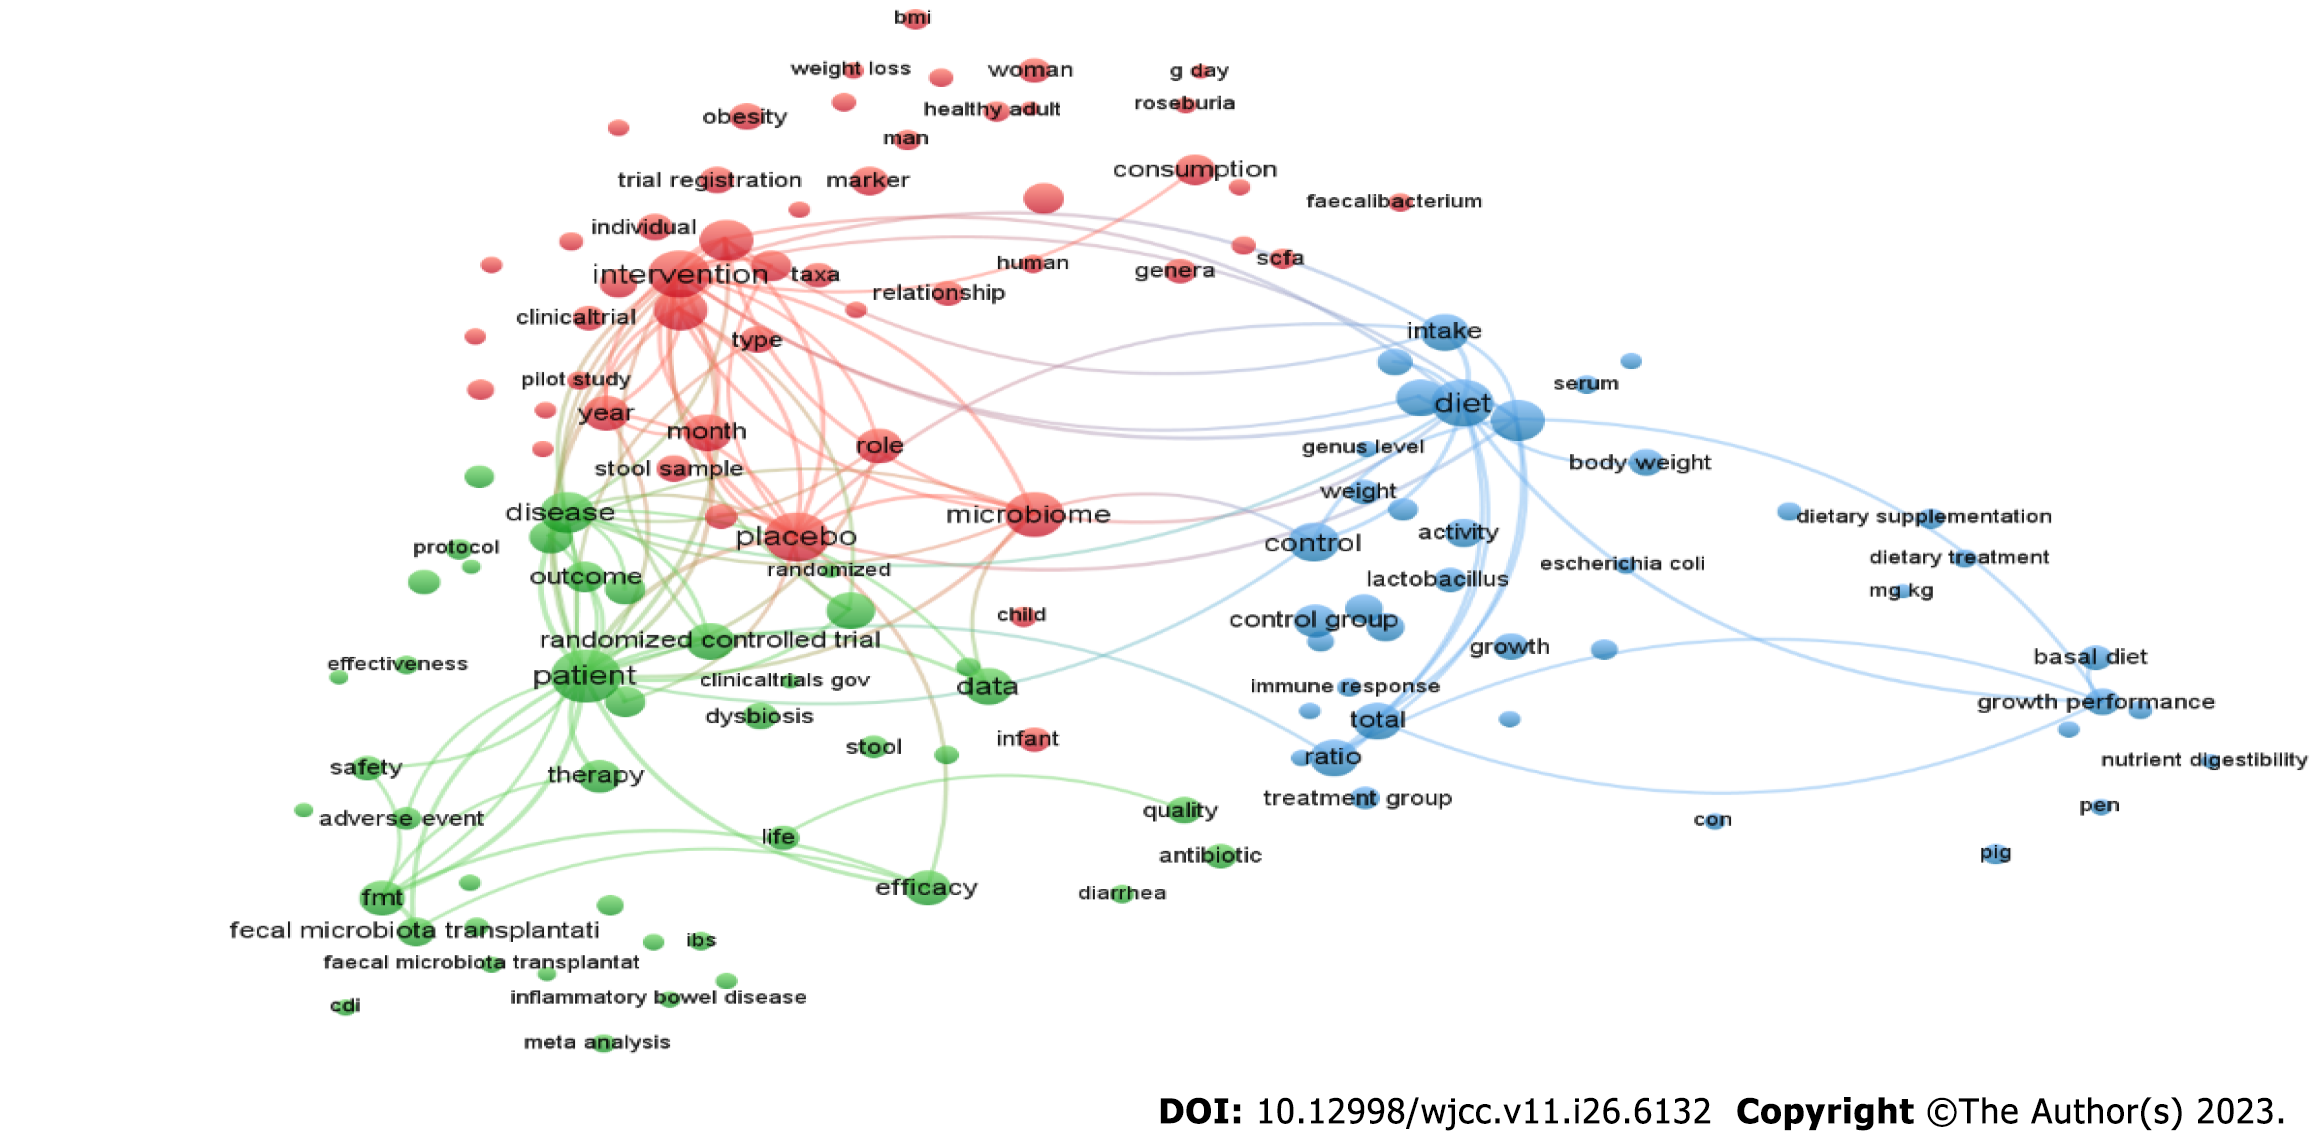
Figure 3 Map generated by VOSviewer 1.
6.19 depicting clusters derived from title and abstract term analysis. Cluster variety is indicated by different colors, while term occurrence frequency is represented by circle size. VOSviewer software version 1.6.19 was used to create the map.
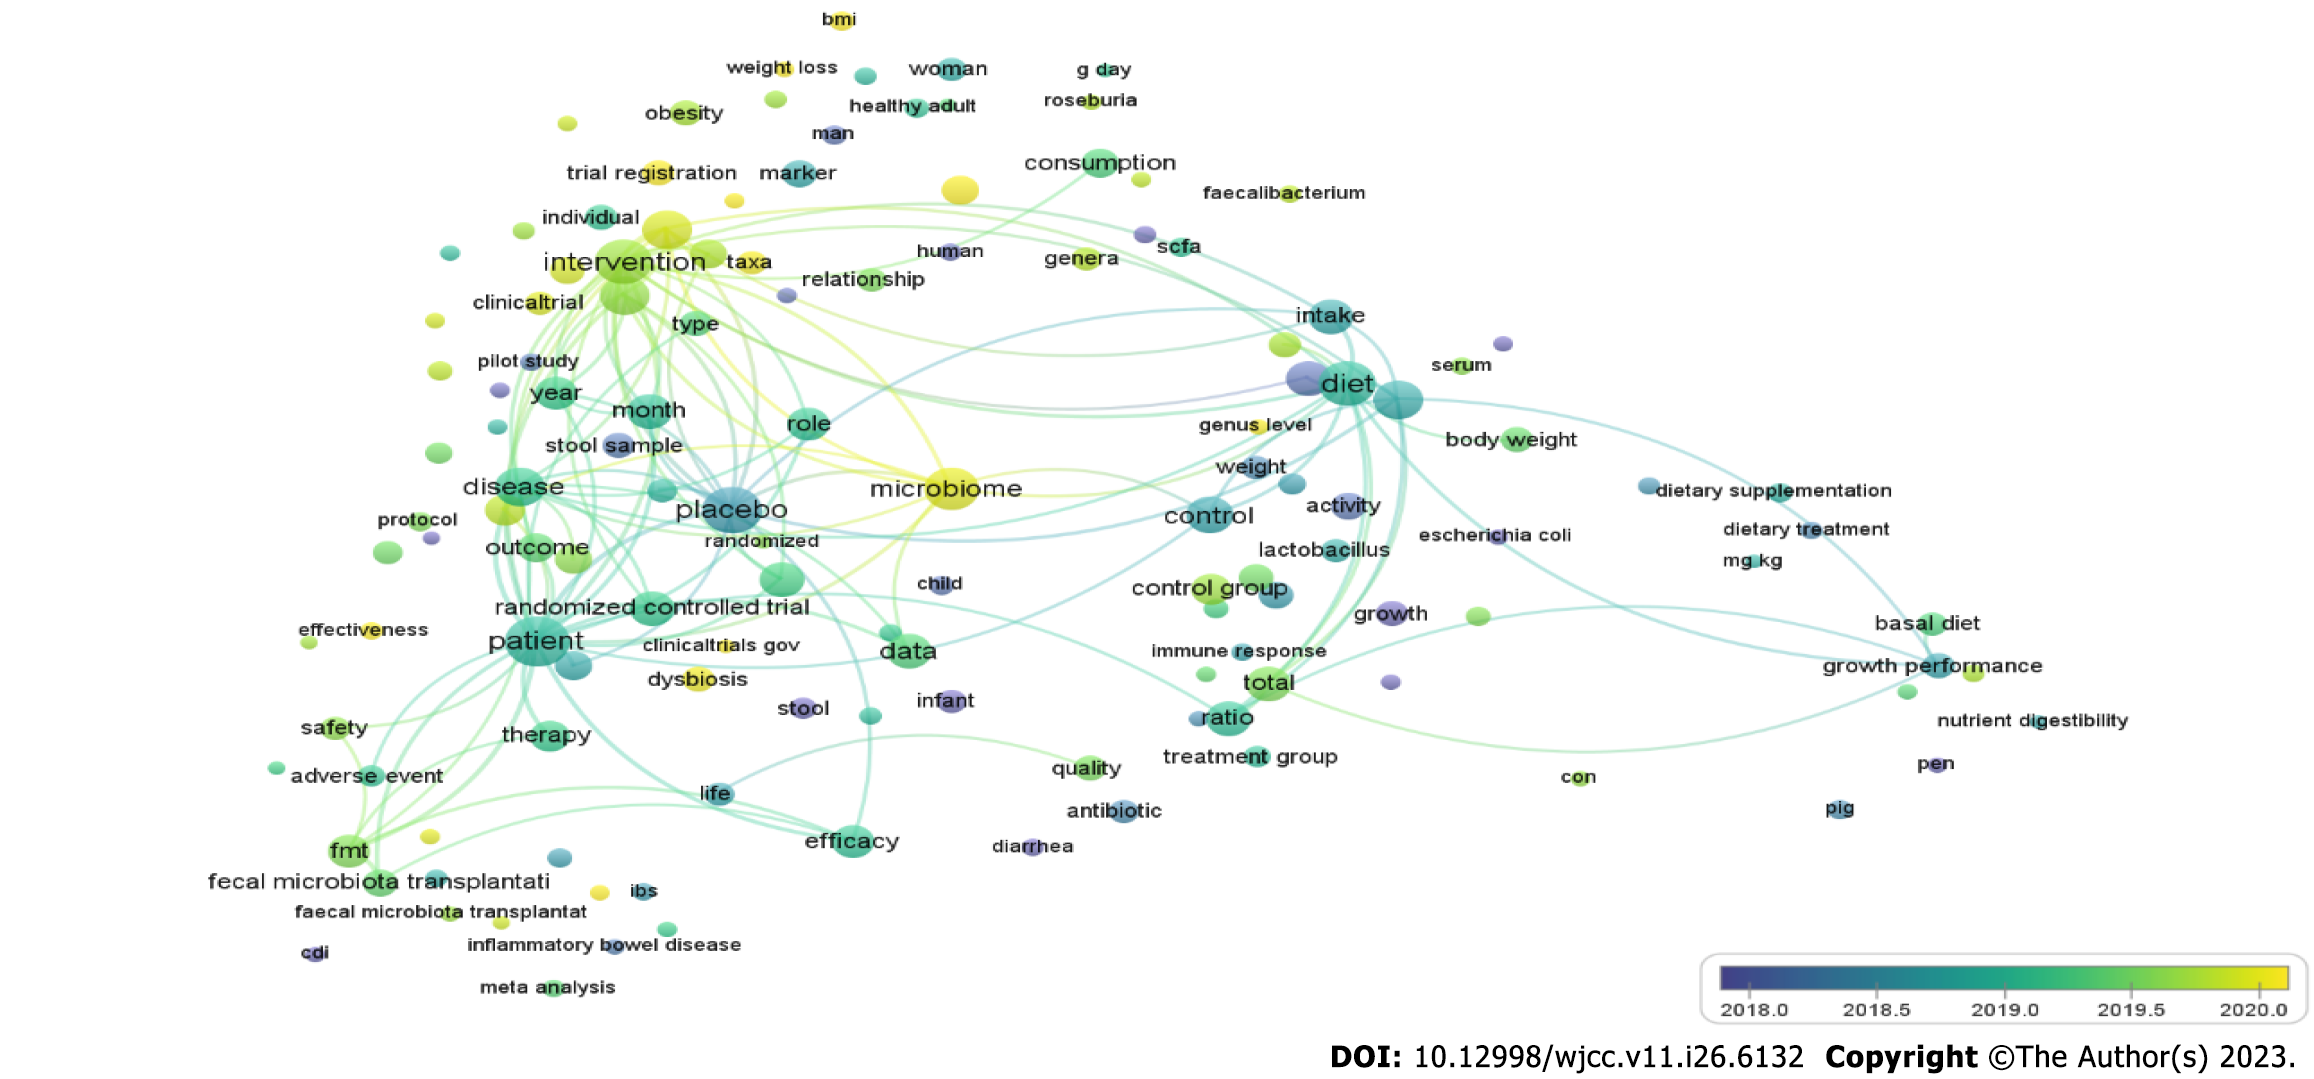
Figure 4 Visualization of term co-occurrence as an overlay.
This map depicts how frequently specific terms have appeared in titles and abstracts over time, with blue nodes representing earlier occurrences and yellow nodes representing later occurrences. VOSviewer software version 1.6.19 was used to create the map.
- Citation: Zyoud SH, Shakhshir M, Abushanab AS, Koni A, Shahwan M, Jairoun AA, Abu Taha A, Al-Jabi SW. Unveiling the hidden world of gut health: Exploring cutting-edge research through visualizing randomized controlled trials on the gut microbiota. World J Clin Cases 2023; 11(26): 6132-6146
- URL: https://www.wjgnet.com/2307-8960/full/v11/i26/6132.htm
- DOI: https://dx.doi.org/10.12998/wjcc.v11.i26.6132


