Copyright
©The Author(s) 2023.
World J Clin Cases. Jun 26, 2023; 11(18): 4377-4383
Published online Jun 26, 2023. doi: 10.12998/wjcc.v11.i18.4377
Published online Jun 26, 2023. doi: 10.12998/wjcc.v11.i18.4377
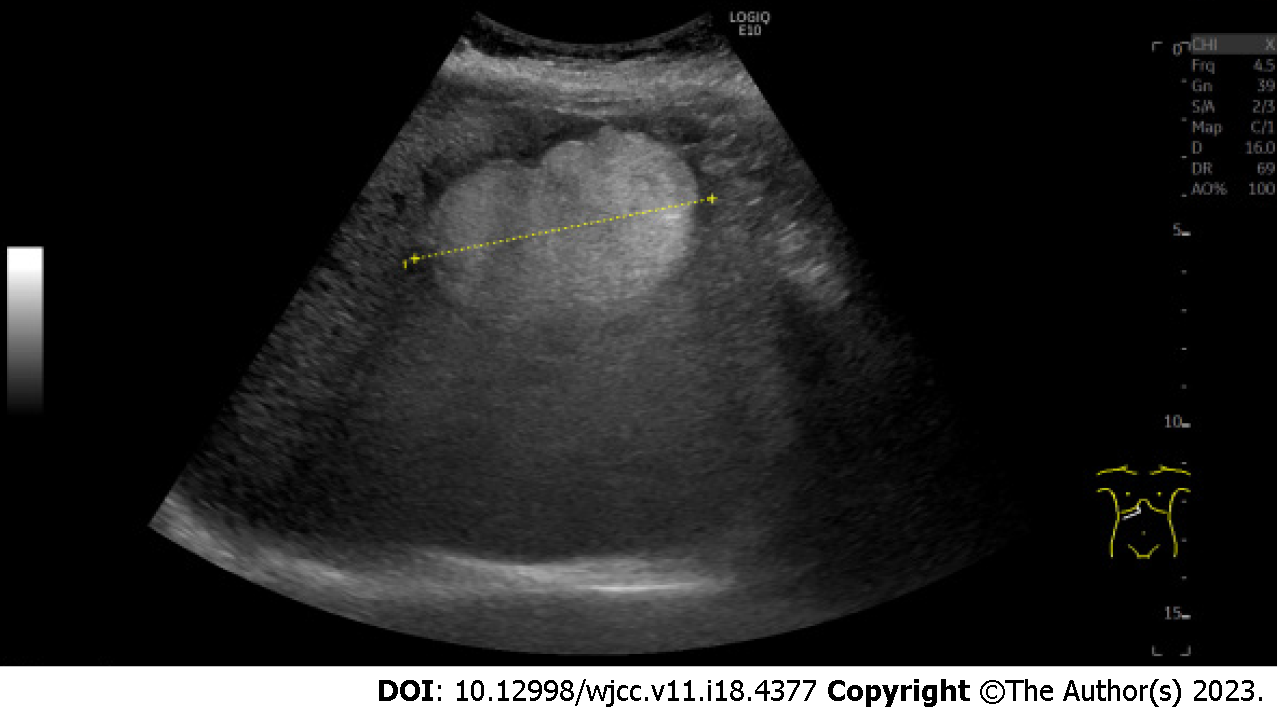
Figure 1 Ultrasonography.
The image shows the hyperechoic lesion in segment 8 of the liver. The lesion size was 79 mm × 73 mm × 52 mm.
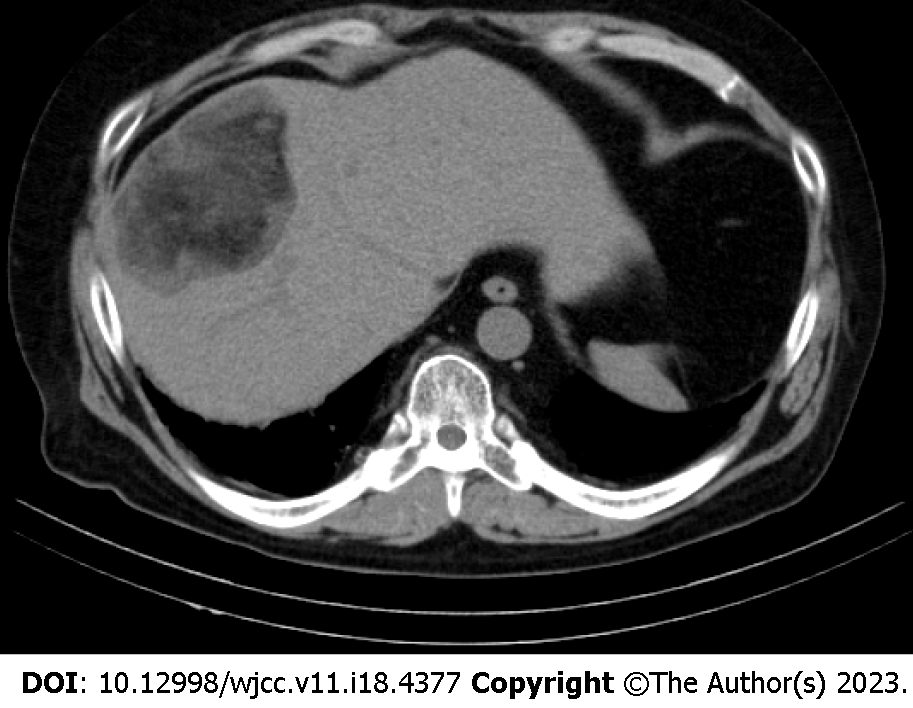
Figure 2 Plain computed tomography.
The image shows a well-defined lesion in segment 8 of the liver. The center of the lesion mainly shows the fat density and the peripheral area of the lesion shows hypodensity.
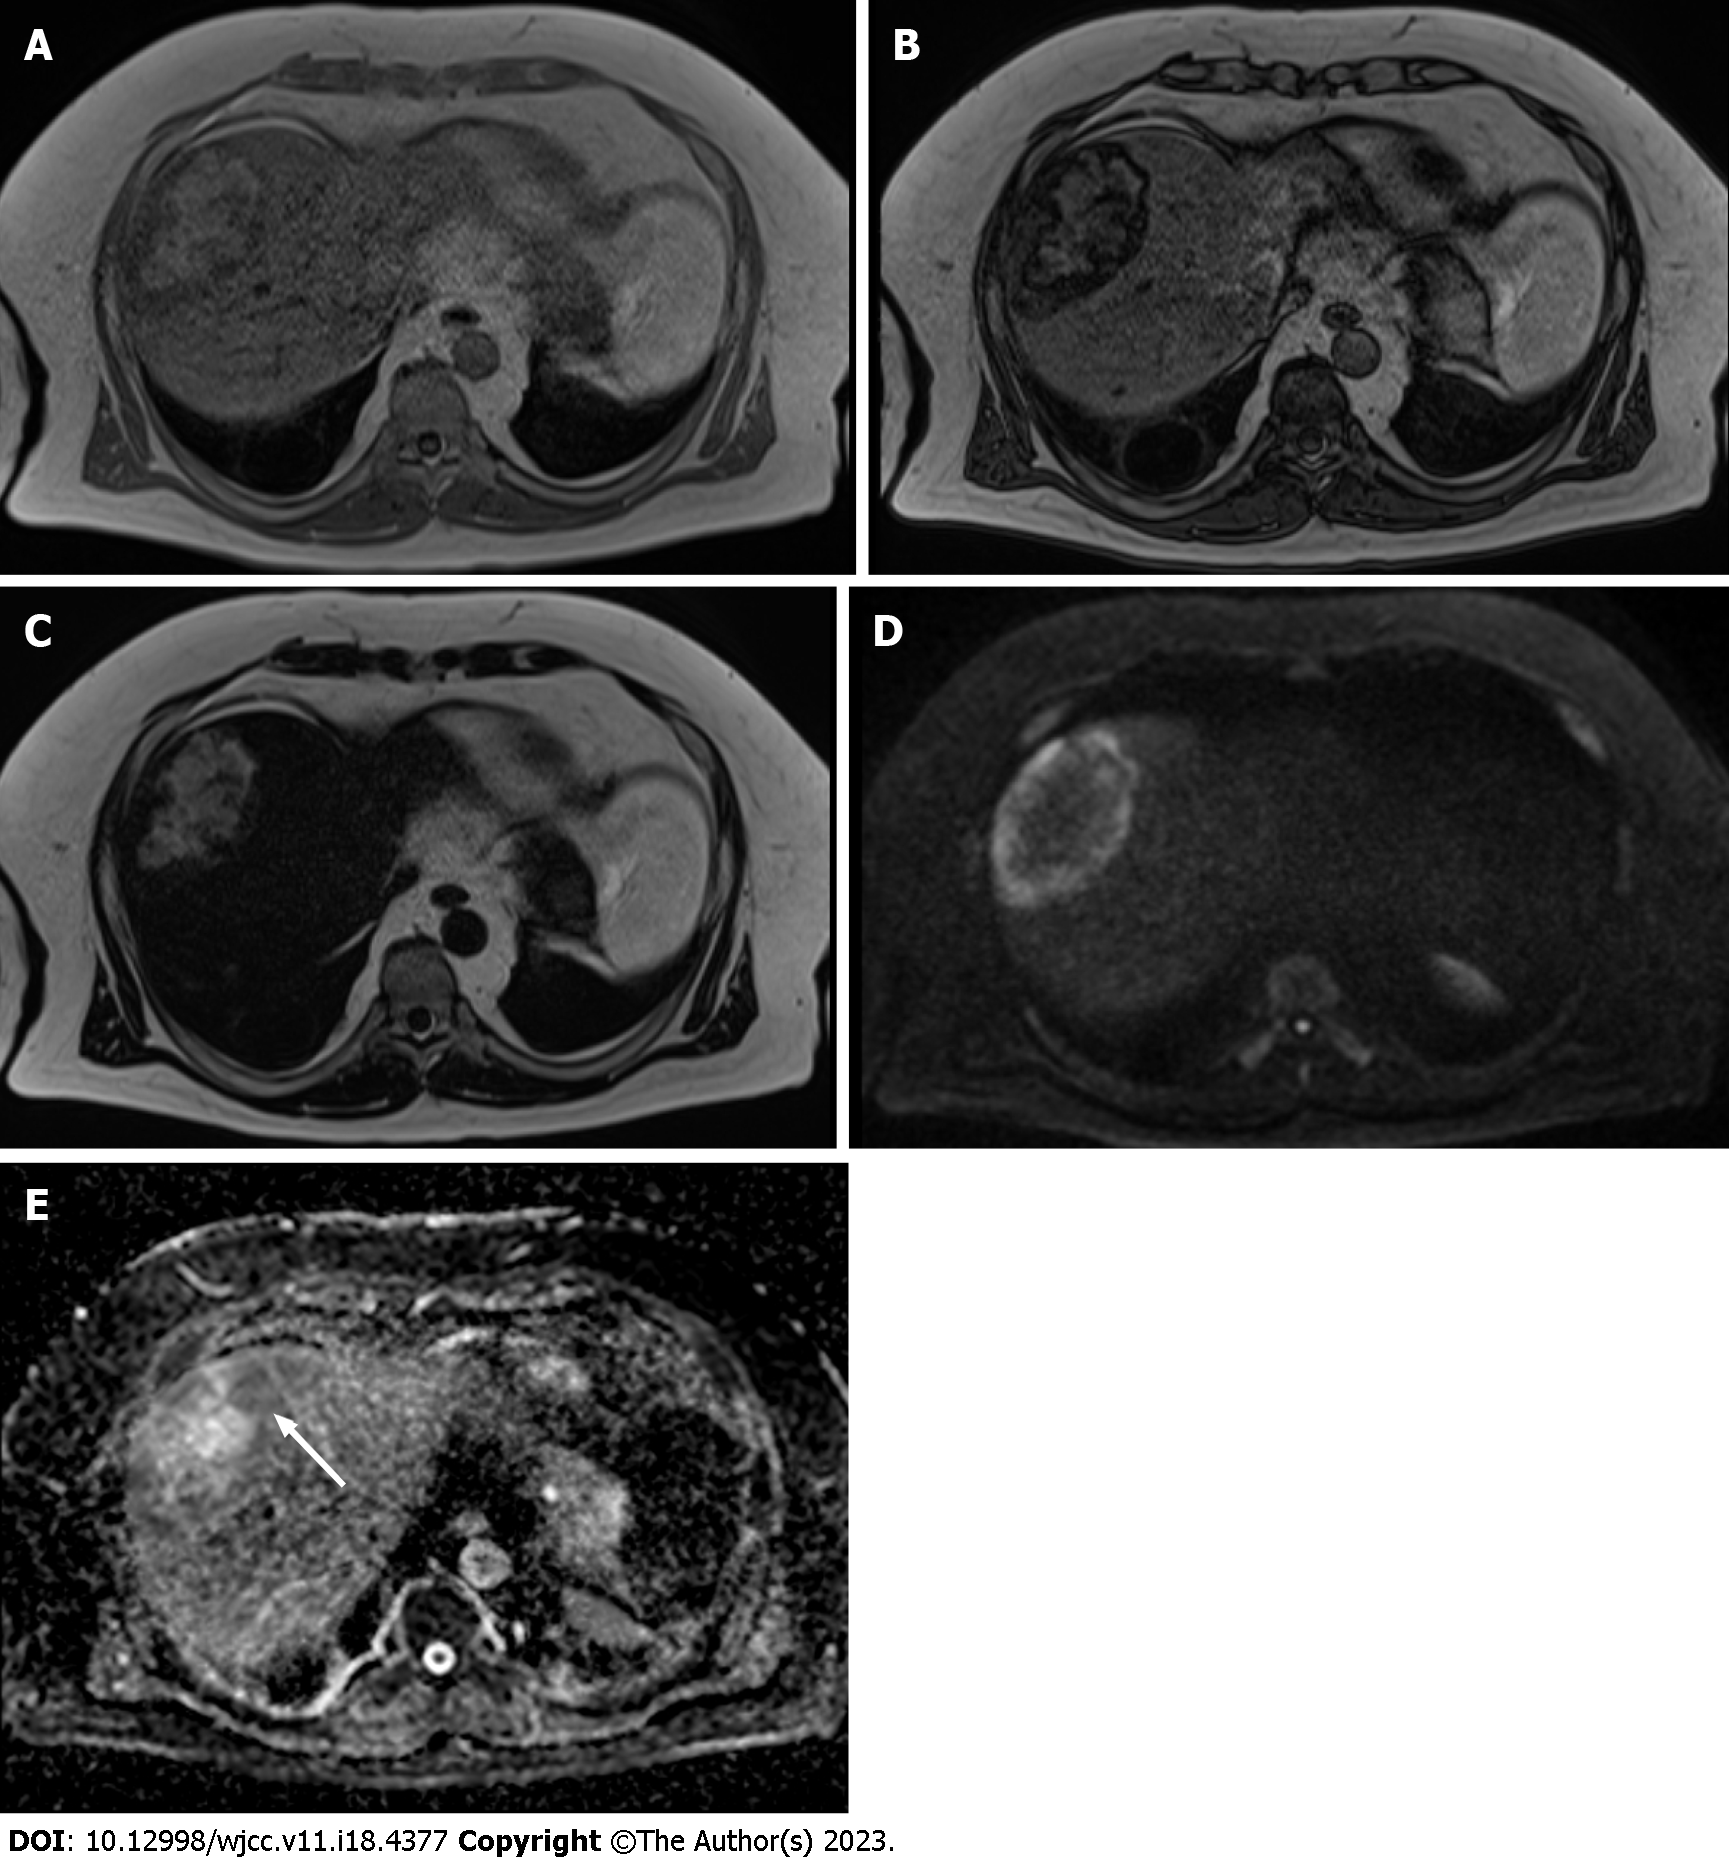
Figure 3 Plain magnetic resonance imaging.
A: T1-weighted in phase image shows hyperintensity at the center area and hypointensity at the peripheral area of the lesion compared with the background liver parenchyma; B: T1-weighted opposed phase image demonstrates an apparent signal drop in the peripheral area of the lesion and a heterogeneous signal drop at the center of the lesion; C: T2-weighted image shows the lesion’s center hyperintensity equal to subcutaneous fat. The peripheral area of the lesion shows mild hyperintensity; D: Diffusion-weighted image shows the peripheral area of the lesion and hyperintensity on the diffusion-weighted image. The center of the fat-dominant area shows hypointensity; E: Apparent diffusion coefficient map shows the peripheral area of the lesion hypointensity (white arrow). This indicates that the diffusion in this area is restricted.
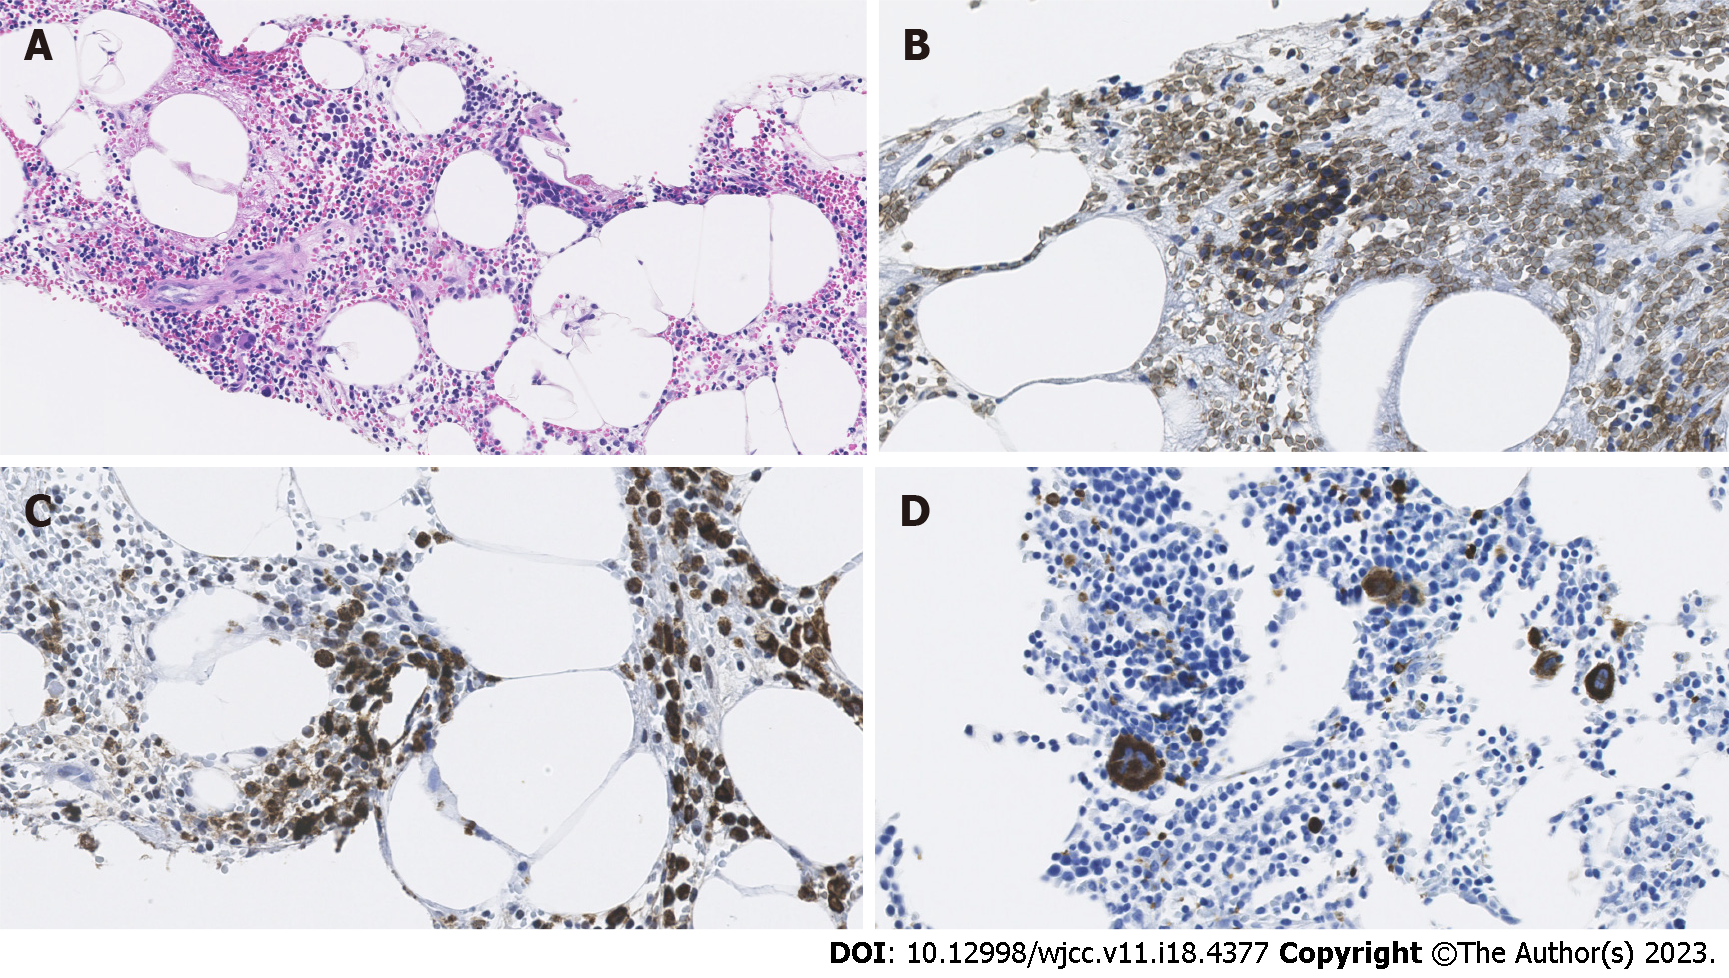
Figure 4 Histological and immunohistochemical findings.
A: Hematoxylin and eosin staining with × 400 magnification of the specimen from biopsy to the lesion shows the adipose tissue (lucent areas) within the hematopoietic element; B: Glycophorin C staining with × 400 magnification field indicates the presence of erythroid cells (brown stained); C: Myeloperoxidase staining with × 400 magnification field shows the presence of myelocytes (brown stained); D: CD61 immunostaining with × 400 magnification field demonstrates the presence of megakaryocytes (brown stained).
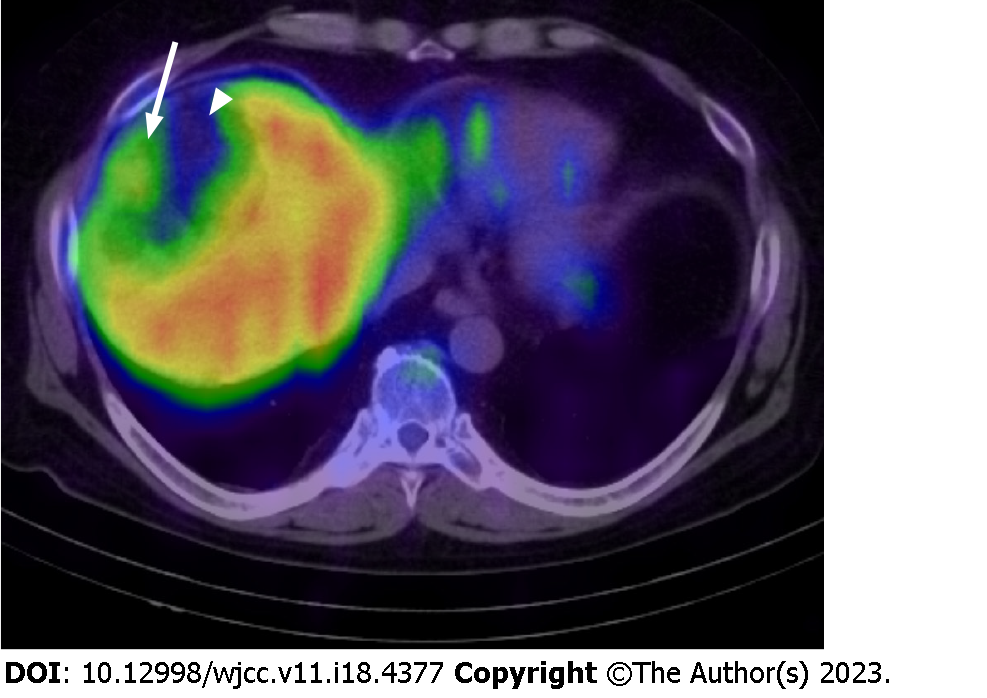
Figure 5 A fusion image with single photon emission computed tomography using 111InCl3 and computed tomography.
The image shows the mild accumulation of radiopharmaceutical in the peripheral area of the lesion (white arrow). Poor accumulation was observed in the central region corresponding to the dominant fat area (white arrowhead).
- Citation: Sato A, Saito K, Abe K, Sugimoto K, Nagao T, Sukeda A, Yunaiyama D. Indium chloride bone marrow scintigraphy for hepatic myelolipoma: A case report. World J Clin Cases 2023; 11(18): 4377-4383
- URL: https://www.wjgnet.com/2307-8960/full/v11/i18/4377.htm
- DOI: https://dx.doi.org/10.12998/wjcc.v11.i18.4377


