Copyright
©The Author(s) 2023.
World J Clin Cases. Jun 16, 2023; 11(17): 3967-3975
Published online Jun 16, 2023. doi: 10.12998/wjcc.v11.i17.3967
Published online Jun 16, 2023. doi: 10.12998/wjcc.v11.i17.3967
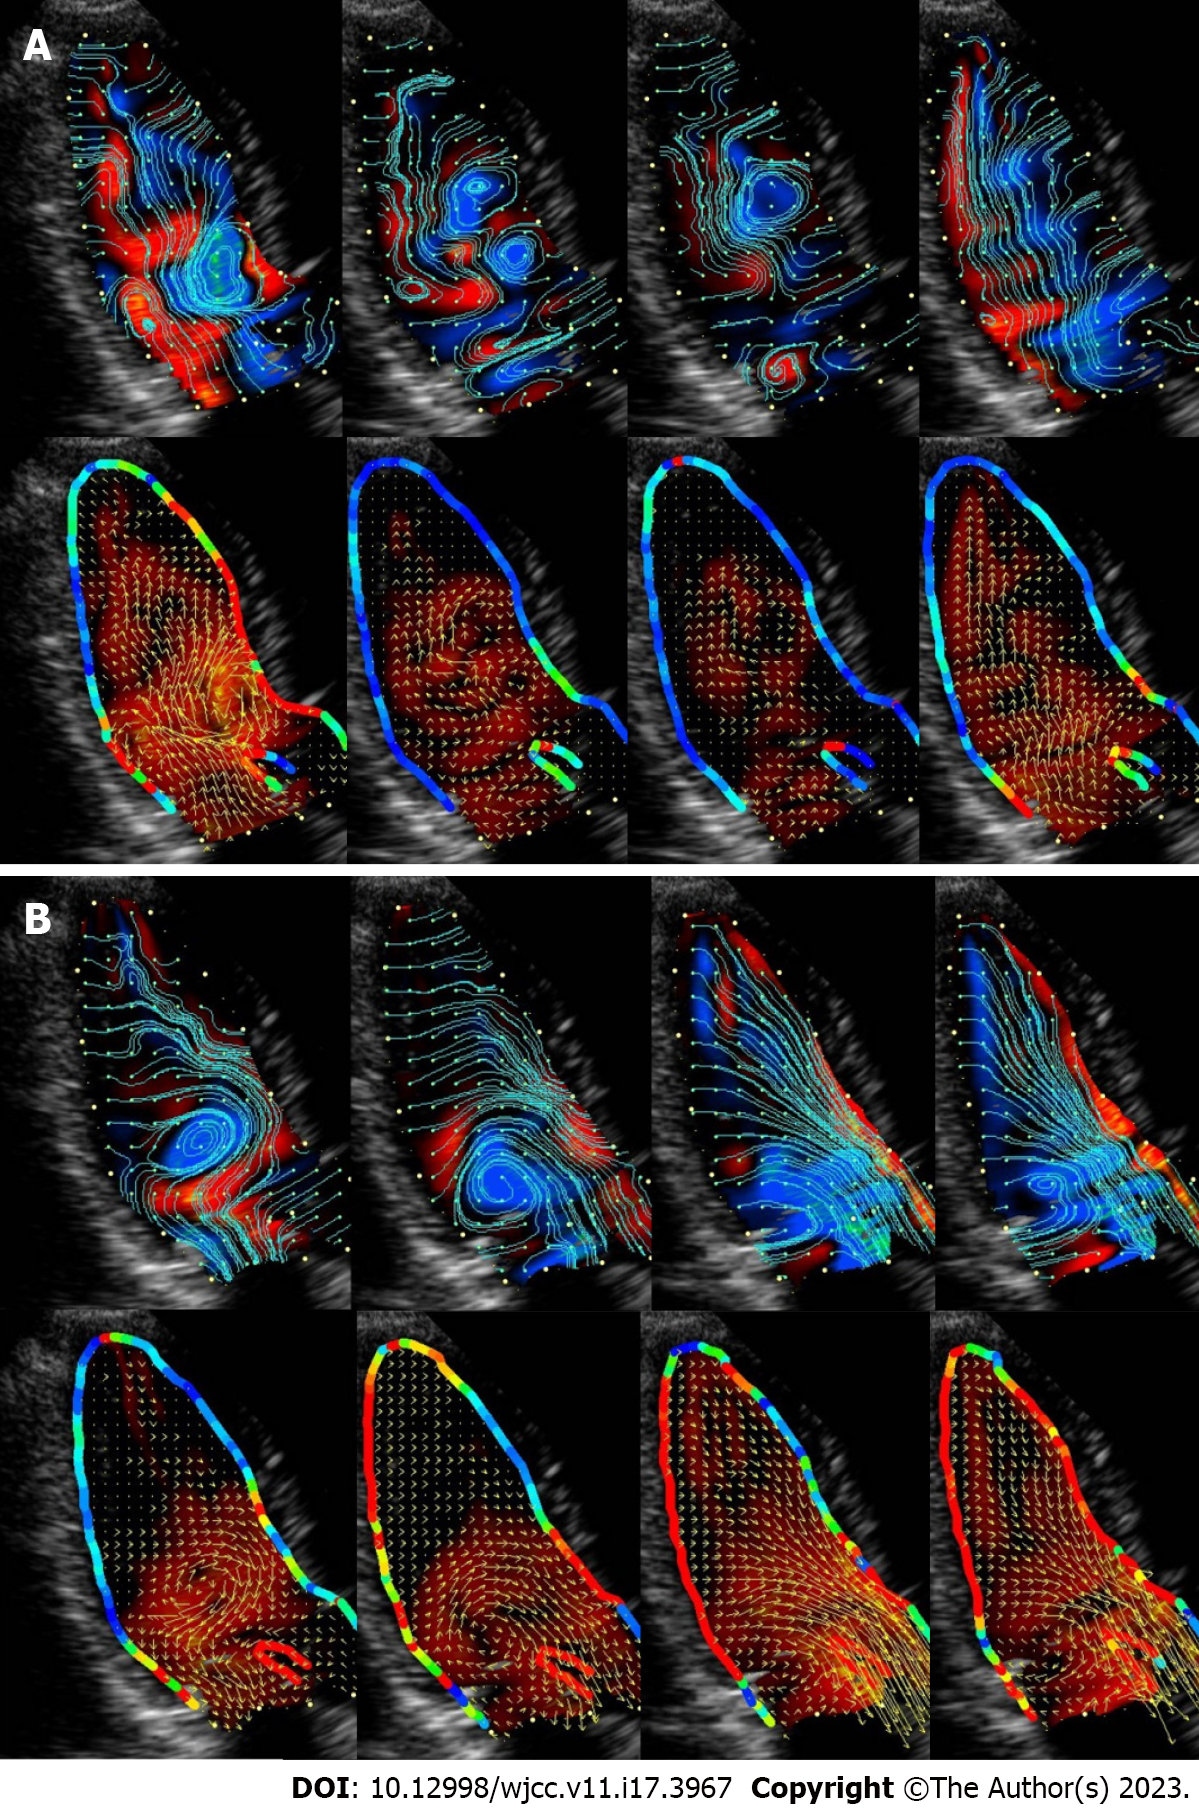
Figure 1 Left ventricular blood vector flow mapping in a patient with normal cardiac function.
The vector flow mapping displays laminar and turbulent flow in the cardiovascular system without contrast, clearly showing the temporal phase, location, size, number, direction of rotation, and intensity of vortices. Flow and circulation maps are shown above each image, and ventricular wall shear stress and vector maps are shown below each image. A: Diastolic phase in healthy individuals with normal cardiac function; B: Systolic phase in healthy individuals with normal cardiac function.
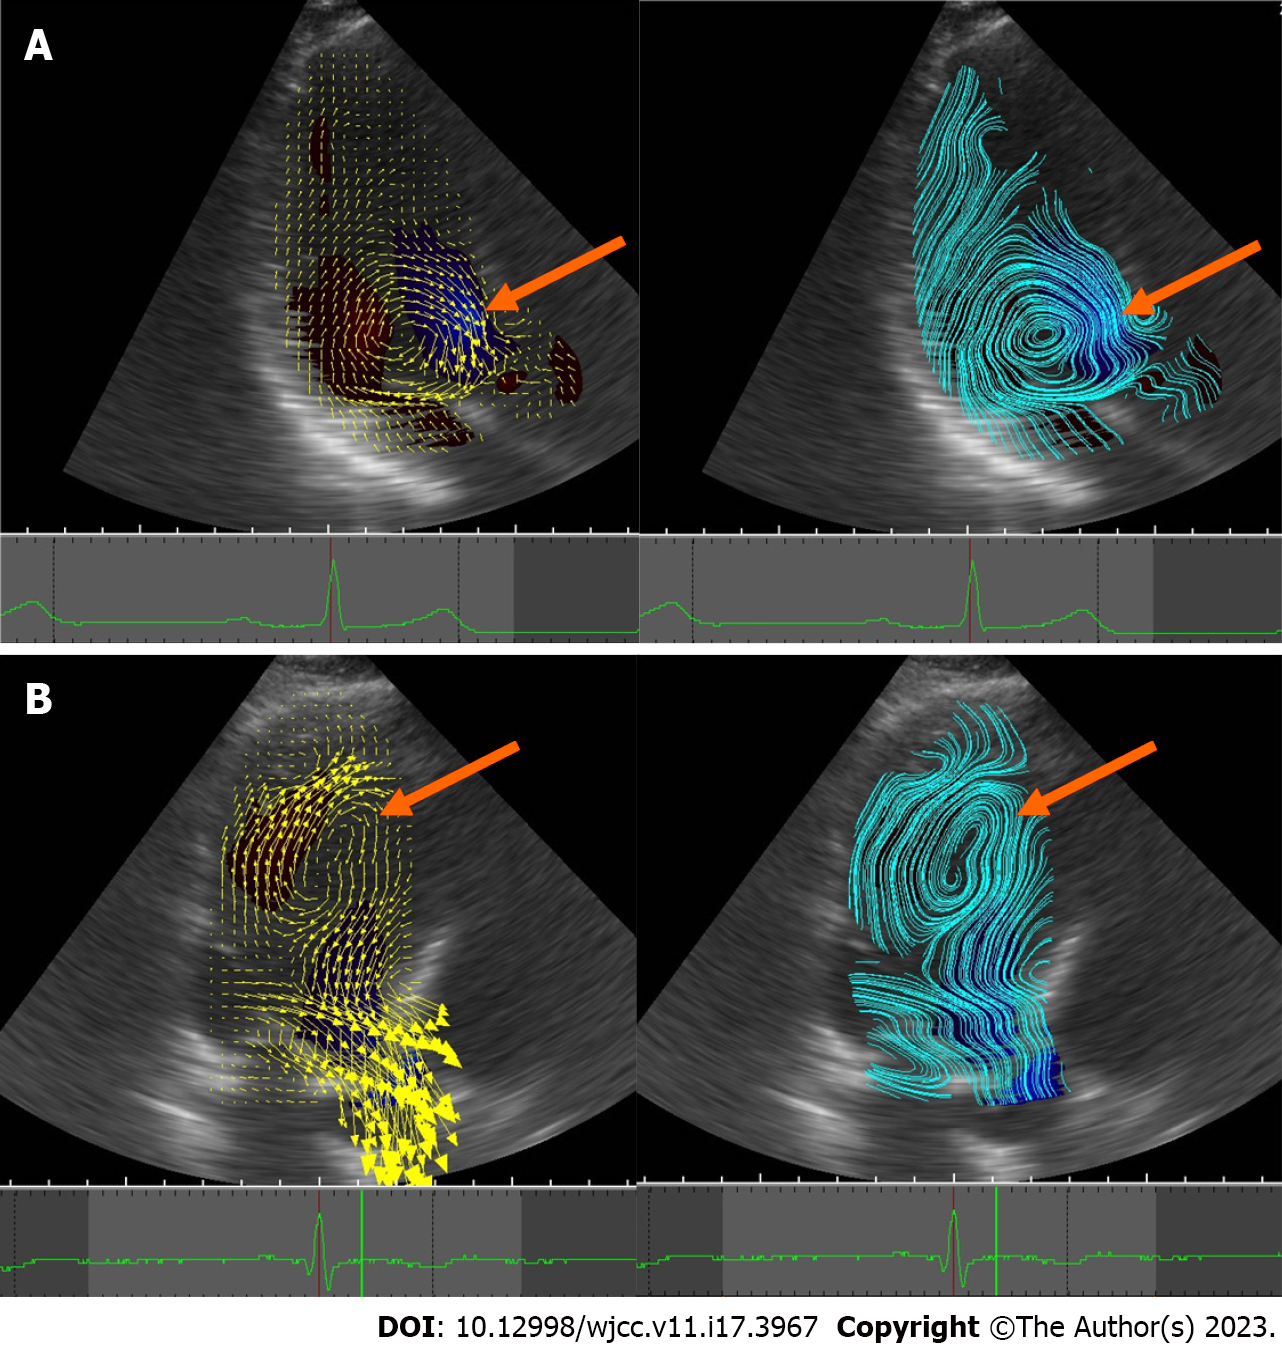
Figure 2 Left intraventricular vortex flow in a patient with normal cardiac function and a patient with dilated cardiomyopathy.
A: An effective vortex in a patient with normal cardiac function. The vortex is formed in the left heart cavity during isovolumic systole to redirect the blood flow and avoid the energy loss caused by the deceleration and then acceleration of the blood flow impulse; B: An ineffective vortex found in dilated cardiomyopathy: The vortex is also present during systole in dilated heart disease, making ejection less efficient.
Figure 3 Relative pressure imaging of isovolumic systolic to early diastolic phase.
The first image shows early systole with apical high pressure ejection flow. The second image shows isovolumic diastole. The left ventricle dilates with mitral valve closure, and low pressure appears at the apex. The third image shows early diastole with continued apical low pressure.
- Citation: Zheng AS, Yu HX. Value of clinical applications of differential pressure and relative pressure imaging in the left ventricle. World J Clin Cases 2023; 11(17): 3967-3975
- URL: https://www.wjgnet.com/2307-8960/full/v11/i17/3967.htm
- DOI: https://dx.doi.org/10.12998/wjcc.v11.i17.3967


