Copyright
©The Author(s) 2022.
World J Clin Cases. Mar 6, 2022; 10(7): 2174-2183
Published online Mar 6, 2022. doi: 10.12998/wjcc.v10.i7.2174
Published online Mar 6, 2022. doi: 10.12998/wjcc.v10.i7.2174
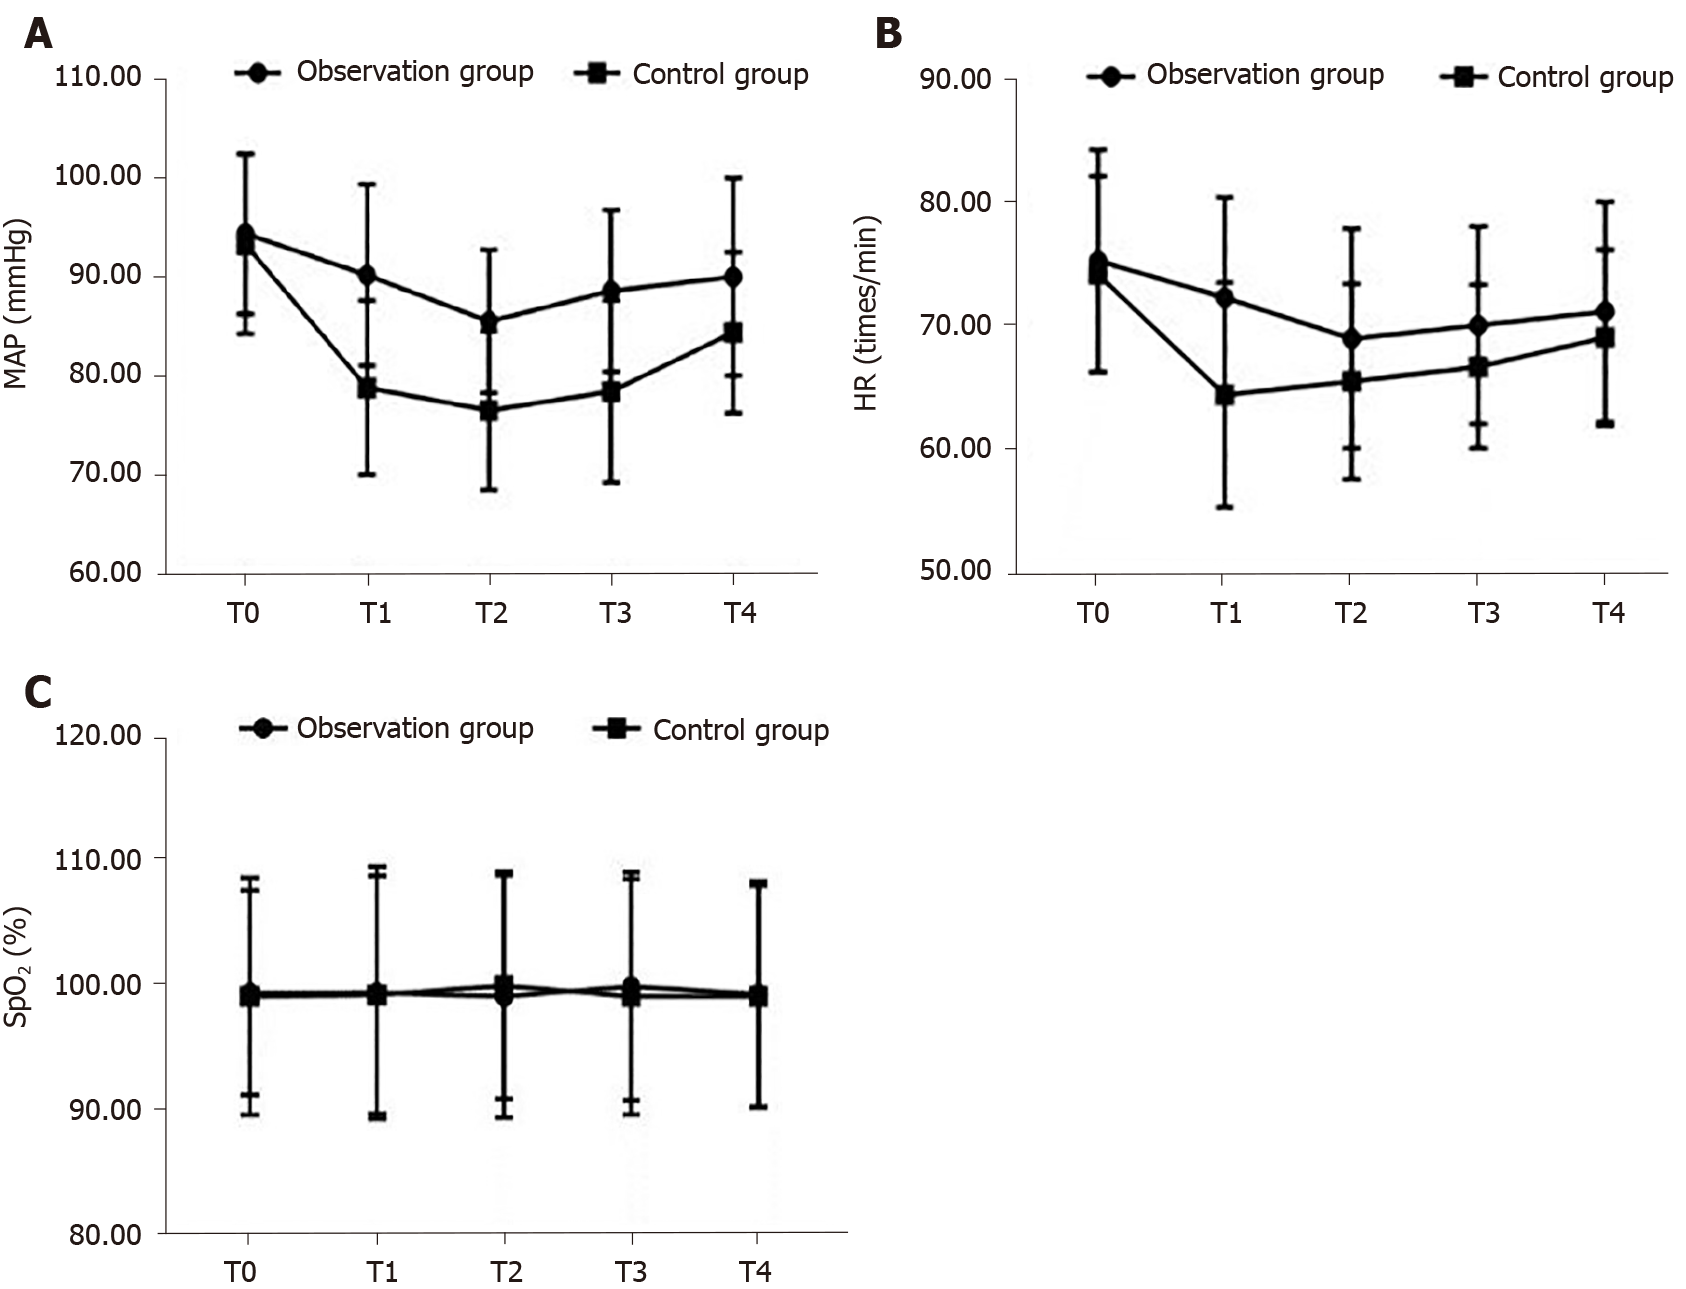
Figure 1 Trend diagram of mean arterial pressure, heart rate and partial pressure of oxygen for different time periods.
A: Mean arterial pressure; B: Heart rate; C: Partial pressure of oxygen. The time periods are shown on the horizontal axis. T0: Baseline time; T1: 15 min after anesthesia; T2: After induction of intubation; T3: 5 min after skin incision; T4: Before extubation; MAP: Mean arterial pressure; HR: Heart rate; SpO2: Partial pressure of oxygen.
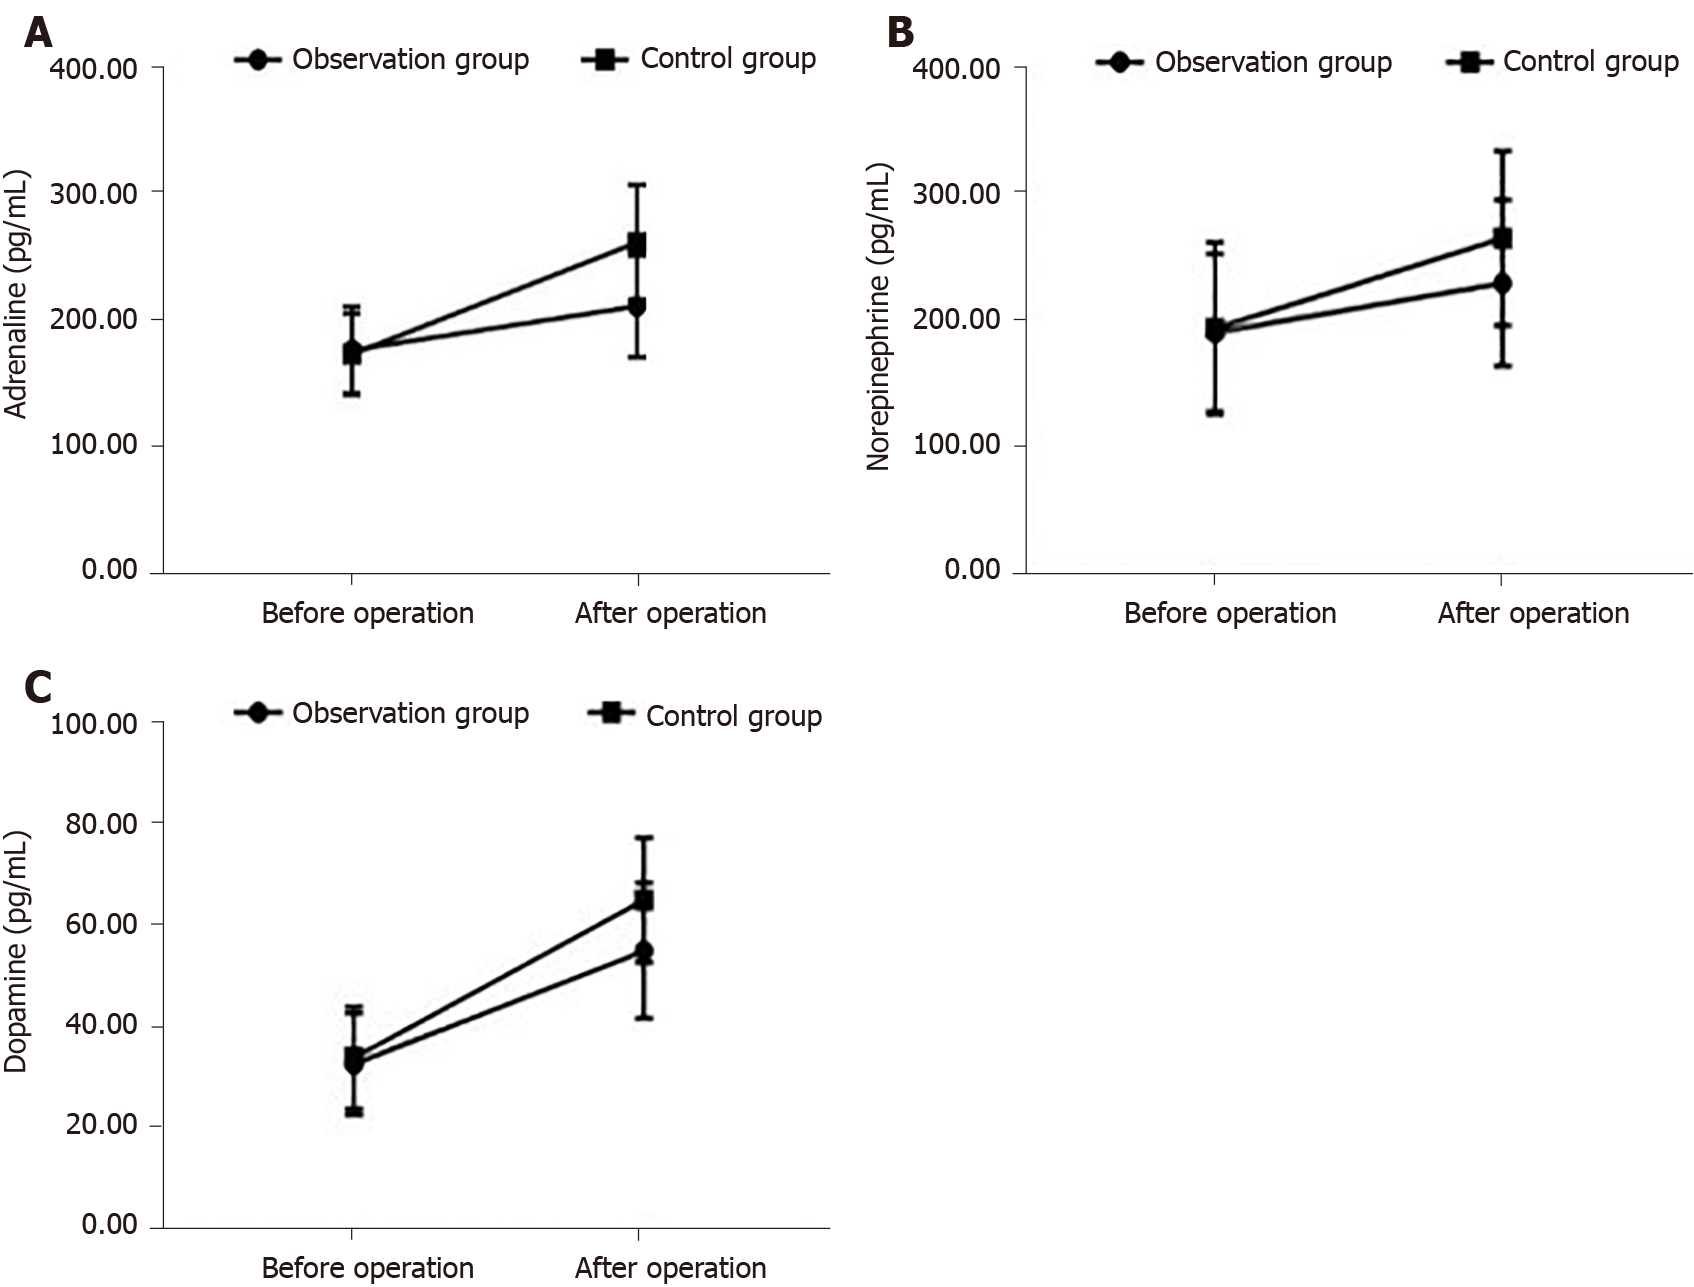
Figure 2 Between-group comparison of the pre- and postoperative stress response indices.
A: Levels of adrenaline, B: Levels of norepinephrine; C: Levels of dopamine.
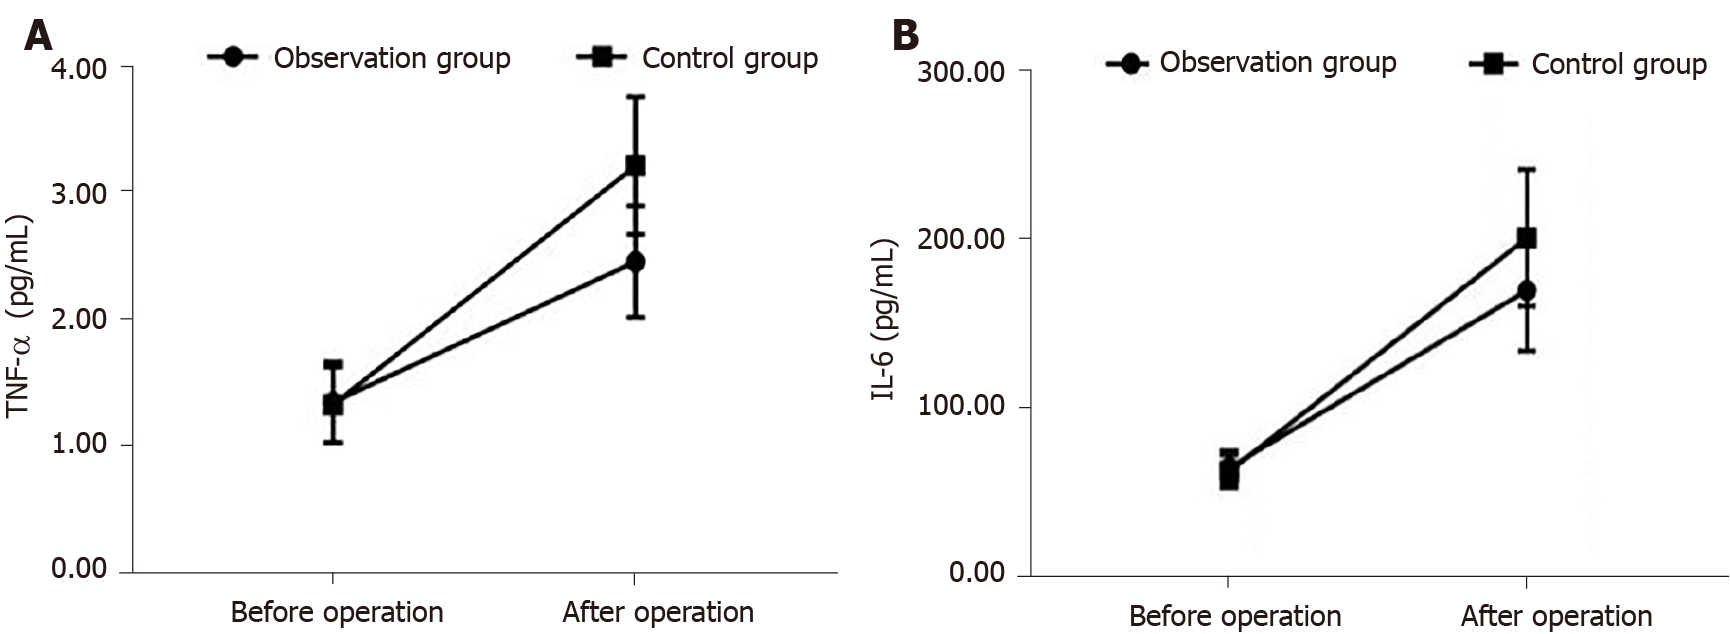
Figure 3 Between-group comparison of the pre- and postoperative inflammatory response markers.
A: Levels of tumor necrosis factor-α; B: Levels of interleukin-6. TNF-α: Tumor necrosis factor-α; IL-6: Interleukin-6.
- Citation: Zhen SQ, Jin M, Chen YX, Li JH, Wang H, Chen HX. Ultrasound-guided paravertebral nerve block anesthesia on the stress response and hemodynamics among lung cancer patients. World J Clin Cases 2022; 10(7): 2174-2183
- URL: https://www.wjgnet.com/2307-8960/full/v10/i7/2174.htm
- DOI: https://dx.doi.org/10.12998/wjcc.v10.i7.2174


