Copyright
©The Author(s) 2022.
World J Clin Cases. Dec 26, 2022; 10(36): 13364-13372
Published online Dec 26, 2022. doi: 10.12998/wjcc.v10.i36.13364
Published online Dec 26, 2022. doi: 10.12998/wjcc.v10.i36.13364
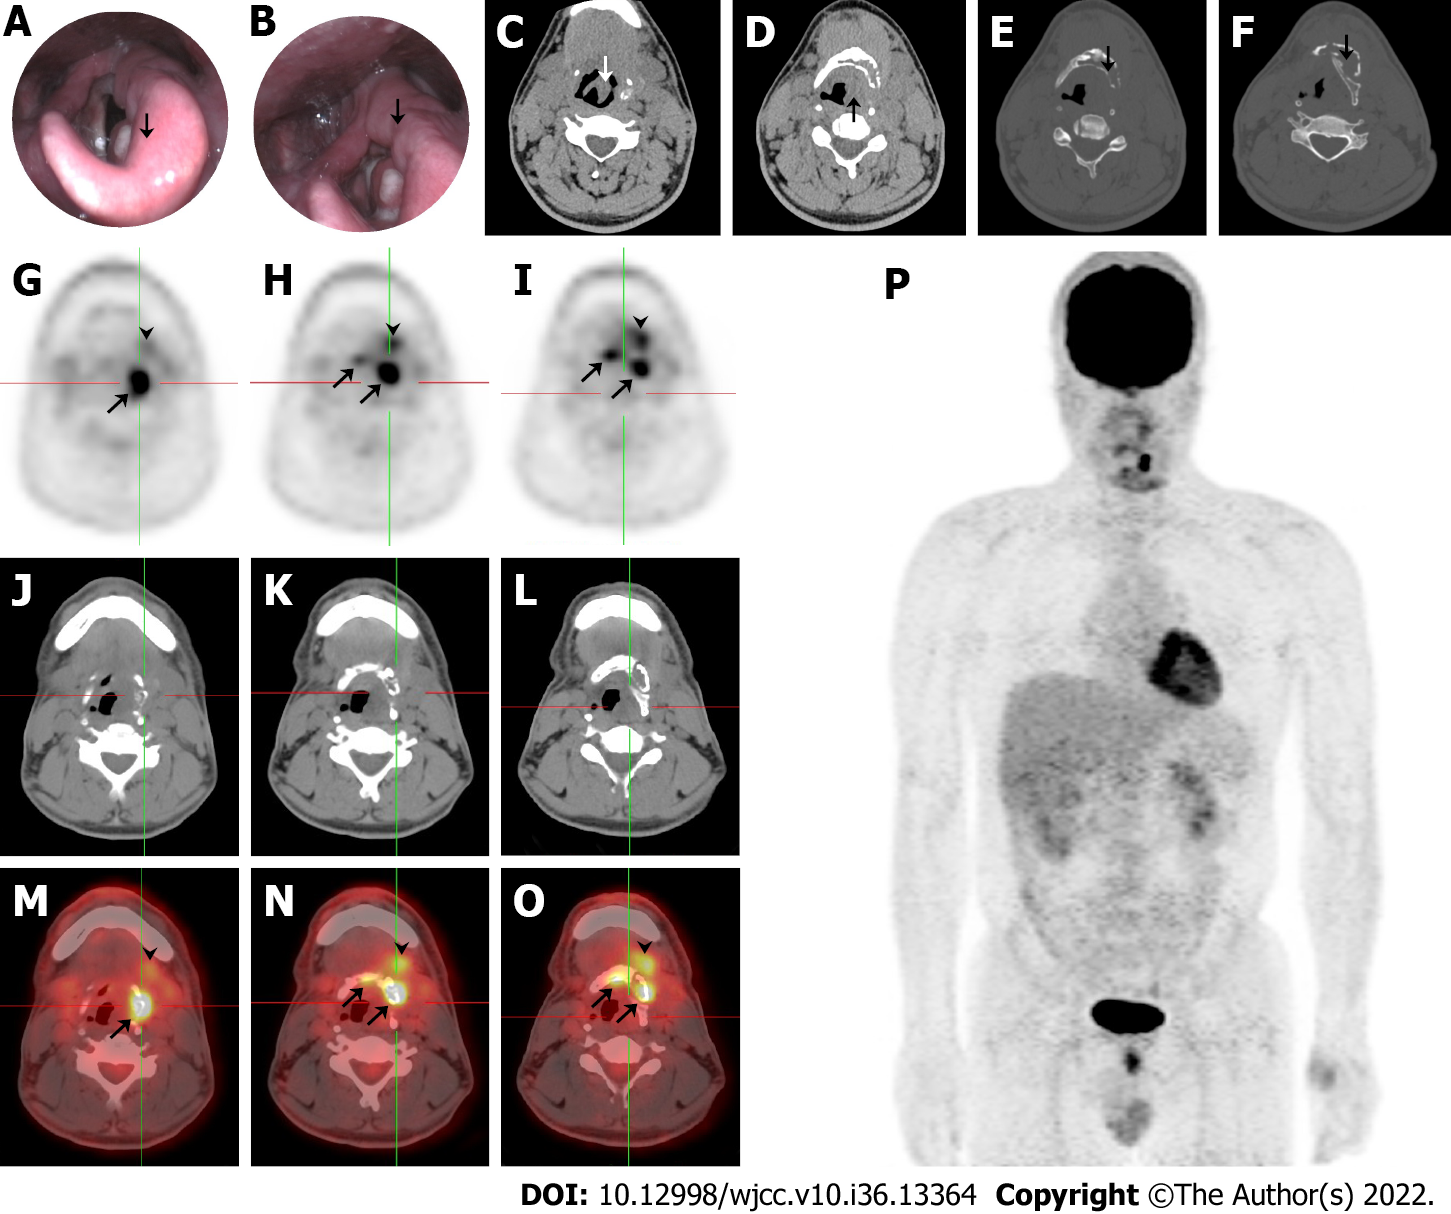
Figure 1 Imaging findings during initial admission.
A and C: Thickening of the left epiglottis; B and D: Arytenoid and aryepiglottic fold; E: Osteolytic lesions of the left hyoid; F: Thyroid cartilage plate; G-I: 18F-FDG centered around the hyoid body and its left greater horn (SUVmax = 8.8), and left submandibular and submental soft tissue (SUVmax = 4.8) exhibited on positron emission tomography (PET); J-L: Computed tomography (CT); M-O: PET/CT fusion; and P: PET maximum-intensity projection image demonstrated no other sites with abnormal 18F-FDG uptake.
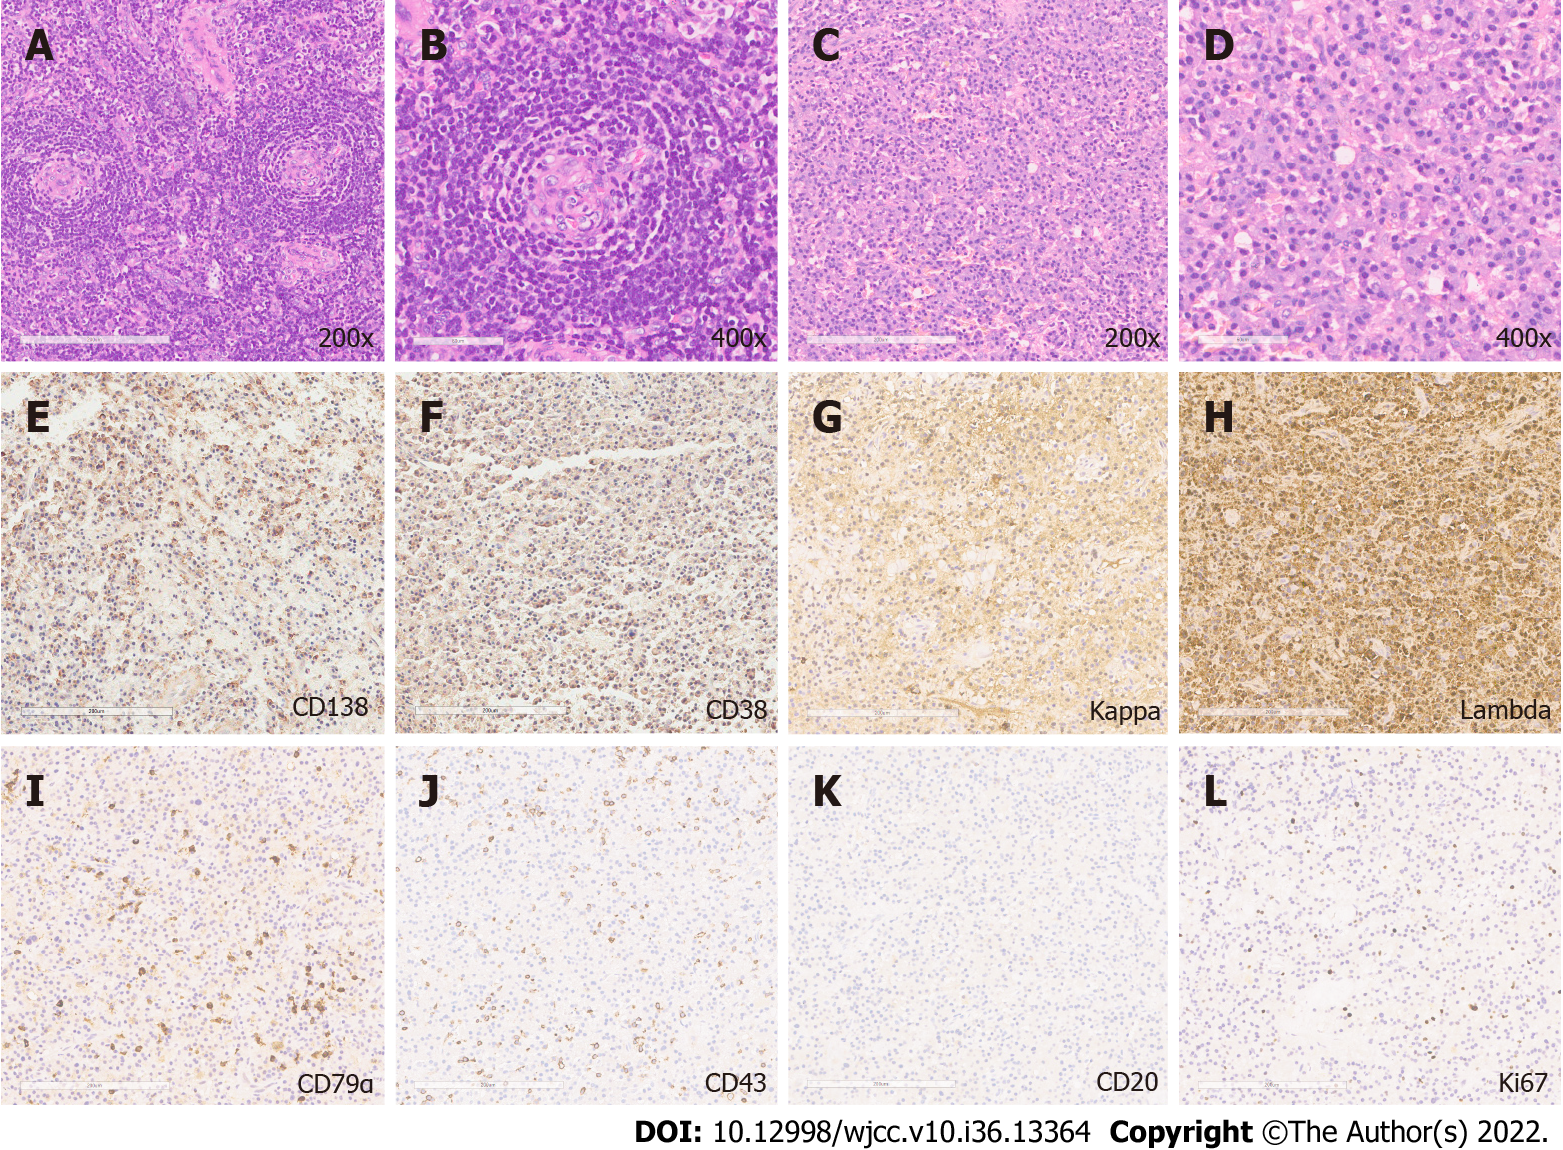
Figure 2 Histopathological and immunohistochemical analysis.
A and B: Hematoxylin and eosin staining revealed angiofollicular lymph node hyperplasia (200 × and 400 ×); C and D: The presence of mature plasma cells (200 × and 400 ×); E-J: Positive immunohistochemical staining for plasma cell markers: CD138, CD38, κ light chains, λ light chains, CD79α, T-cell marker CD43; K: Negative staining for B-cell marker CD20; and L: The Ki-67 positive staining.
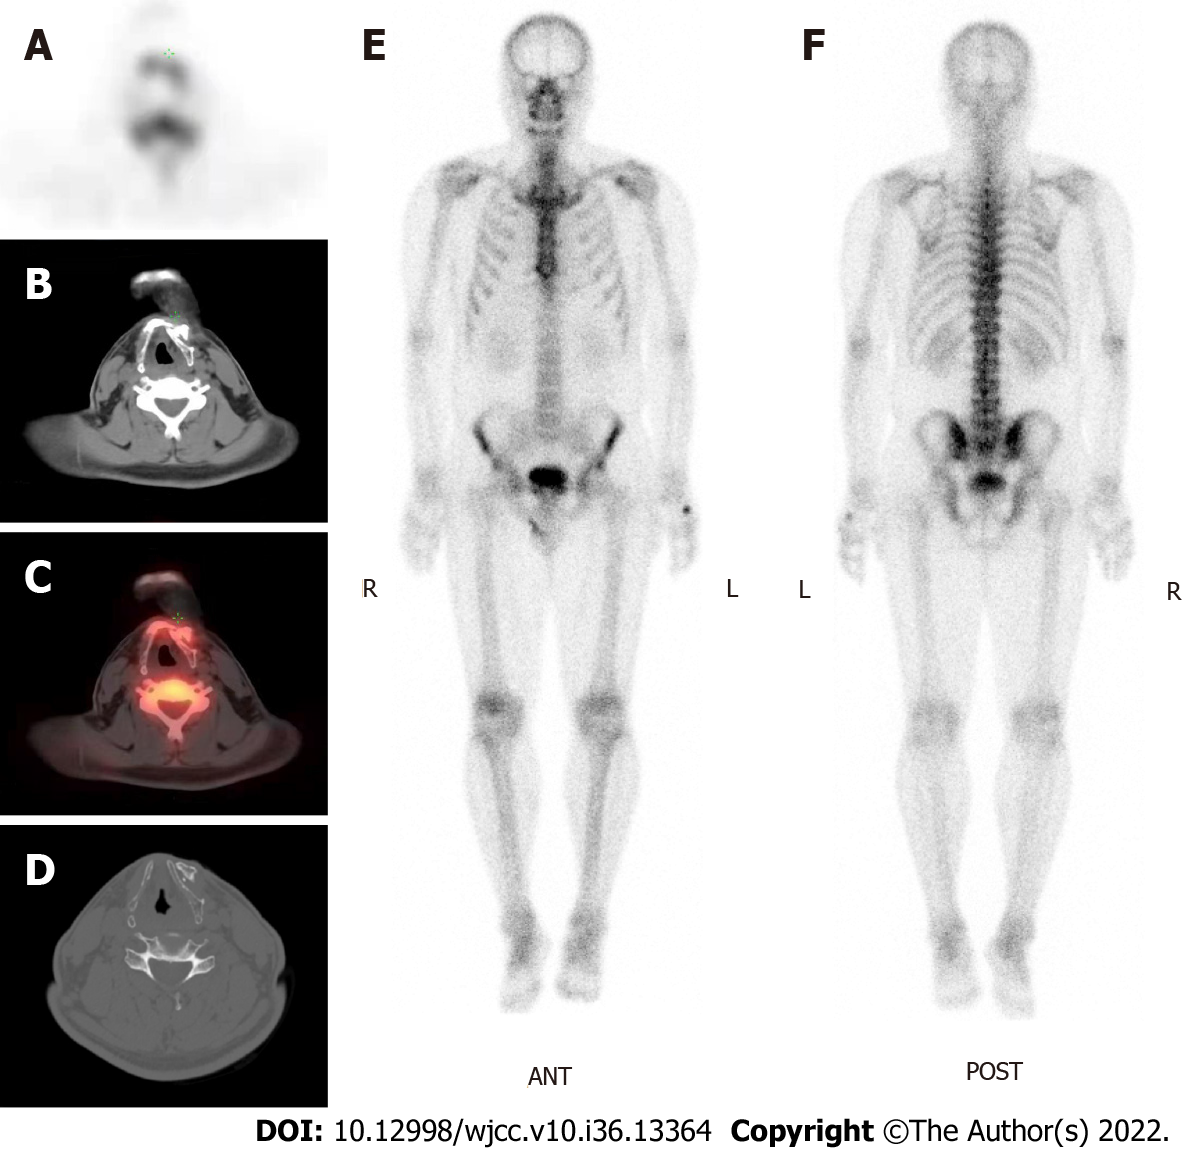
Figure 3 Molecular imaging in the evaluation of local recurrence and ectopic metastasis during follow-up.
A-C: 99mTc-MDP radioactivity around the hyoid exhibited on single-photon emission computed tomography (SPECT), computed tomography (CT), and SPECT/CT fusion; D: Focal bone destruction and secondary hyperosteogeny exhibited on CT bone window; E and F: No evidence of distant bone metastasis on whole-body SPECT.
- Citation: Zhang YH, He YF, Yue H, Zhang YN, Shi L, Jin B, Dong P. Solitary hyoid plasmacytoma with unicentric Castleman disease: A case report and review of literature. World J Clin Cases 2022; 10(36): 13364-13372
- URL: https://www.wjgnet.com/2307-8960/full/v10/i36/13364.htm
- DOI: https://dx.doi.org/10.12998/wjcc.v10.i36.13364


