Copyright
©The Author(s) 2022.
World J Clin Cases. Sep 26, 2022; 10(27): 9798-9804
Published online Sep 26, 2022. doi: 10.12998/wjcc.v10.i27.9798
Published online Sep 26, 2022. doi: 10.12998/wjcc.v10.i27.9798
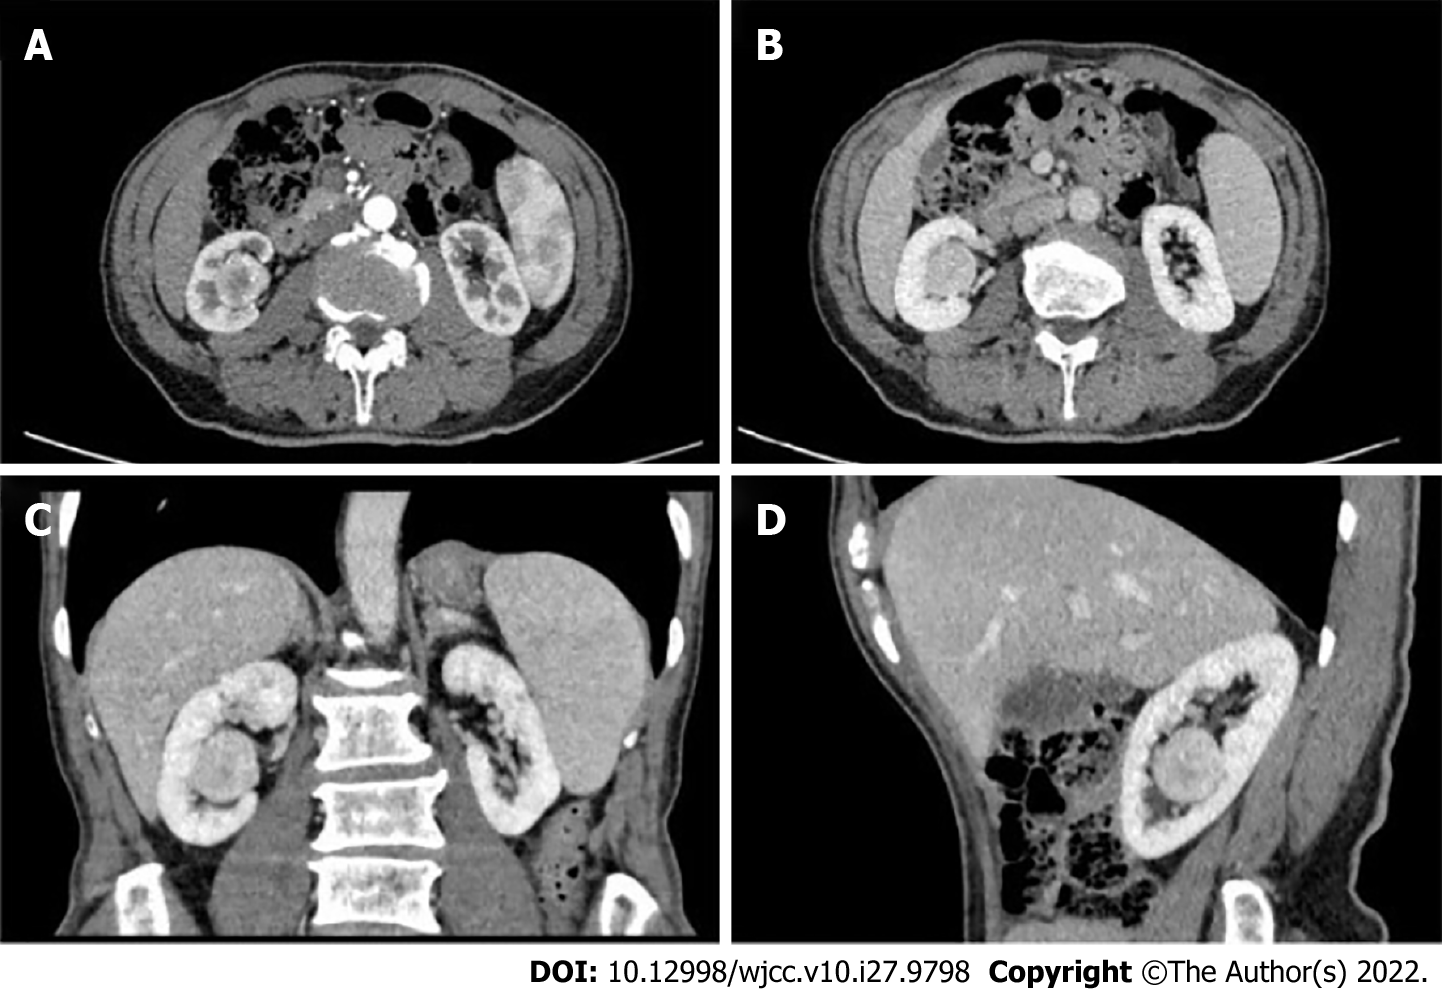
Figure 1 Computed tomography images showed a mass in the right renal pelvis (diameter: 2.
3 cm × 1.8 cm). Contrast-enhanced image showed a well delineated outline of the mass. A: Arterial phase computed tomography (CT); B: Cross-section CT (venous phase); C: Coronal contrastenhanced CT image; D: Sagittal surface contrastenhanced CT image. Red arrows indicate right renal pelvis solitary fibrous tumor lesion.
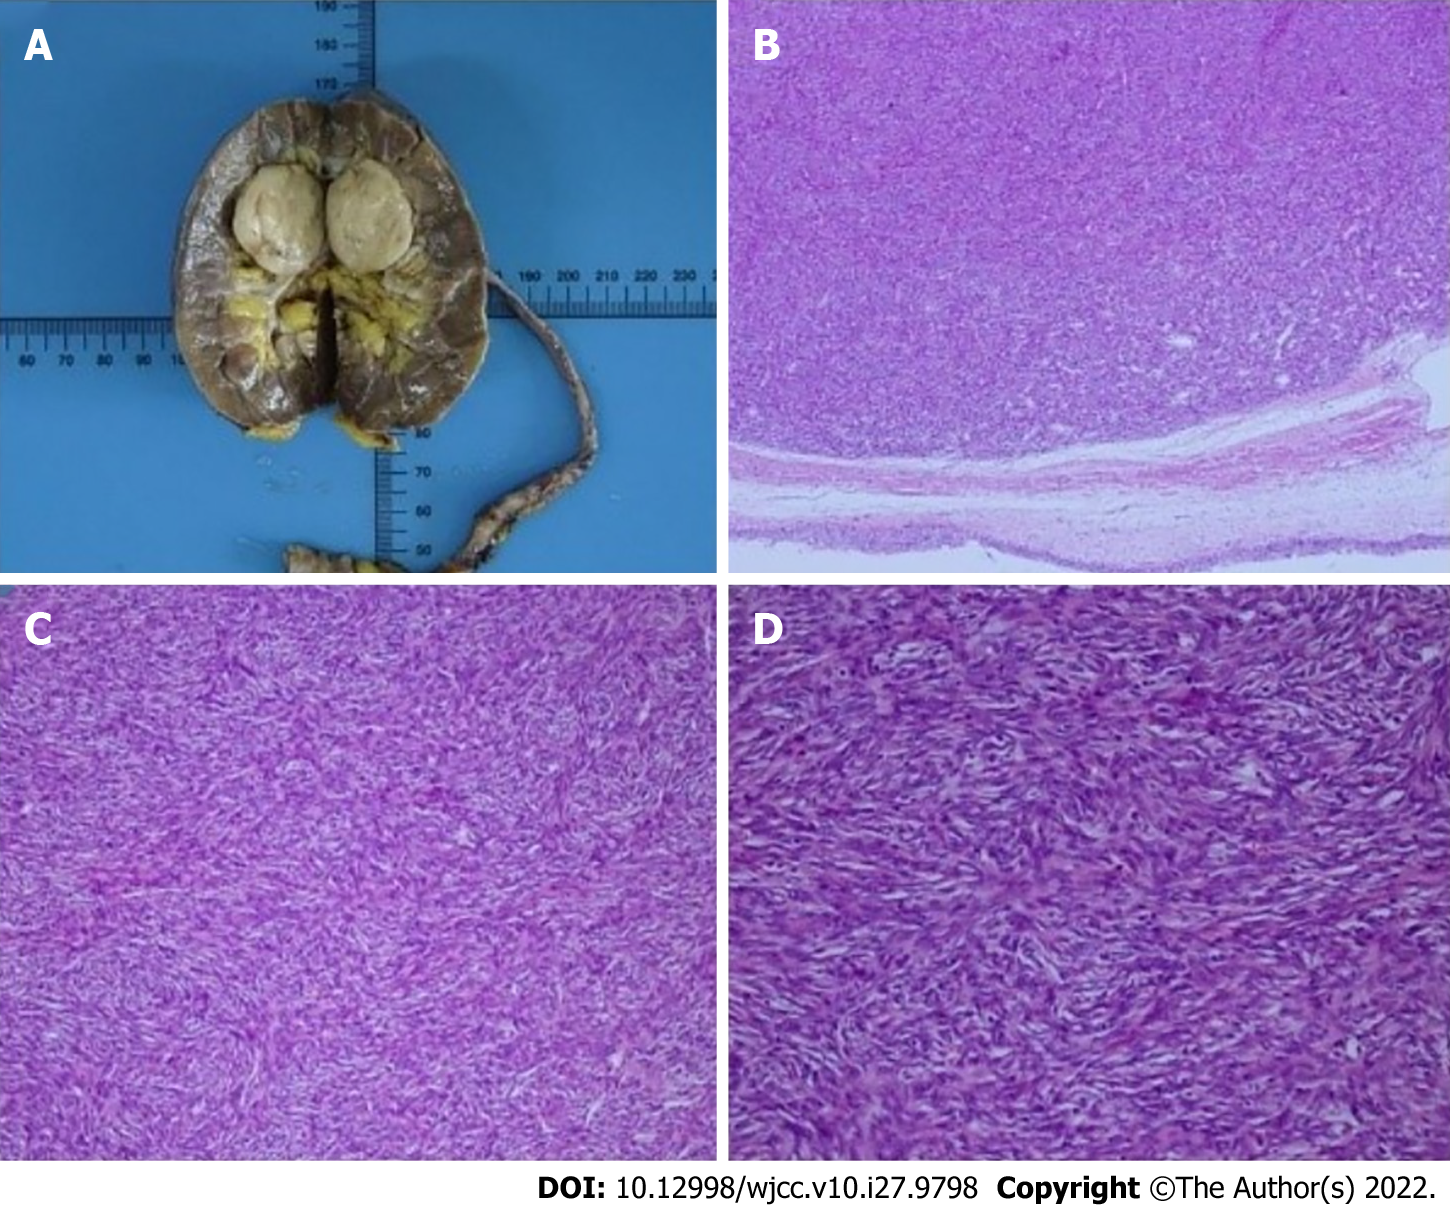
Figure 2 Pathological specimen of the kidney and ureter.
A: Photograph of the tumor; B: Hematoxylin and eosin (H&E)-stained section (magnification × 5); C: H&E-stained section (magnification × 40); D: H&E-stained section (magnification × 200).
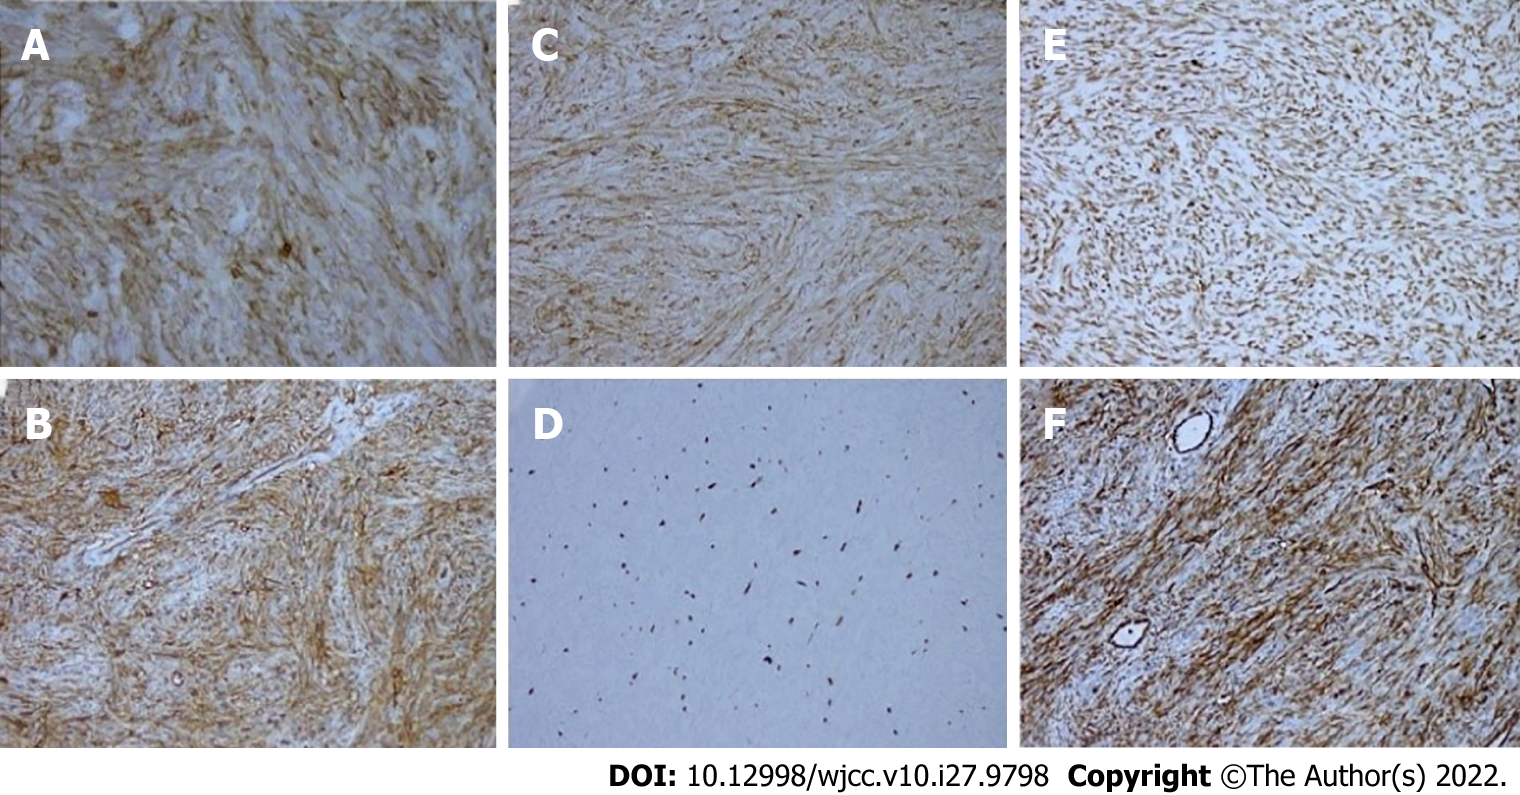
Figure 3 Immunohistochemistry results (× 20).
A: Bcl-2; B: CD34; C: CD99; D: Ki67; E: STAT6; F: Vimentin.
- Citation: Liu M, Zheng C, Wang J, Wang JX, He L. Solitary fibrous tumor of the renal pelvis: A case report. World J Clin Cases 2022; 10(27): 9798-9804
- URL: https://www.wjgnet.com/2307-8960/full/v10/i27/9798.htm
- DOI: https://dx.doi.org/10.12998/wjcc.v10.i27.9798


