Copyright
©The Author(s) 2022.
World J Clin Cases. Jun 16, 2022; 10(17): 5764-5769
Published online Jun 16, 2022. doi: 10.12998/wjcc.v10.i17.5764
Published online Jun 16, 2022. doi: 10.12998/wjcc.v10.i17.5764
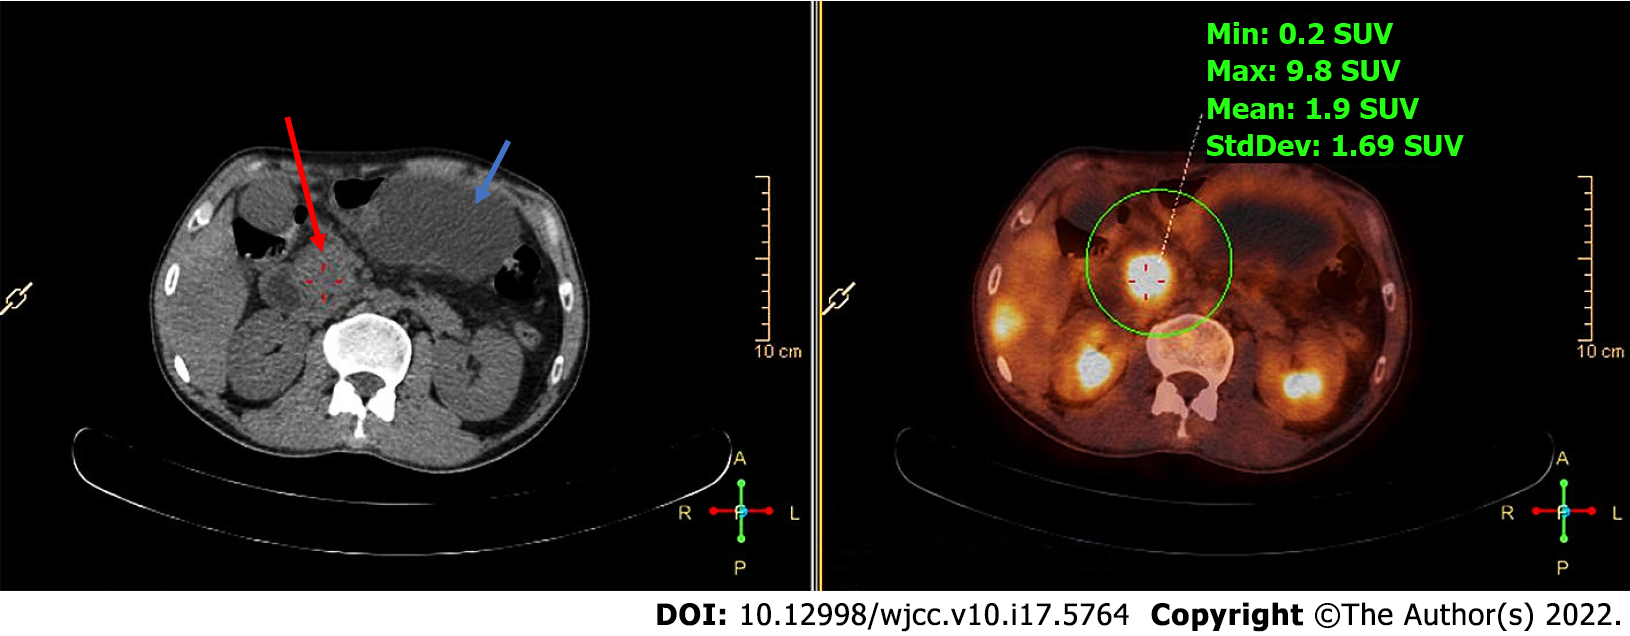
Figure 1 Positron-emission tomography/computed tomography images.
Positron-emission tomography/computed tomography confirmed increased soft tissues in the pancreatic head (red arrow) with elevated metabolic activity (green circle) and pancreatic pseudocyst (blue arrow) without an increase in metabolic activity.
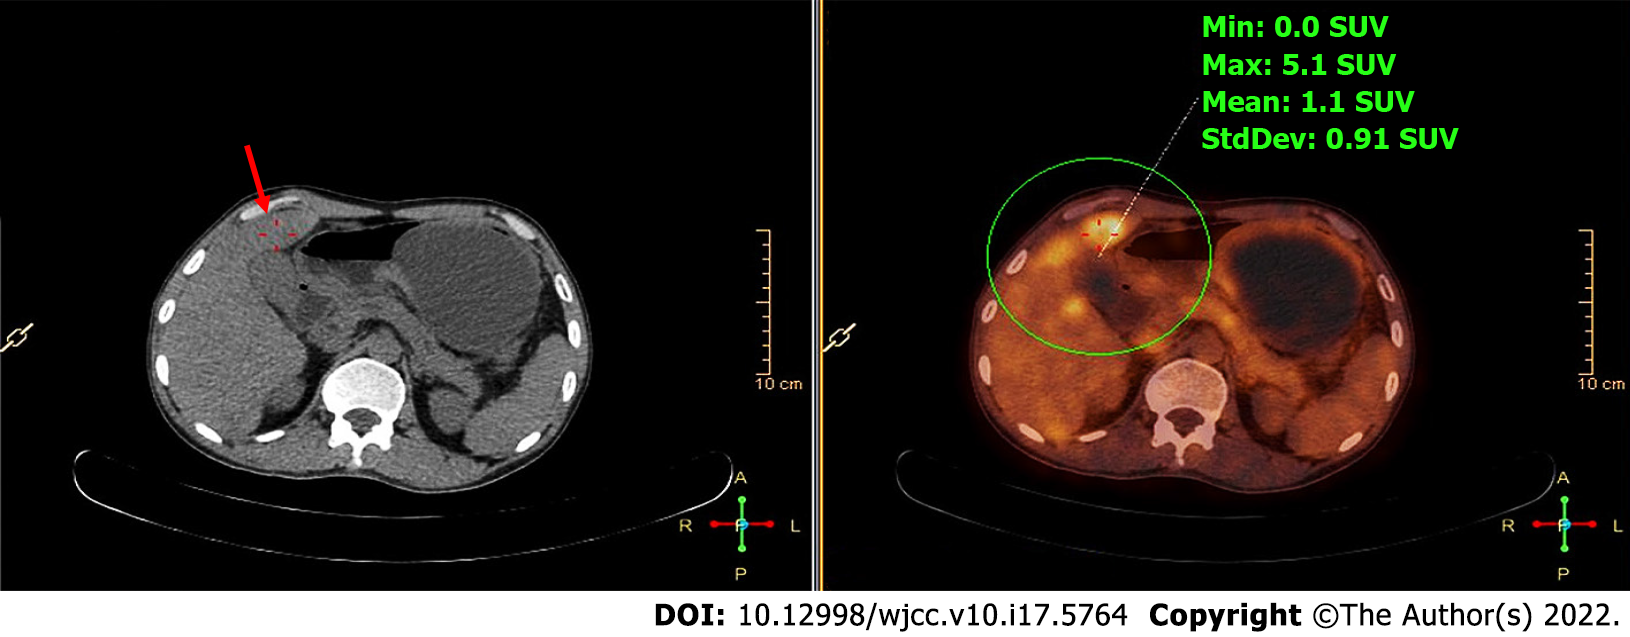
Figure 2 Positron-emission tomography/computed tomography images.
Positron-emission tomography/computed tomography confirmed multiple liver masses (red arrow) with elevated metabolic activity (green circle).
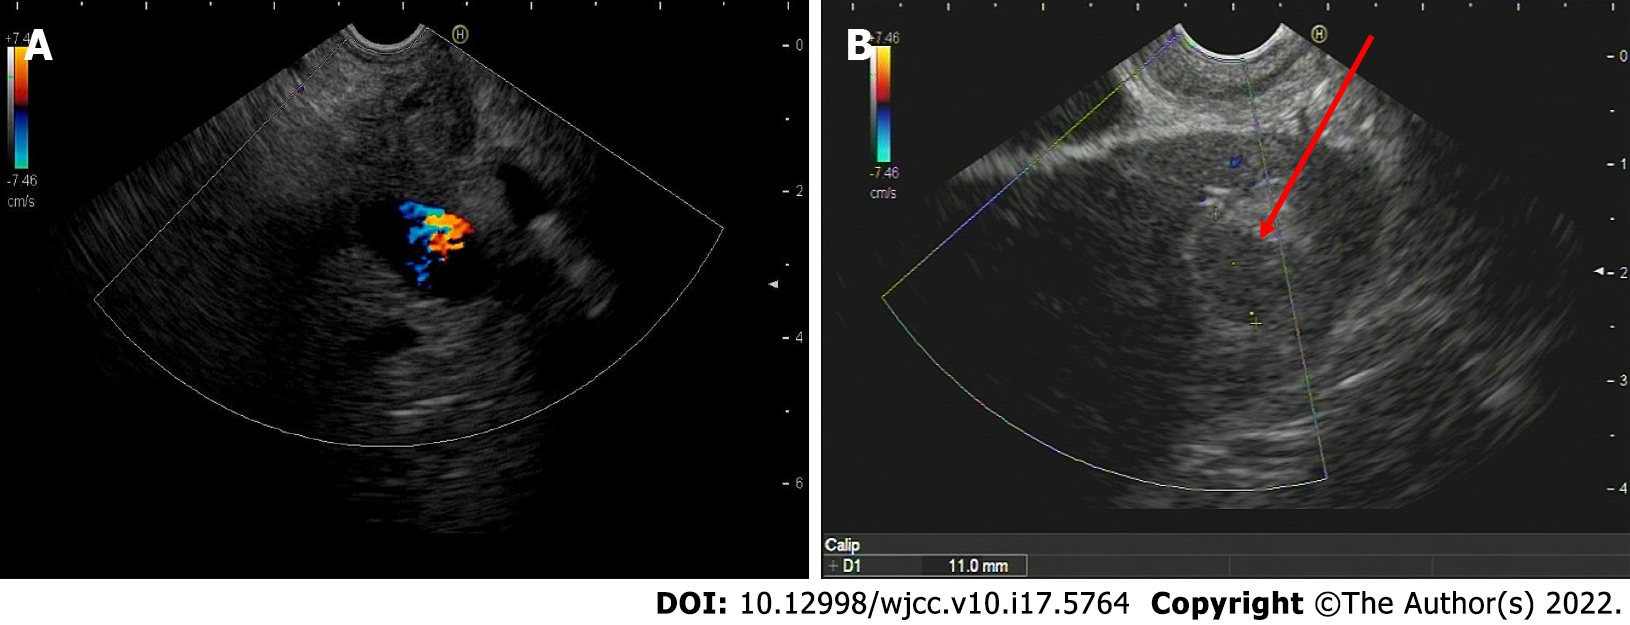
Figure 3 Endoscopic ultrasound images.
A: An enlarged hypoechoic pancreatic head; B: Multiple hypoechoic liver masses (red arrow).
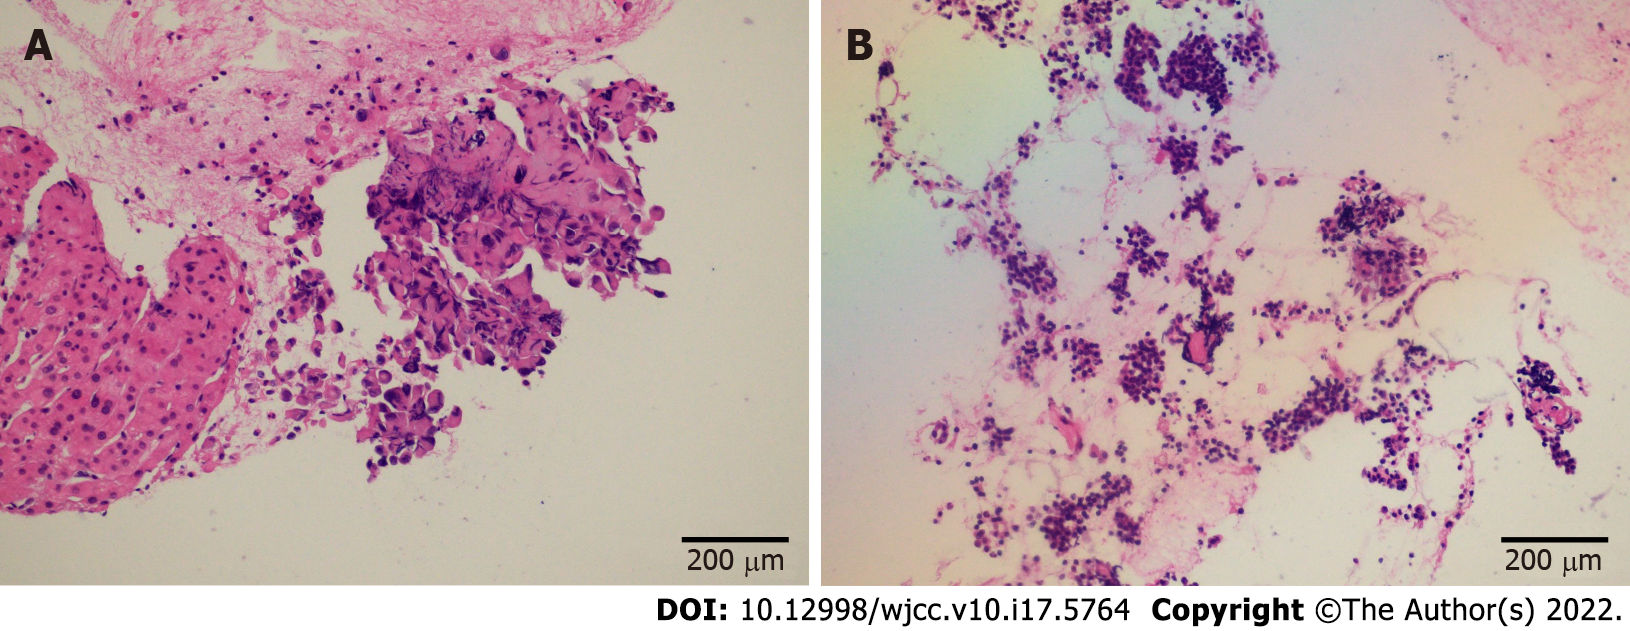
Figure 4 Histopathological images.
A and B: Endoscopic ultrasound-guided fine-needle aspiration biopsy revealed histologies of endoscopic ultrasound-guided liver aspiration (A) and endoscopic ultrasound-guided pancreatic aspiration (B).
- Citation: Yang J, Zeng Y, Zhang JW. Simultaneous multiple primary malignancies diagnosed by endoscopic ultrasound-guided fine-needle aspiration: A case report. World J Clin Cases 2022; 10(17): 5764-5769
- URL: https://www.wjgnet.com/2307-8960/full/v10/i17/5764.htm
- DOI: https://dx.doi.org/10.12998/wjcc.v10.i17.5764


