Copyright
©The Author(s) 2022.
World J Clin Cases. Jun 16, 2022; 10(17): 5667-5679
Published online Jun 16, 2022. doi: 10.12998/wjcc.v10.i17.5667
Published online Jun 16, 2022. doi: 10.12998/wjcc.v10.i17.5667
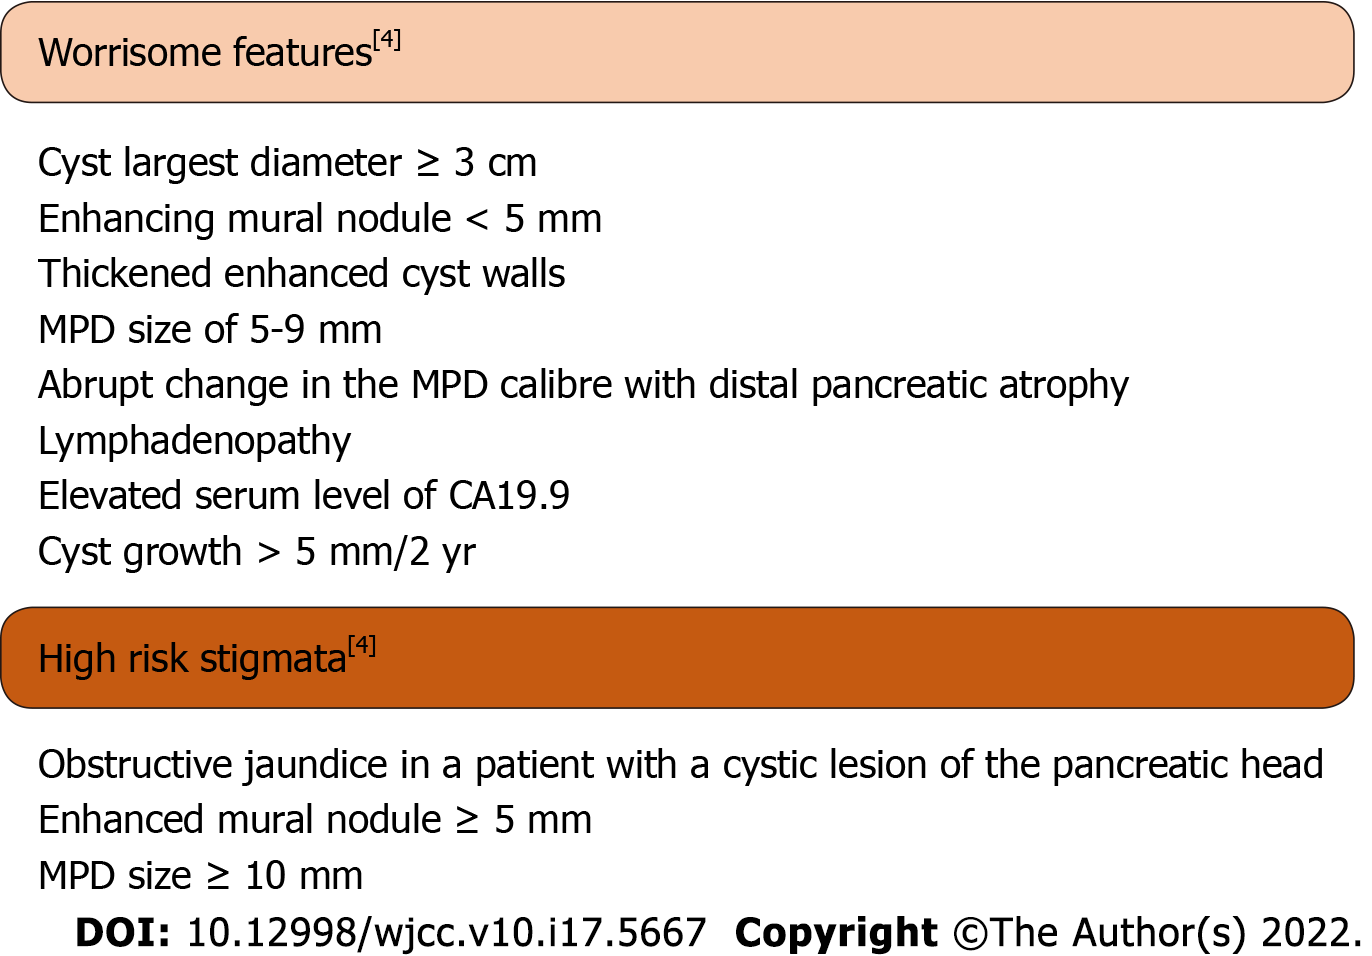
Figure 1 Worrisome features and high-risk stigmata.
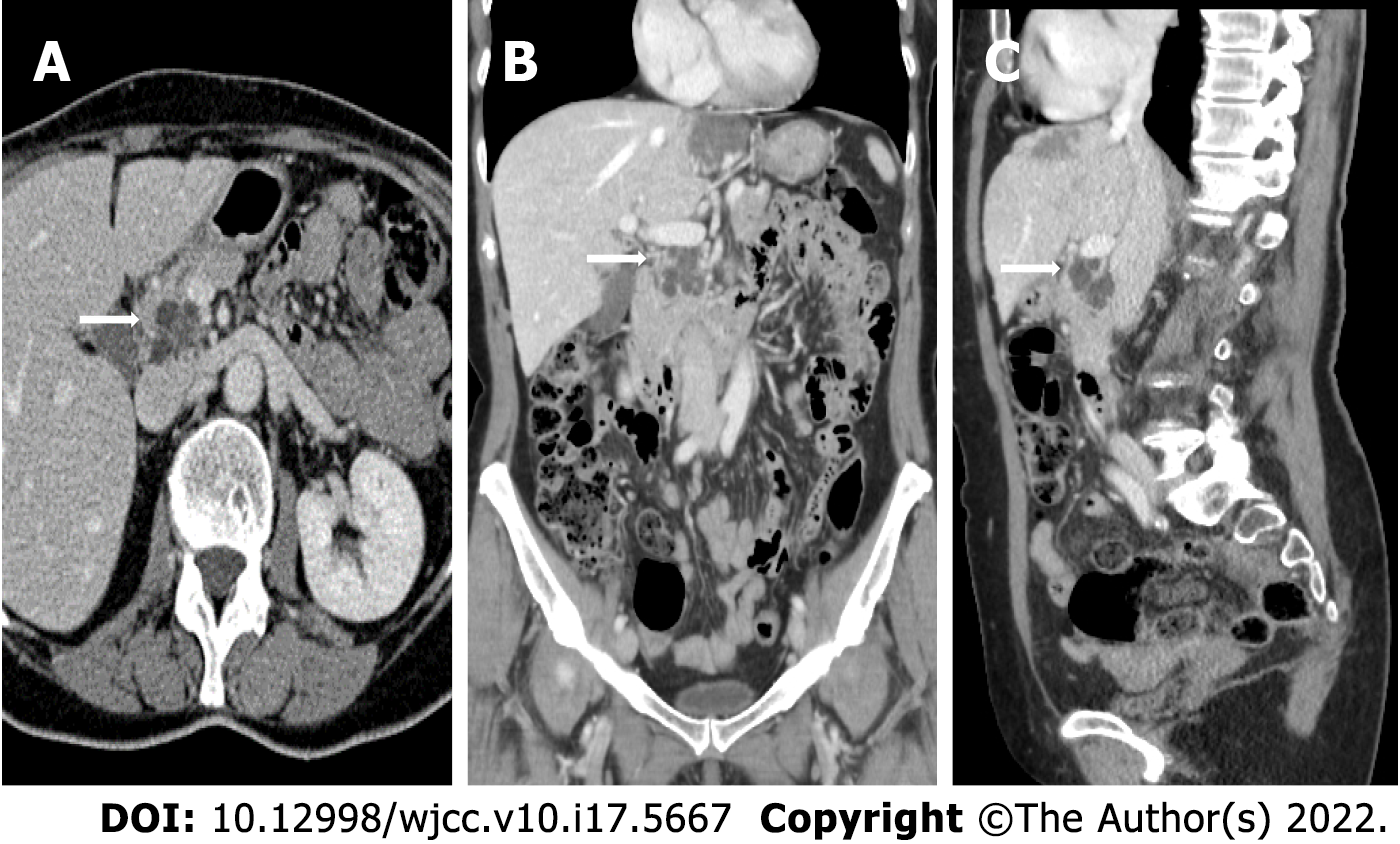
Figure 2 Contrast-enhanced computed tomography images (Brilliance iCT, Philips Medical Systems) of intraductal papillary mucinous neoplasms of the pancreatic head in the three planes of space.
A: Axial view; B: Coronal view; and C: Sagittal view. The arrows indicate the location of the cyst.
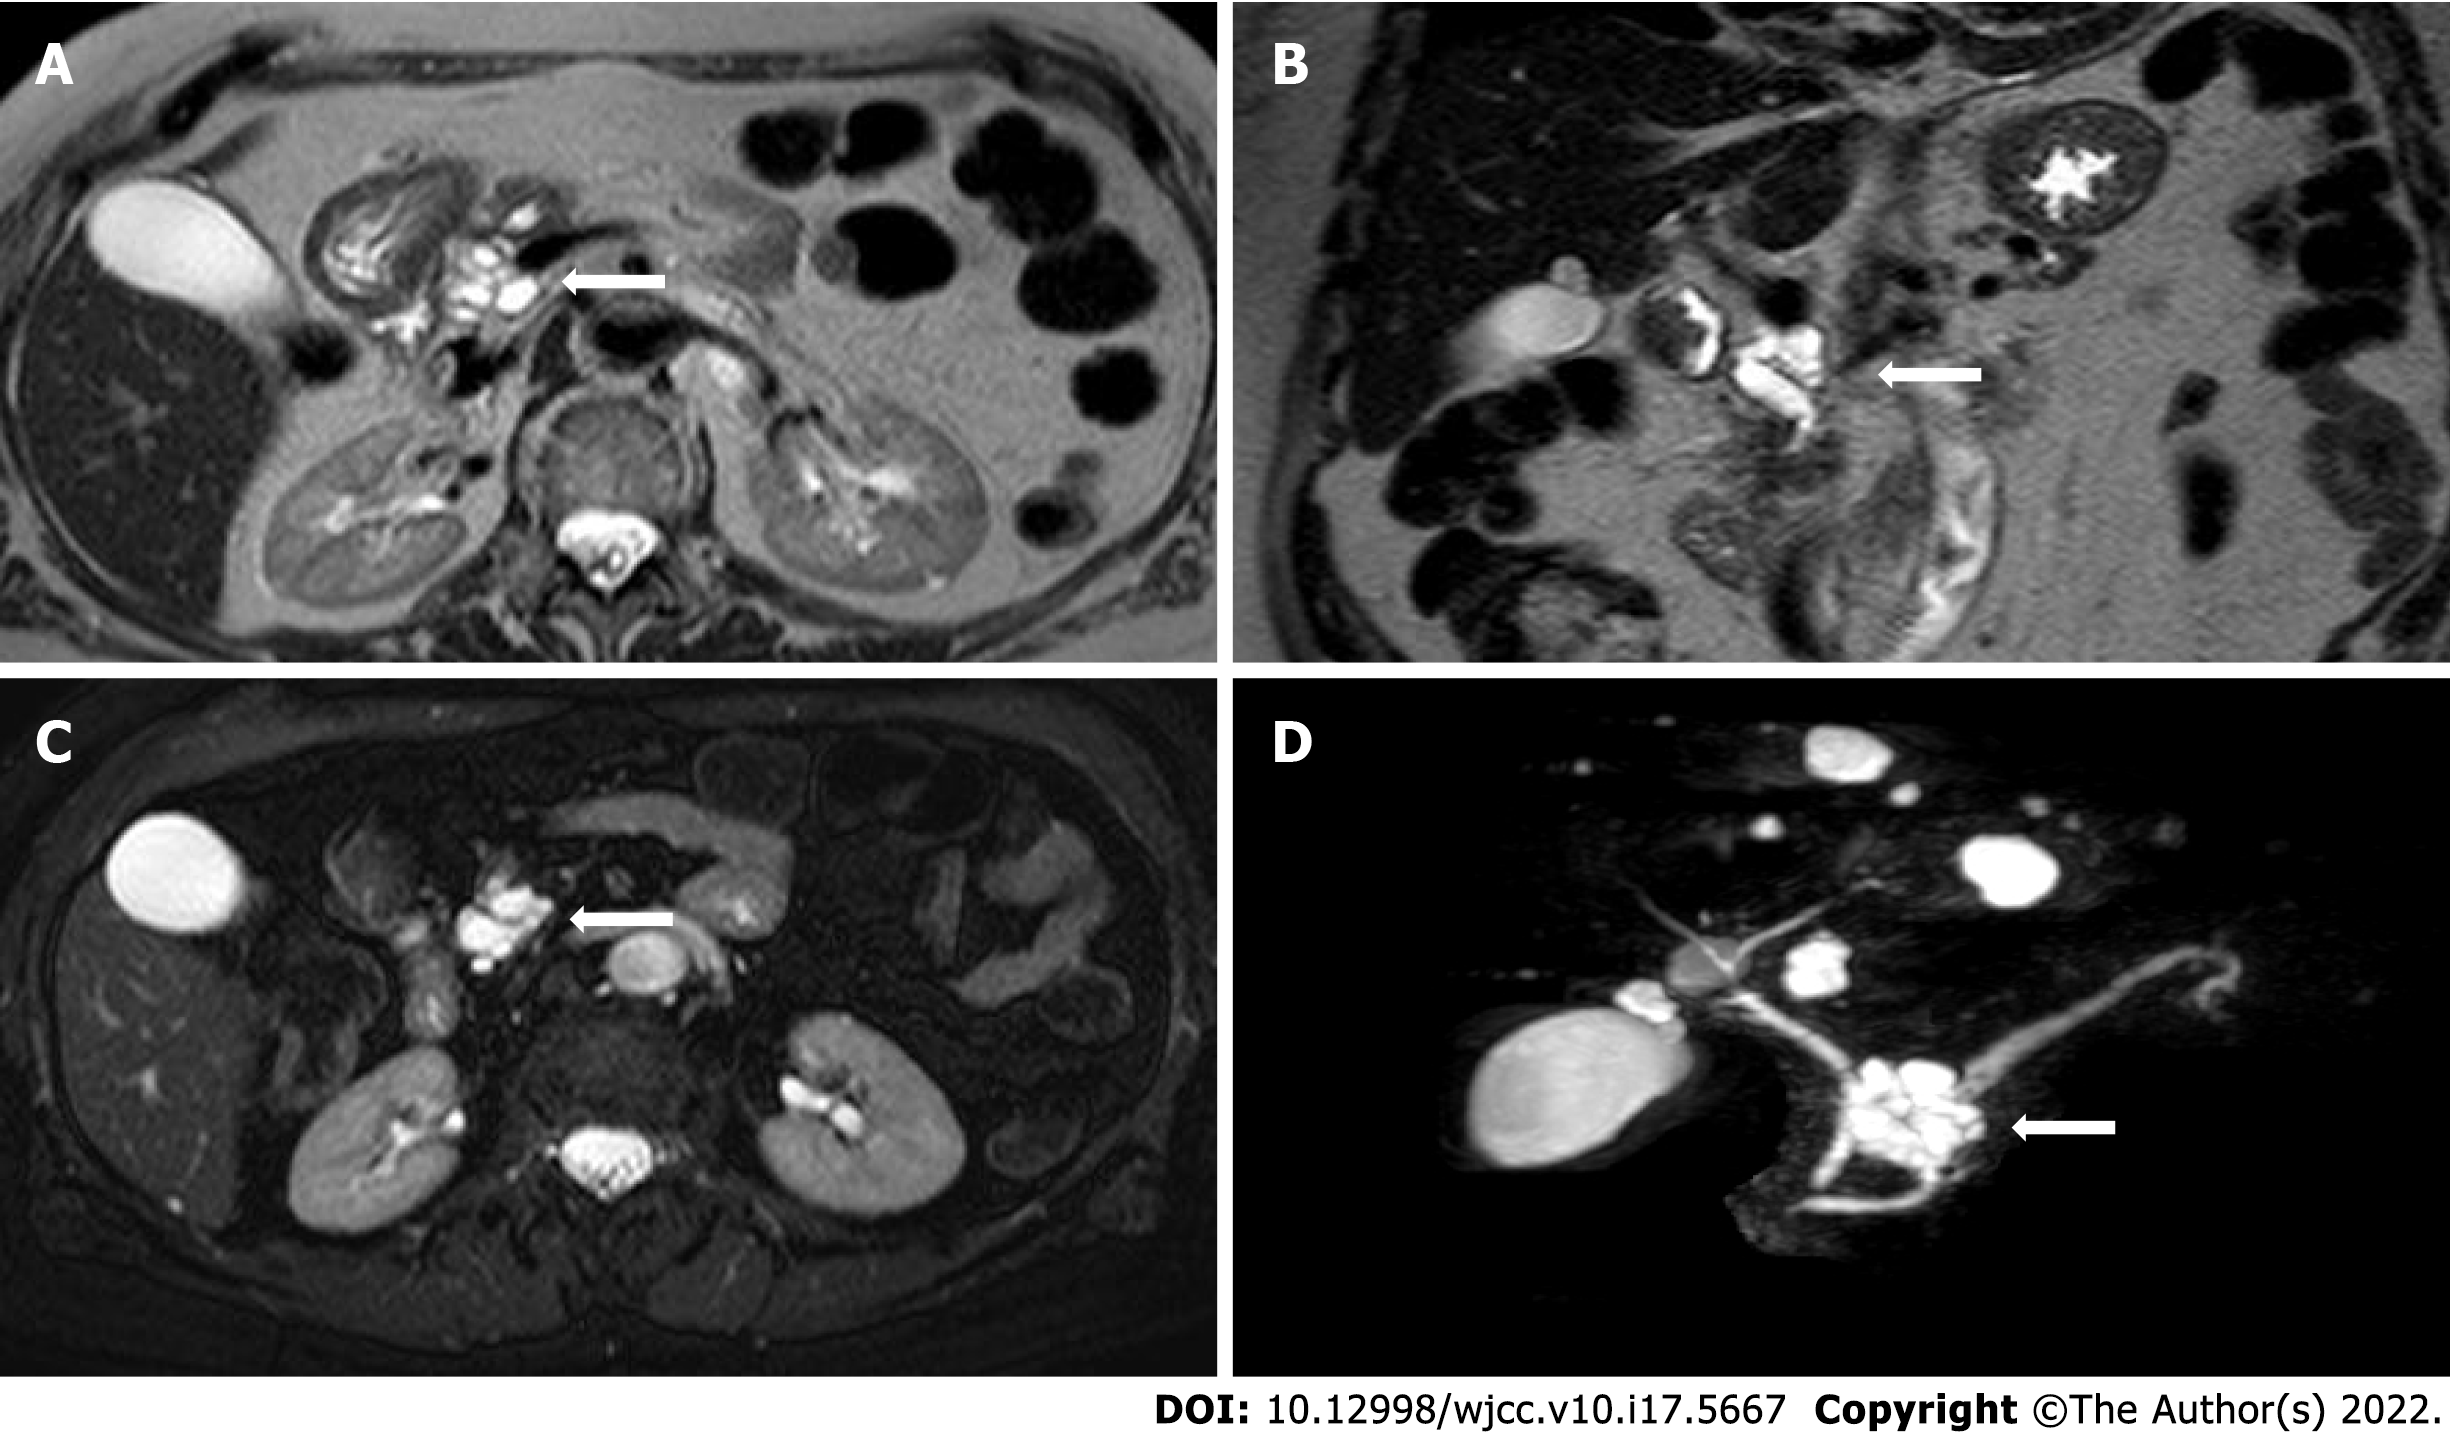
Figure 3 Non-contrast-enhanced magnetic resonance images of intraductal papillary mucinous neoplasms.
A: T2-weighted Turbo Spin Echo (TSE) axial image; B: T2-weighted TSE coronal image; C: T2-weighted TSE fat-sat axial image; and D: T2-weighted TSE volume (3D) TSE fat-sat sequences (with MIP reconstructions). The arrows indicate the location of the cyst.
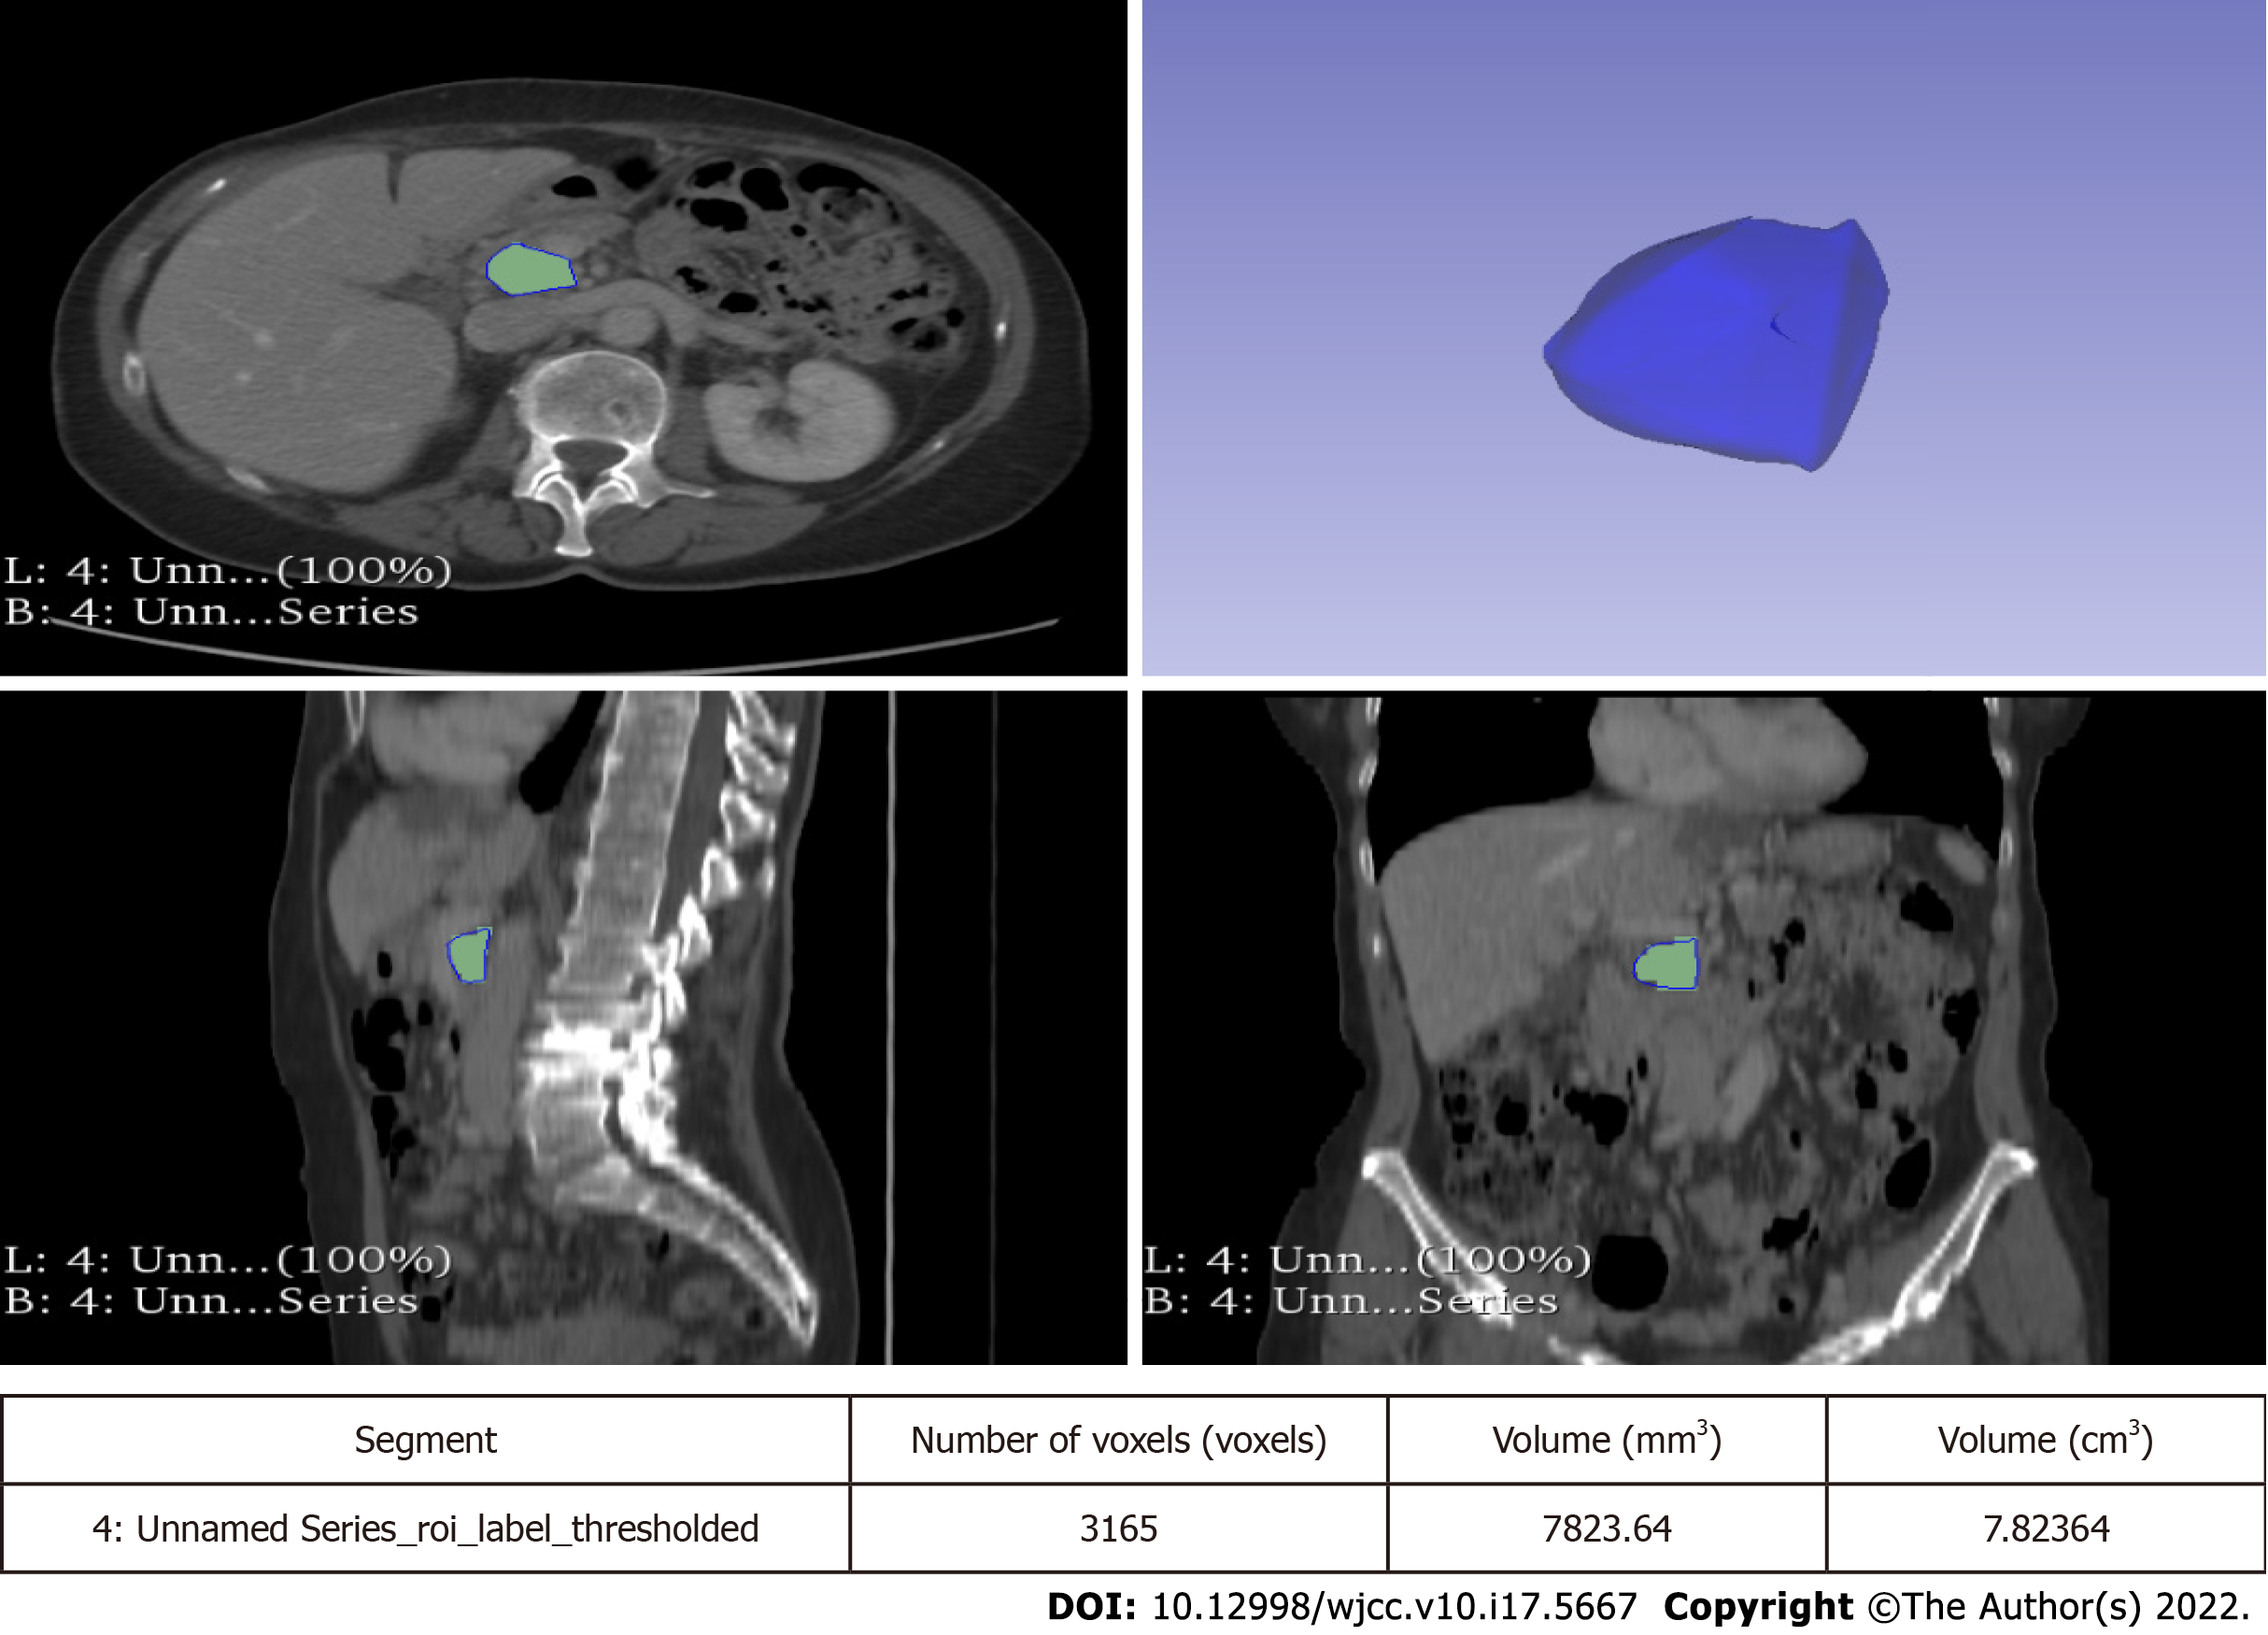
Figure 4 Segmentation of intraductal papillary mucinous neoplasms in a portal venous phase contrast-enhanced computed tomography images using the 3D Slicer software.
The volume of the entire cyst was determined by manually drawing a region of interest along the edge of the neoplasm on each consecutive slice covering the whole lesion.
- Citation: Innocenti T, Danti G, Lynch EN, Dragoni G, Gottin M, Fedeli F, Palatresi D, Biagini MR, Milani S, Miele V, Galli A. Higher volume growth rate is associated with development of worrisome features in patients with branch duct-intraductal papillary mucinous neoplasms. World J Clin Cases 2022; 10(17): 5667-5679
- URL: https://www.wjgnet.com/2307-8960/full/v10/i17/5667.htm
- DOI: https://dx.doi.org/10.12998/wjcc.v10.i17.5667


