Copyright
©The Author(s) 2022.
World J Clin Cases. Jun 16, 2022; 10(17): 5655-5666
Published online Jun 16, 2022. doi: 10.12998/wjcc.v10.i17.5655
Published online Jun 16, 2022. doi: 10.12998/wjcc.v10.i17.5655
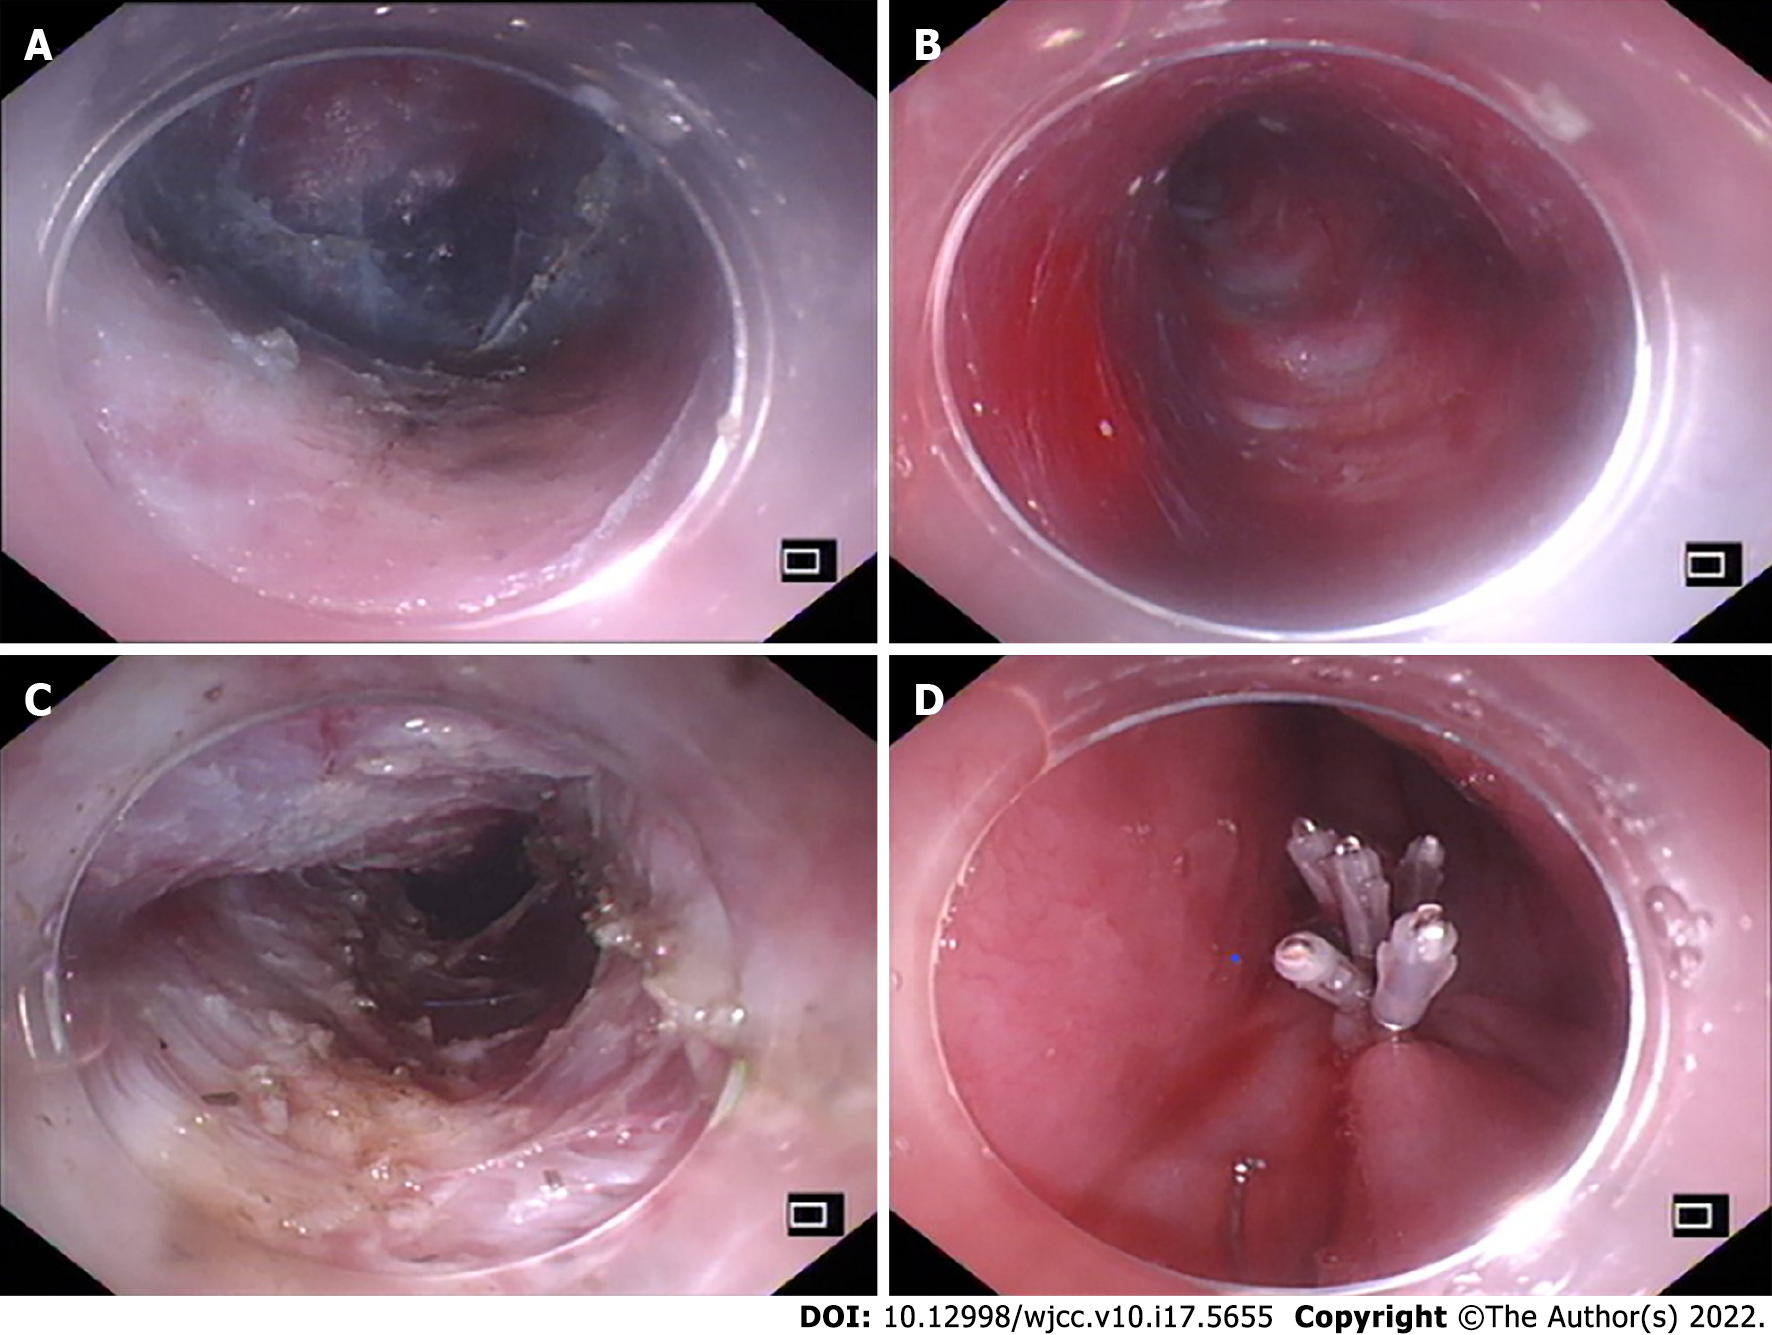
Figure 1 The peroral endoscopic myotomy procedure.
A: The mucosal layer was longitudinally cut to form a mucosal opening to expose the stratum submucosa; B: Submucosal injection was performed while the mucosa was separated to form a submucosal tunnel (3-4 cm) to the distal end of the gastroesophageal junction (GEJ); C: The myometrial incision was performed from the distal end of the mucosal tunnel opening at 2 cm to at least 2 cm to the distal end of the GEJ; D: After proper hemostasis, the mucosal opening was closed with a hemostatic clip.
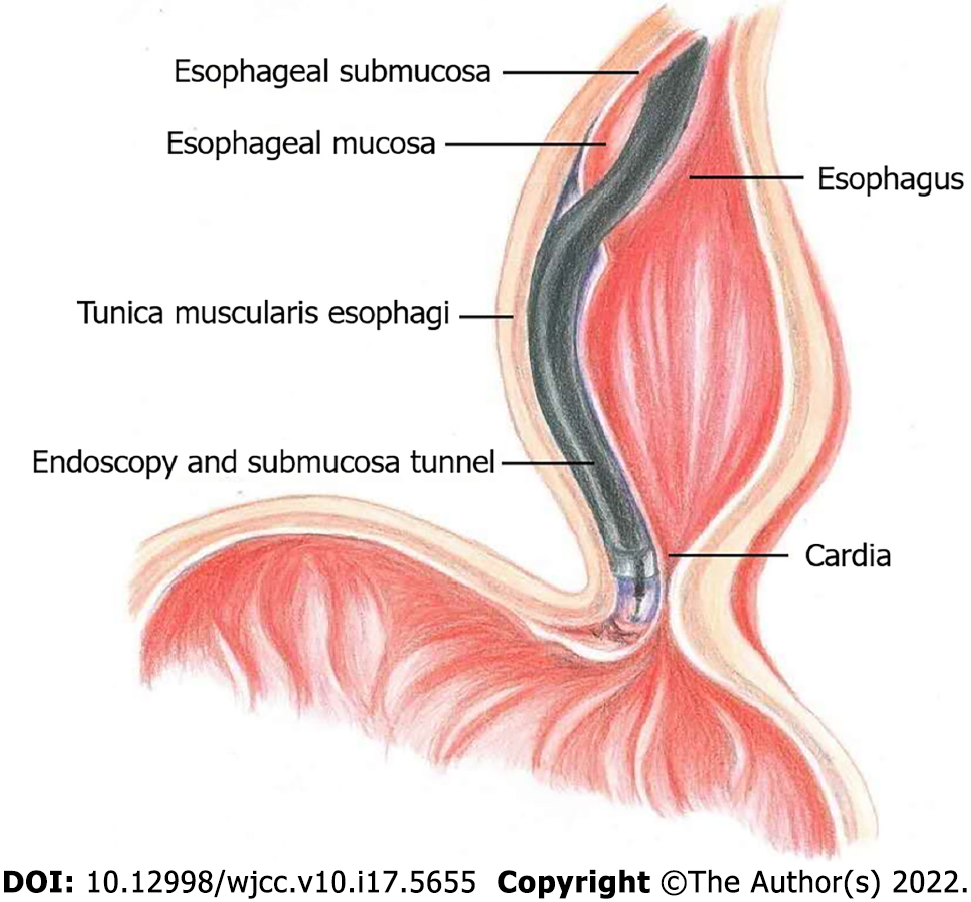
Figure 2 Illustration of the main peroral endoscopic myotomy procedure.
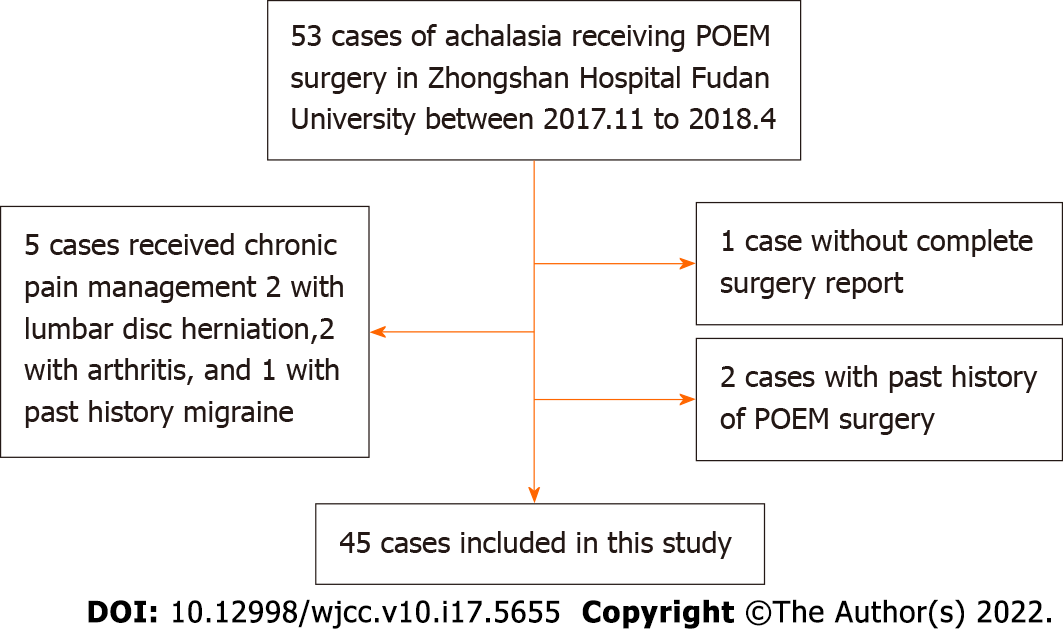
Figure 3 Flowchart of patient selection.
POEM: Peroral endoscopic myotomy.
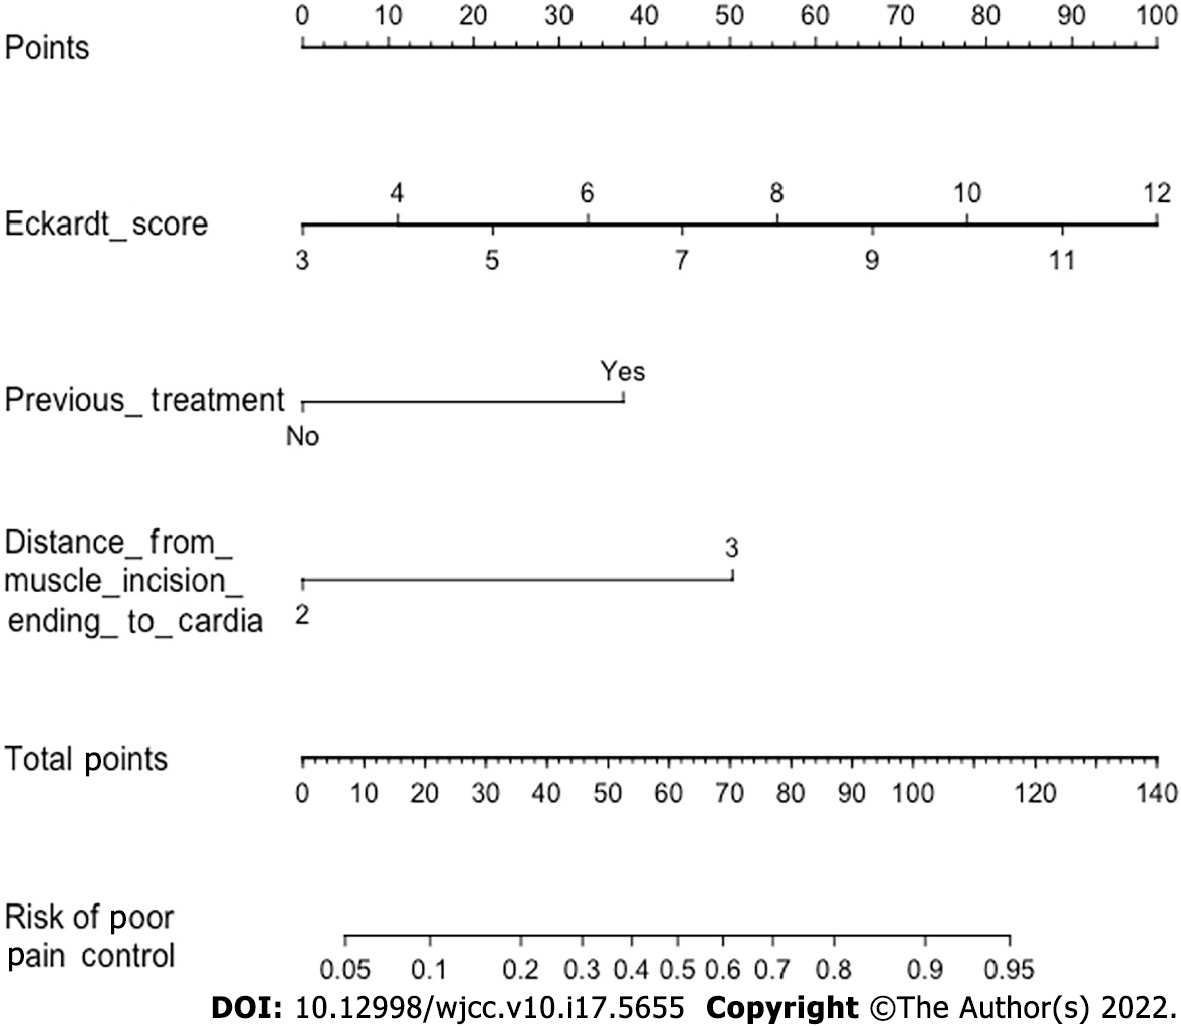
Figure 4 The nomogram was constructed from 3 parameters (Table 2).
To calculate a patient’s risk for poor pain control, defined as a visual analog scale score greater than or equal to 4 at 12 h after peroral endoscopic myotomy (POEM), each parameter was assigned a point by its vertical correspondence to the "points" axis, and the sum of the points was plotted on the “total points” axis. The risk for poor post-POEM pain control is the value on the “Risk of poor pain control” axis at a vertical position from the corresponding point on the “Total Points” axis.
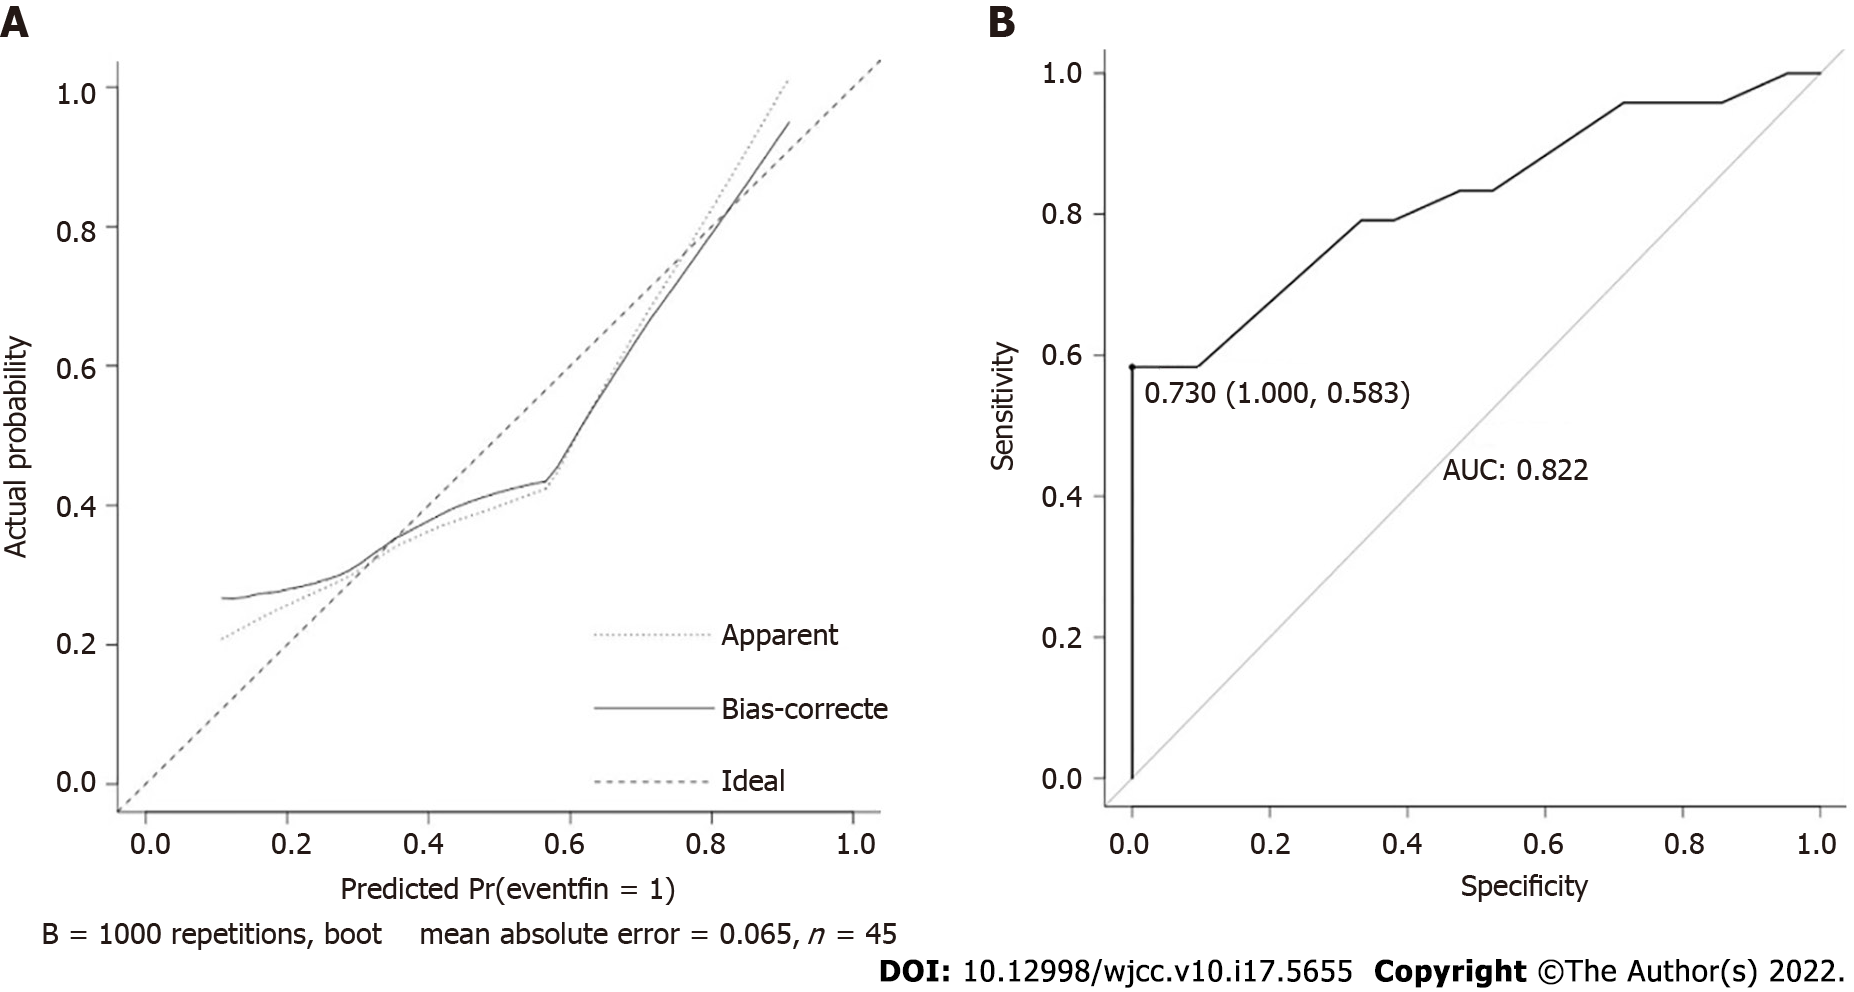
Figure 5 Calibration plots and receiver operating characteristic curve of the nomogram for prediction.
A: The calibration plot is the comparison between predicted and actual outcomes. The dashed line is a reference line, indicating where an ideal nomogram would lie; B: Receiver operating characteristic curve of the nomogram with an area under the receiver operating characteristic curve of 0.822 and an optimal cutoff of 0.730.
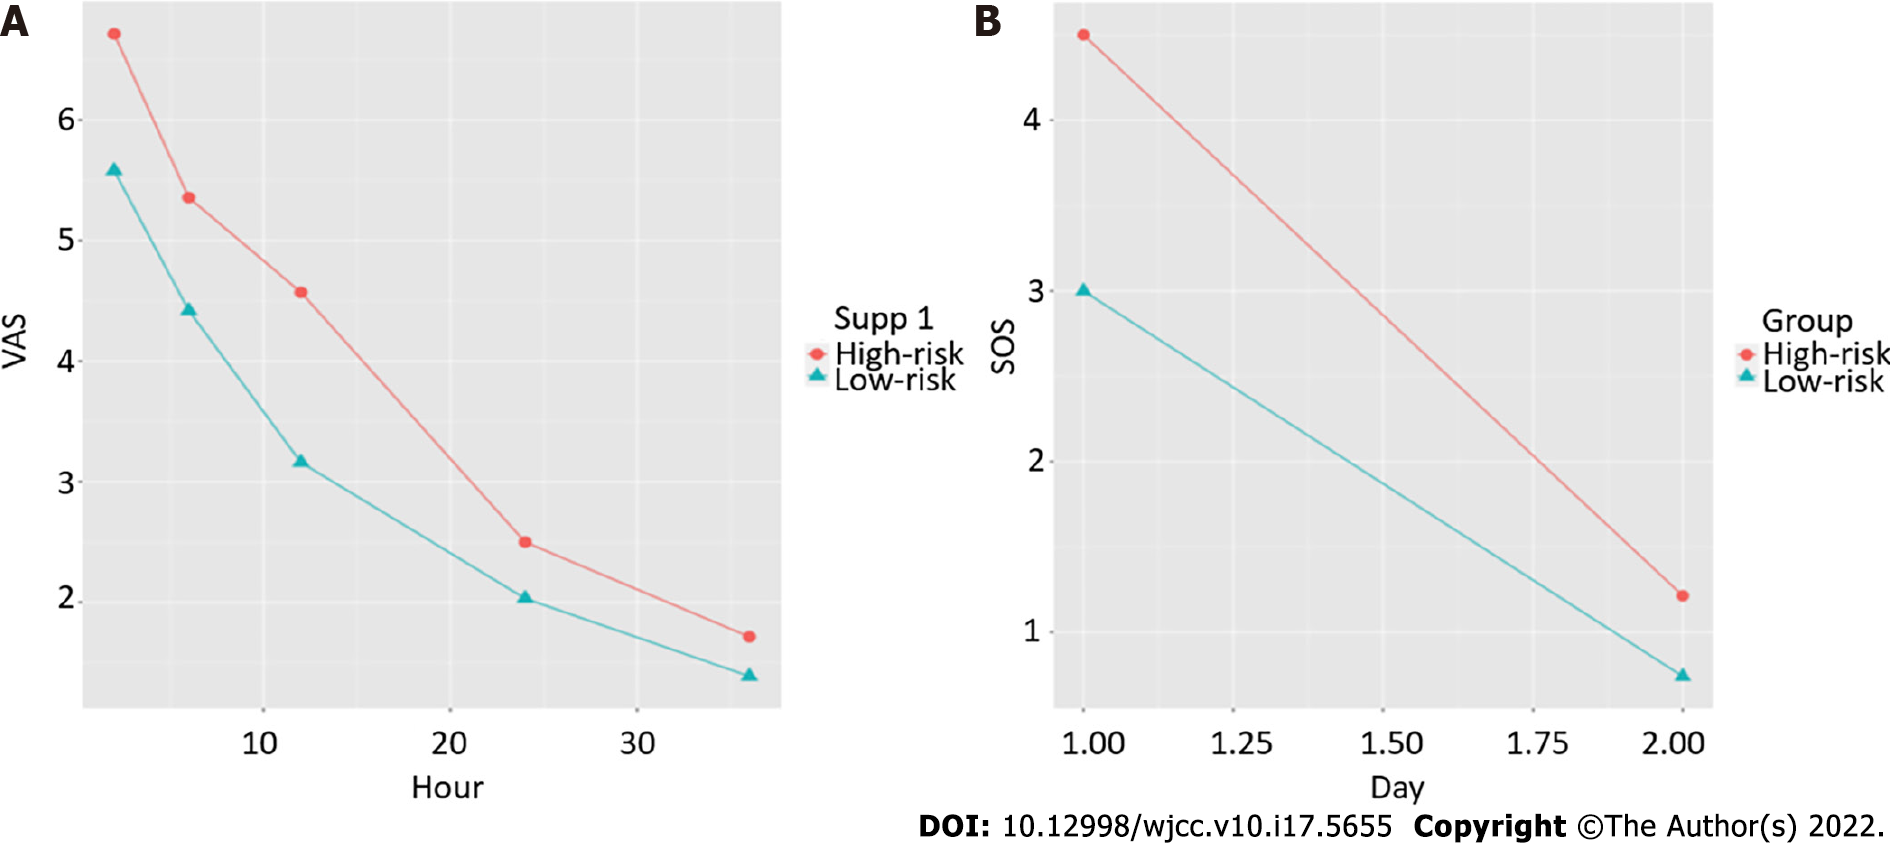
Figure 6 Line charts of the means of the high- and low-risk groups, divided from the raw data, by the nomogram over time.
A: Line chart of the visual analog scale; B: Line chart of the sleep score. VAS: Visual analog scale.
- Citation: Chen WN, Xu YL, Zhang XG. High Eckardt score and previous treatment were associated with poor postperoral endoscopic myotomy pain control: A retrospective study. World J Clin Cases 2022; 10(17): 5655-5666
- URL: https://www.wjgnet.com/2307-8960/full/v10/i17/5655.htm
- DOI: https://dx.doi.org/10.12998/wjcc.v10.i17.5655


