Copyright
©The Author(s) 2022.
World J Clin Cases. Apr 26, 2022; 10(12): 3856-3865
Published online Apr 26, 2022. doi: 10.12998/wjcc.v10.i12.3856
Published online Apr 26, 2022. doi: 10.12998/wjcc.v10.i12.3856
Figure 1 Abdominal magnetic resonance imaging in December 2014.
Abdominal magnetic resonance imaging showed the tumor infiltrated the whole stratum of the gallbladder wall (blue arrow) and metastasized to the left and right liver (red arrow).
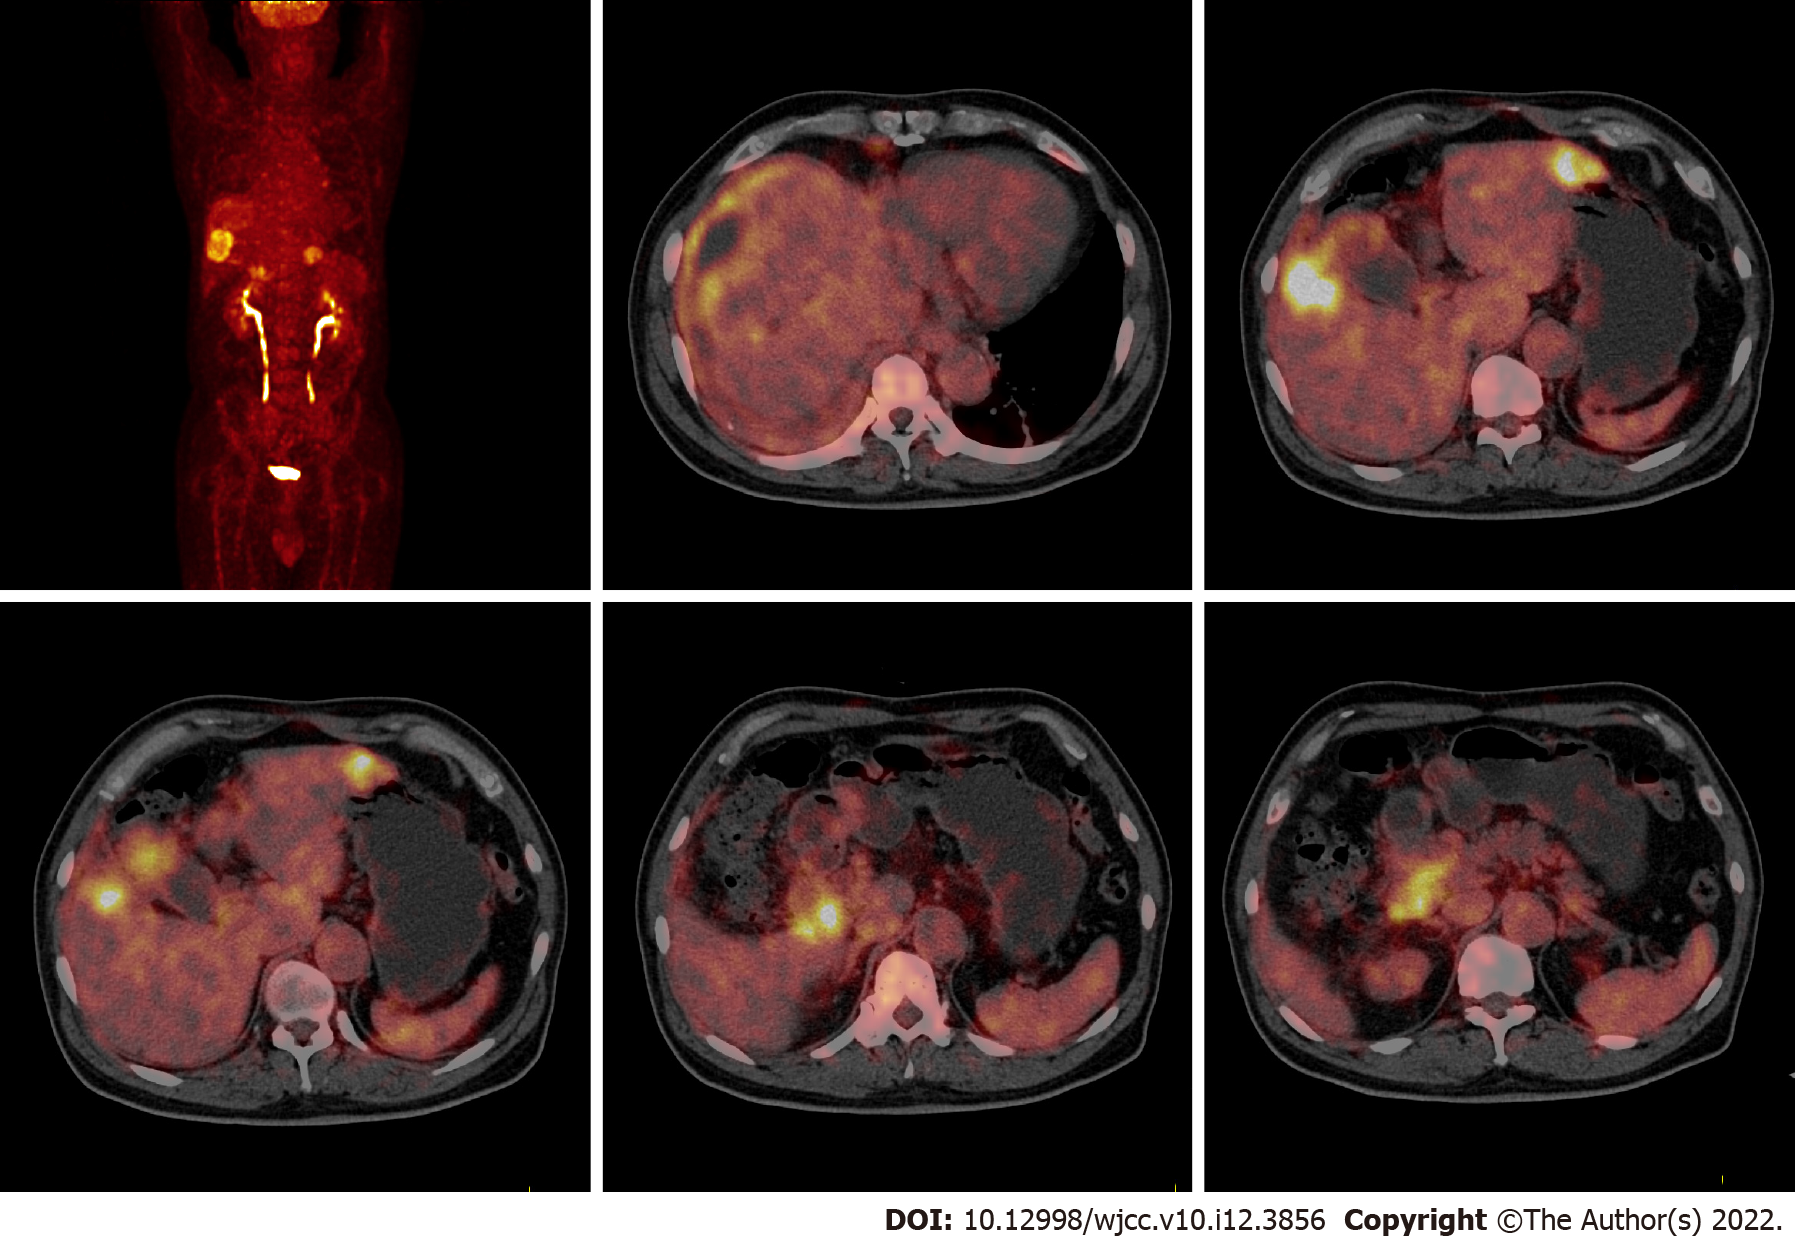
Figure 2 18F-fluorodeoxyglucose positron emission tomography/computed tomography in December 2014.
18F-fluorodeoxyglucose positron emission tomography/computed tomography depicted gallbladder cancer with multiple liver metastases, peritoneum metastasis, diaphragm metastasis and lymph node metastases.
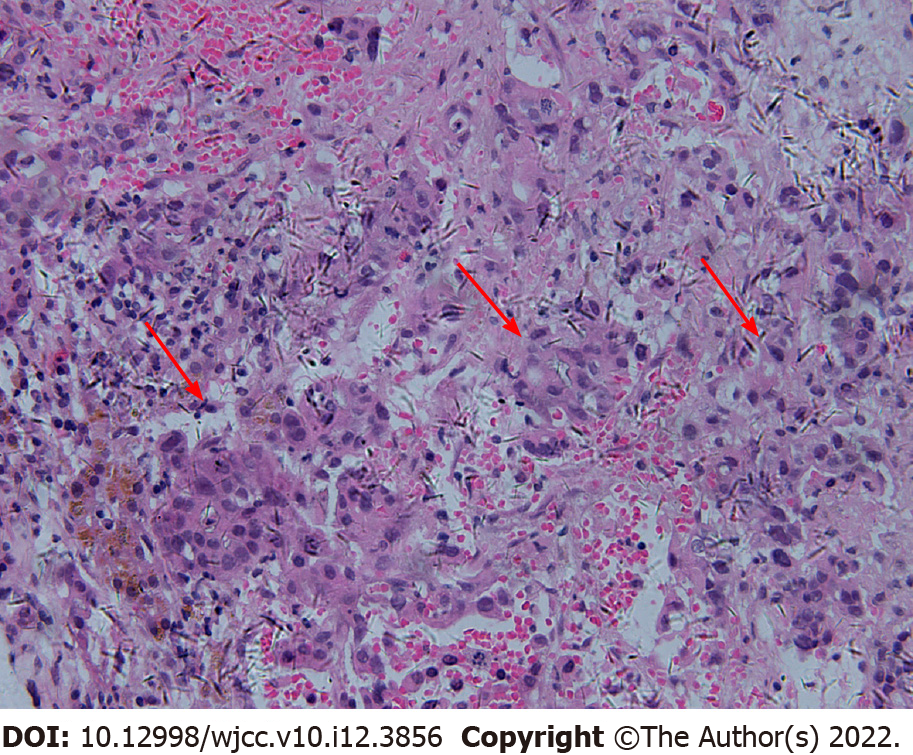
Figure 3 Pathology of fine needle aspiration of the liver metastases in December 2014.
Pathological result indicated that adenocarcinoma, and the tumor cells showed a tubular and nested infiltrating growth (red arrow).
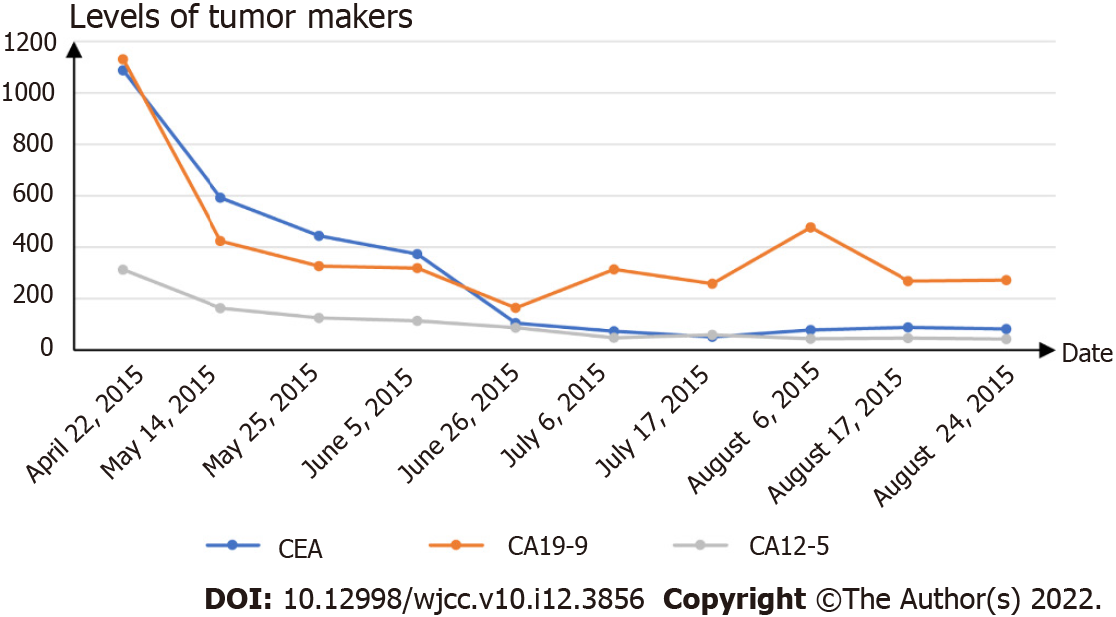
Figure 4 The tumor markers levels during chemotherapy and targeted therapy.
The levels of carcinoembryonic antigen, carbohydrate antigen19-9 (CA19-9) and CA12-5 gradually decreased but remained higher than the normal levels during chemotherapy and targeted therapy. CEA: Carcinoembryonic antigen; CA19-9: Carbohydrate antigen19-9; CA12-5: Carbohydrate antigen12-5.
Figure 5 Abdominal magnetic resonance imaging in August 2015.
Abdominal magnetic resonance imaging showed that the gallbladder was malformed and that the right liver metastasis was larger than the prior scan (red arrow).
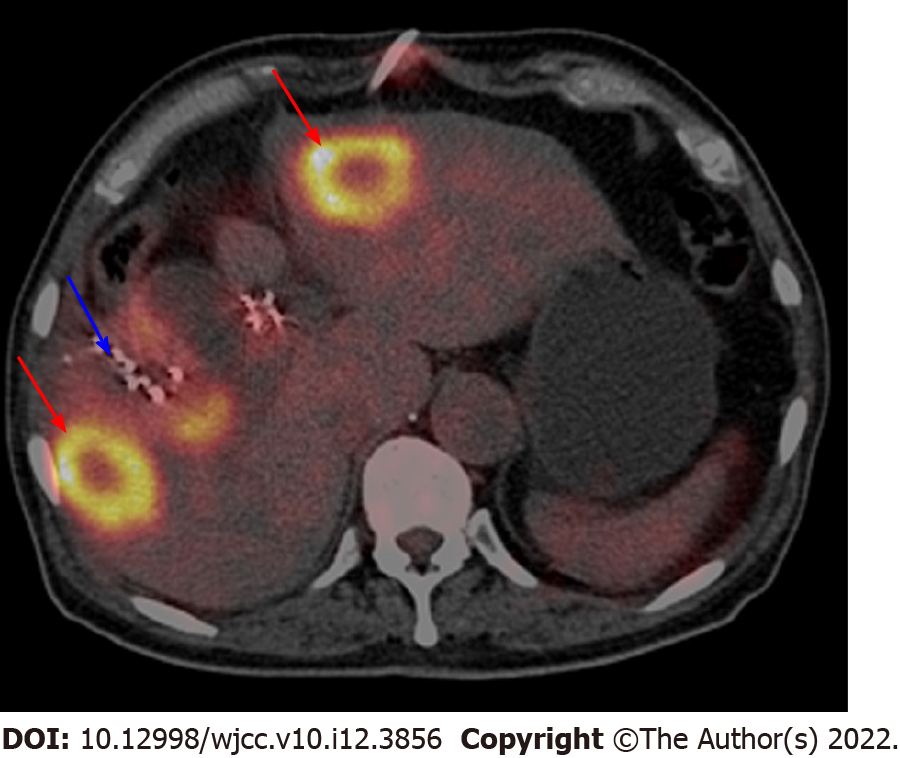
Figure 6 18F-fluorodeoxyglucose positron emission tomography/computed tomography in March 2016.
18F-fluorodeoxyglucose positron emission tomography/computed tomography showed that 125I seeds were around the gallbladder, but the gallbladder was not clearly visible (blue arrow). The left and right liver metastases still existed (red arrow).
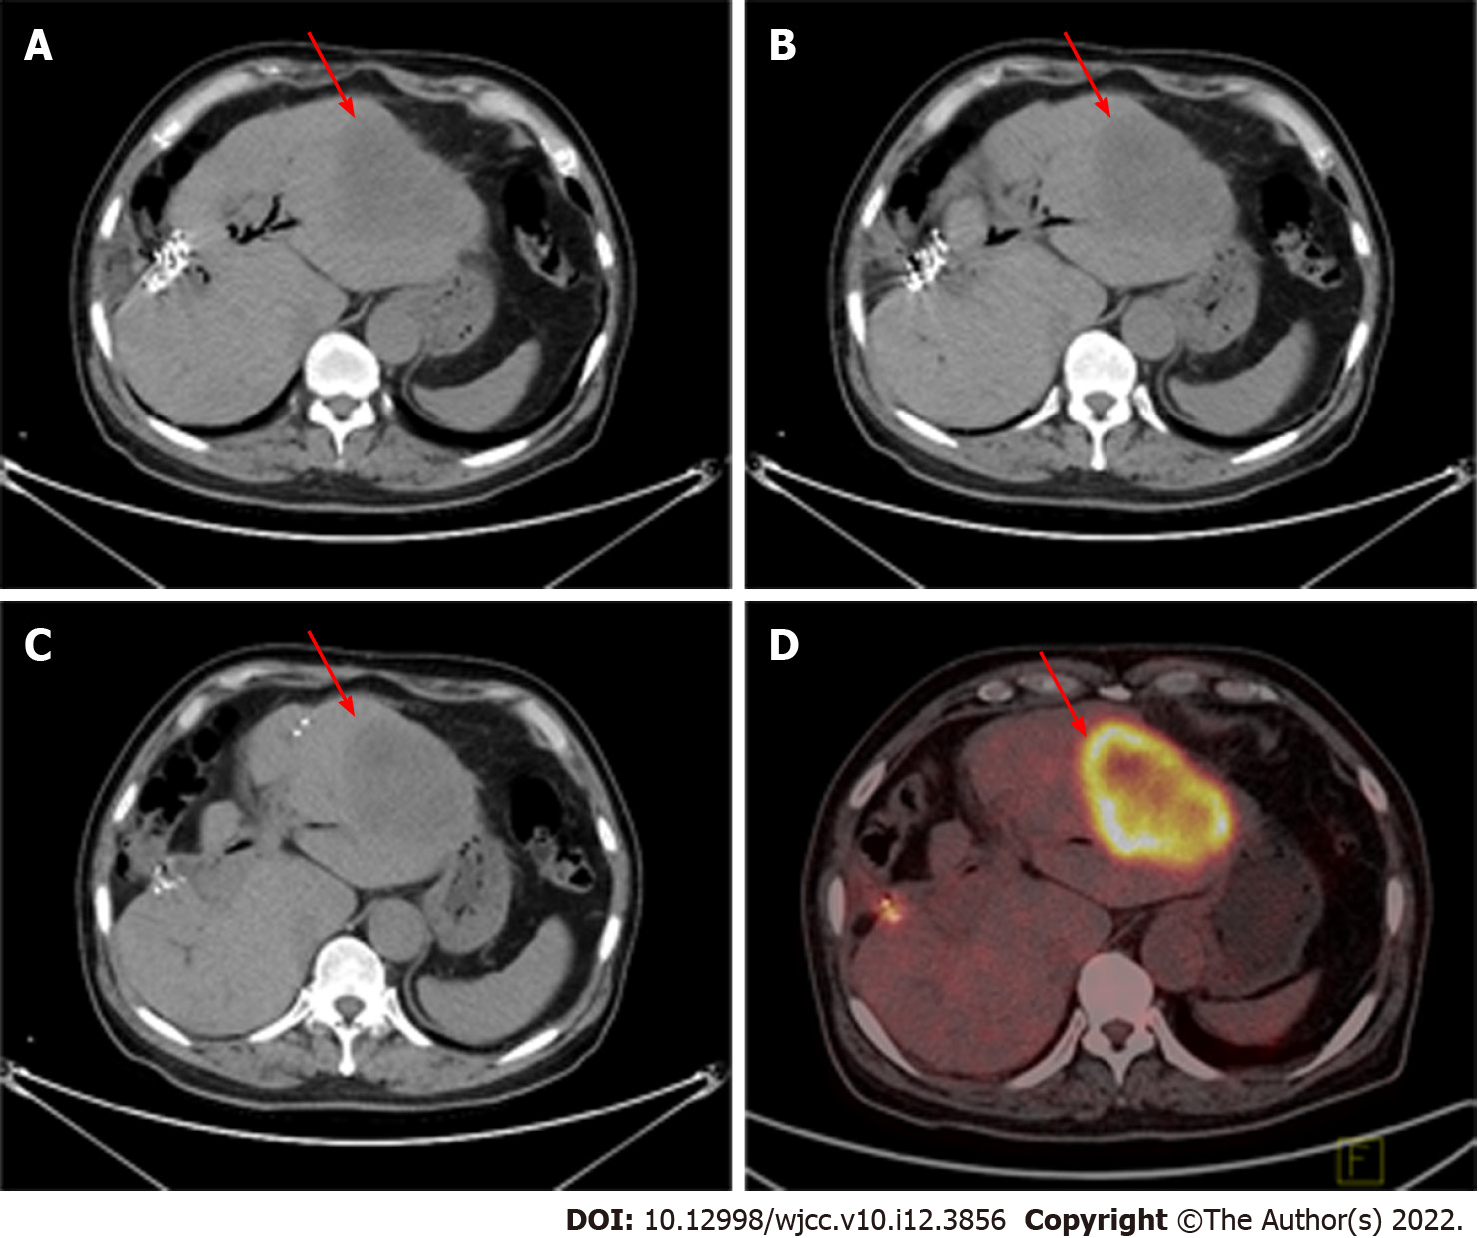
Figure 7 Abdominal computed tomography and 18F-fluorodeoxyglucose positron emission tomography/computed tomography in February 2018.
A-C: Abdominal computed tomography showed that the gallbladder had disappeared and that the liver metastasis was limited to the left liver (red arrow); D: 18F-fluorodeoxyglucose positron emission tomography/computed tomography showed that the liver metastasis was limited to the left liver (red arrow).
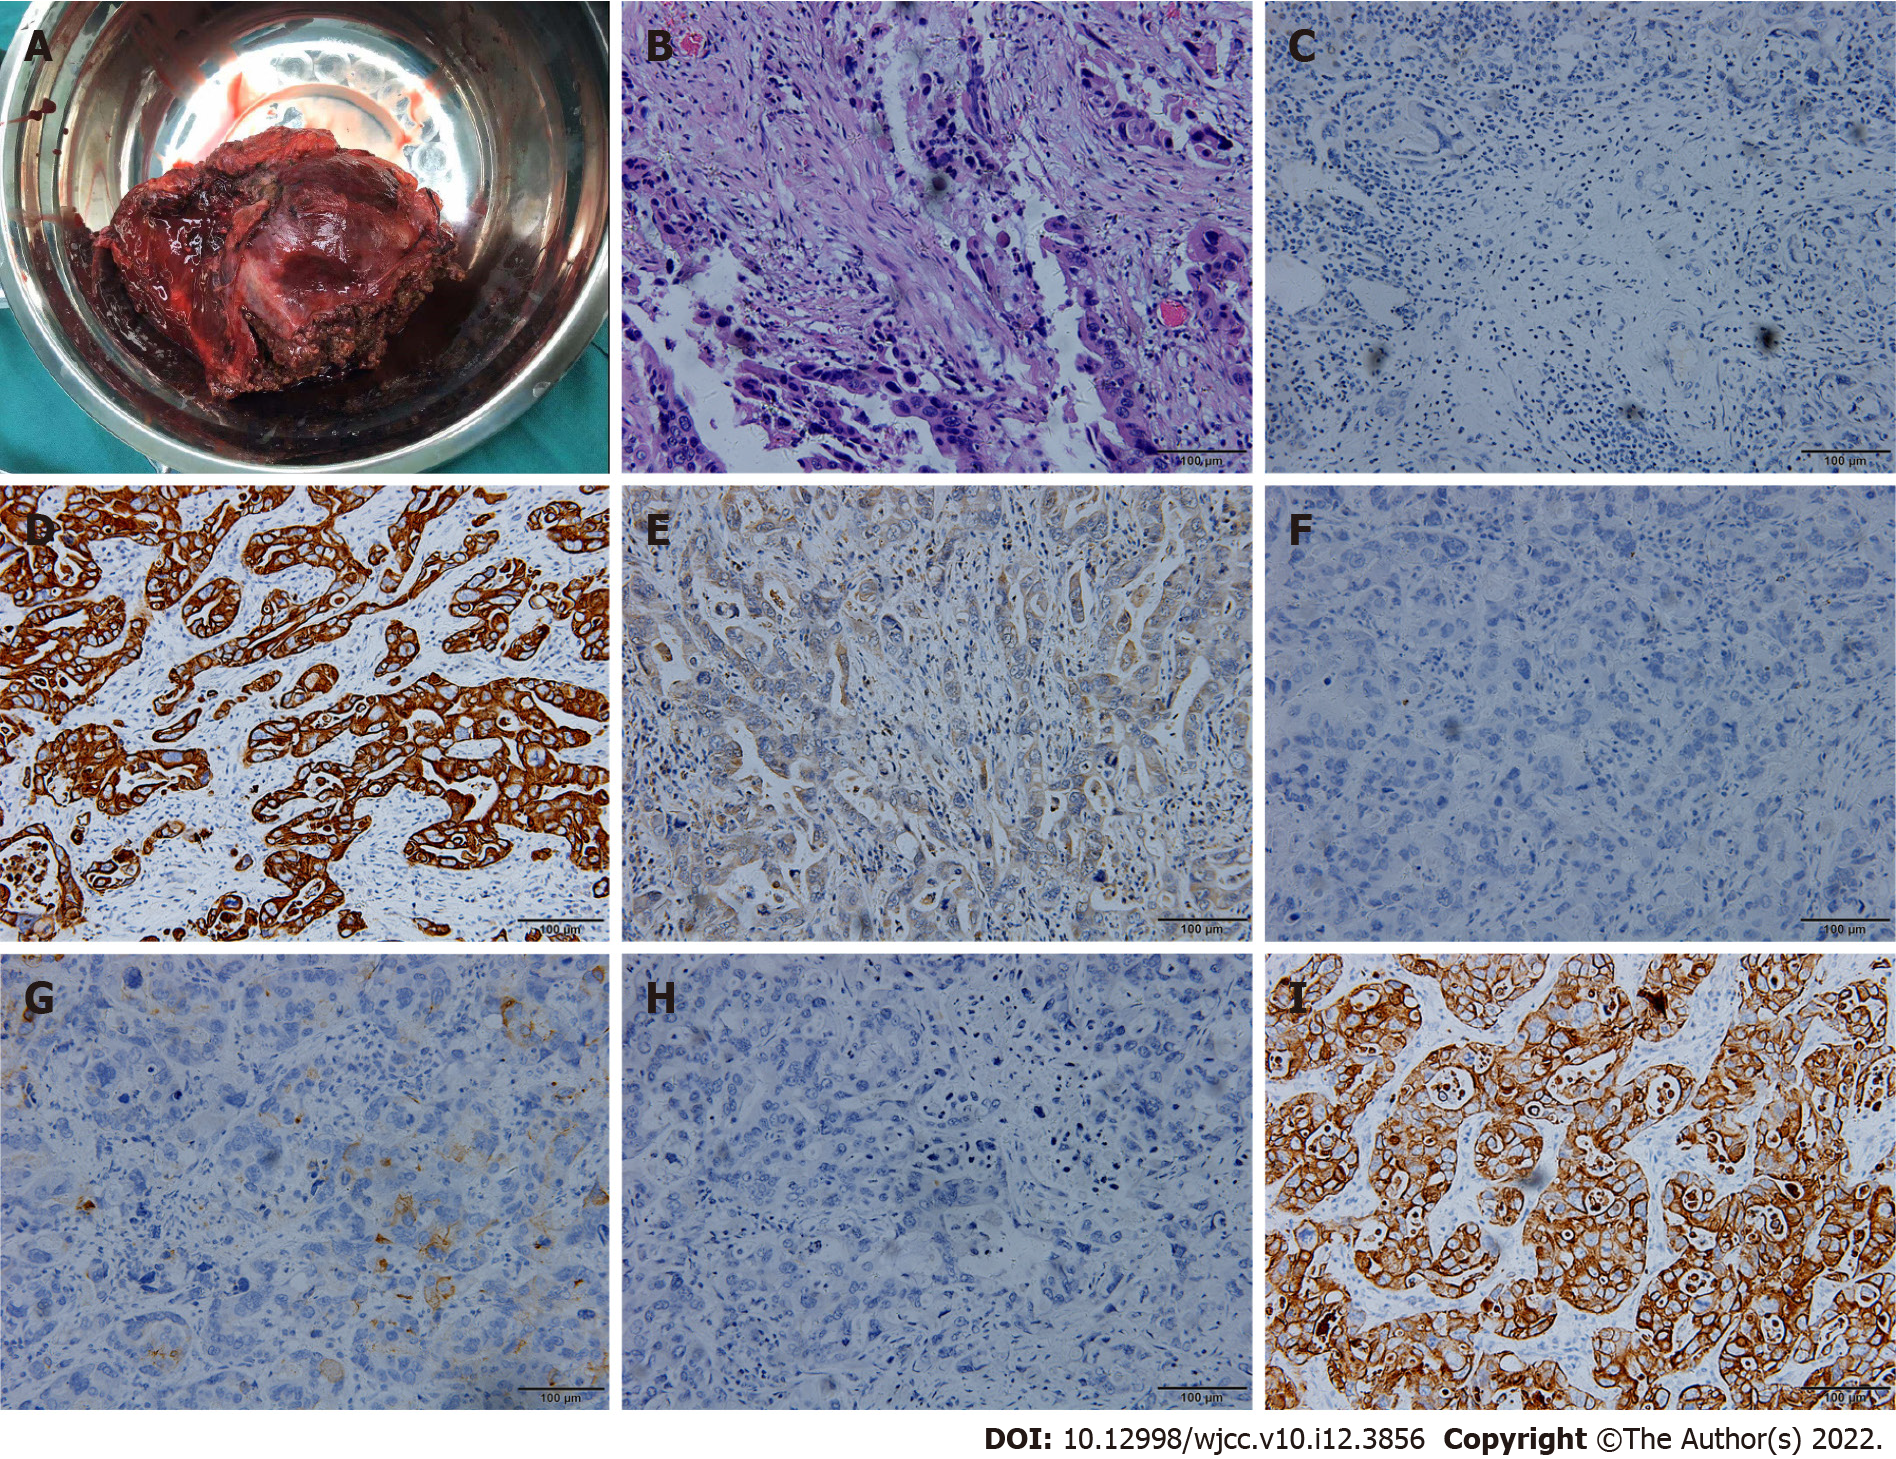
Figure 8 Surgical specimen, hematoxylin-eosin staining and immunohistochemical examination.
A: Surgical specimen; B: Hematoxylin-eosin staining showed tumor cells grew in infiltrating glandular ducts and nests (× 200); C: Immunohistochemical examination indicated ARGINASE-1 (-) (× 200); D: Immunohistochemical examination indicated CK19 (+) (× 200); E: Immunohistochemical examination indicated GPC-3 (partial +) (× 200); F: Immunohistochemical examination indicated hep-par (-) (× 200); G: Immunohistochemical examination indicated CEA (partial+) (× 200); H: Immunohistochemical examination indicated CK20 (-) (× 200); I: Immunohistochemical examination indicated CK7 (+) (× 200).
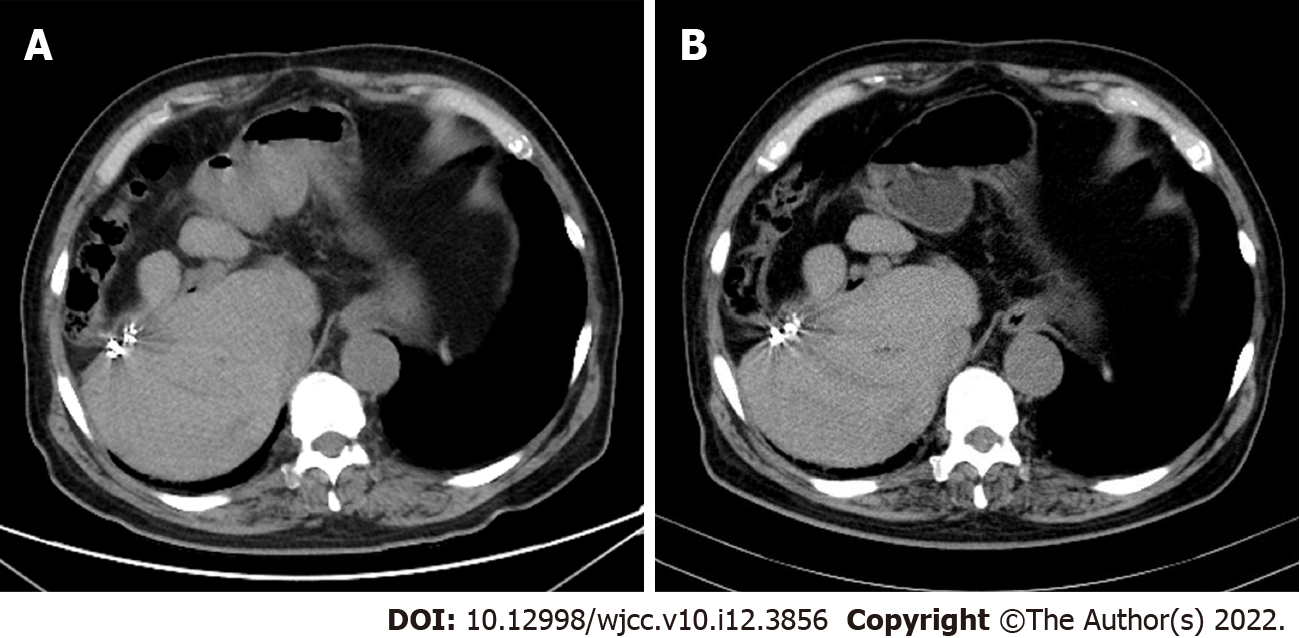
Figure 9 Abdominal computed tomography of follow-up.
A: Abdominal computed tomography (CT) in October 2019 showed postoperative changes and no signs of tumor recurrence; B: Abdominal CT in March 2021 showed postoperative changes and no signs of tumor recurrence.
- Citation: Zhang B, Li S, Liu ZY, Peiris KGK, Song LF, Liu MC, Luo P, Shang D, Bi W. Successful multimodality treatment of metastatic gallbladder cancer: A case report and review of literature. World J Clin Cases 2022; 10(12): 3856-3865
- URL: https://www.wjgnet.com/2307-8960/full/v10/i12/3856.htm
- DOI: https://dx.doi.org/10.12998/wjcc.v10.i12.3856


