Copyright
©The Author(s) 2022.
World J Clin Cases. Apr 26, 2022; 10(12): 3720-3728
Published online Apr 26, 2022. doi: 10.12998/wjcc.v10.i12.3720
Published online Apr 26, 2022. doi: 10.12998/wjcc.v10.i12.3720
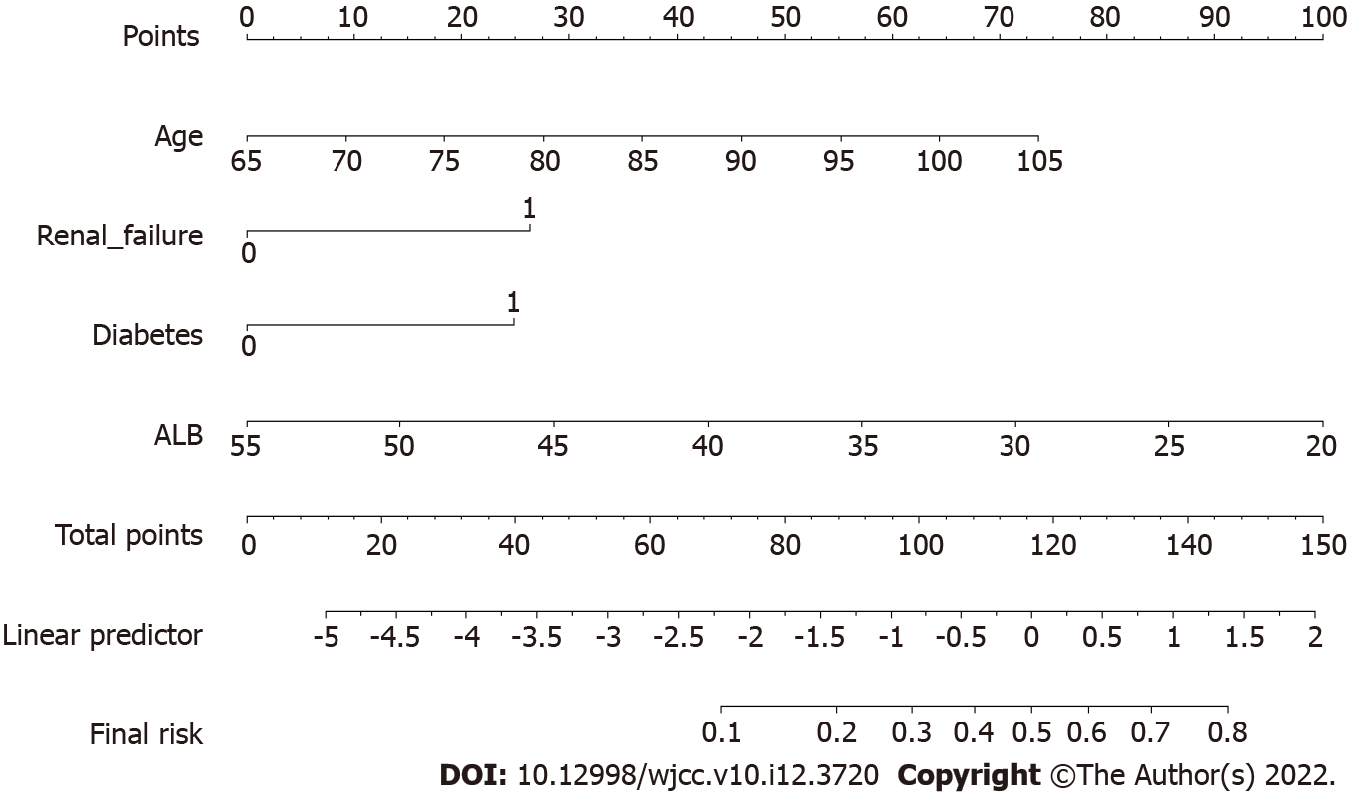
Figure 1 Nomogram.
The Morbidity and Mortality Acute Predictor (arthro-MAP). The nomogram computes the probability of having a postoperative complication. In order to compute the predicted complication probability, a vertical line is to be drawn from the values of the individual variables to the scale for points on the top. Then a vertical line from the total points to the corresponding predicted complication probability.
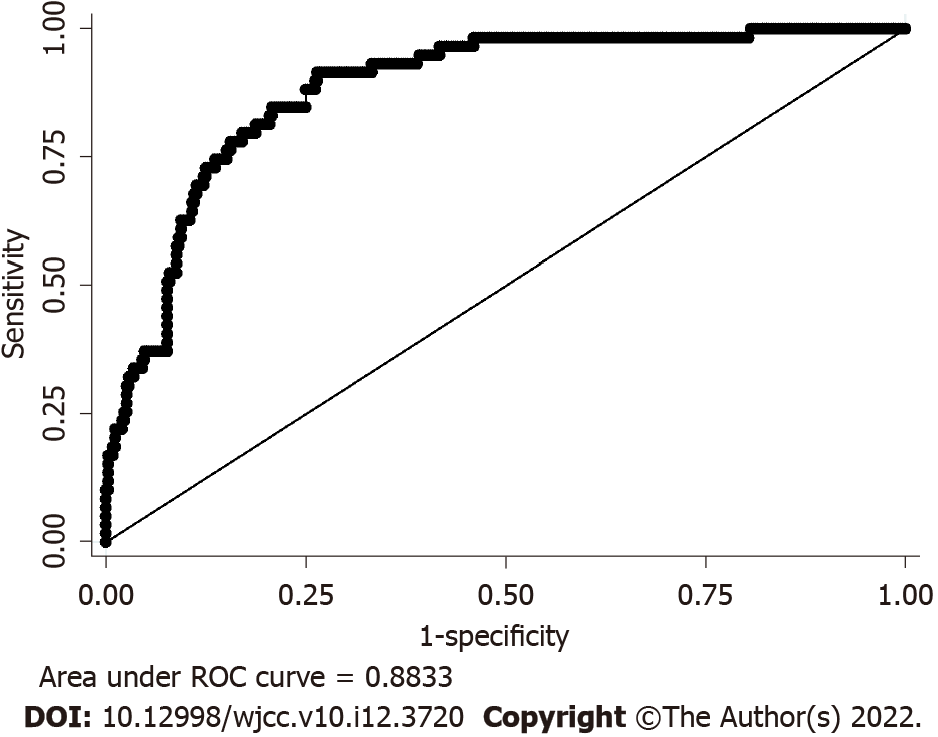
Figure 2 Receive operating characteristic curve.
It also name sensitivity curve, the area under curve (AUC) can evaluate the nomogram model discrimination degree. AUC > 0.6: May make sence; AUC > 0.7: Not bad; AUC > 0.8: Excellent. ROC: Receive operating characteristic; AUC: Area under curve.
Figure 3 Hosmer-Lemeshow test.
The null hypothesis is that the fitting probability pi is grouped by 10 decile, and the difference between the fitted value and the observed value in each group, P < 0.05 shows that the scatter separation is significantly deviated from the reference line, the predicted value is not equal to the actual value. Otherwise, the test passes, the predicted value is equal to the actual value.
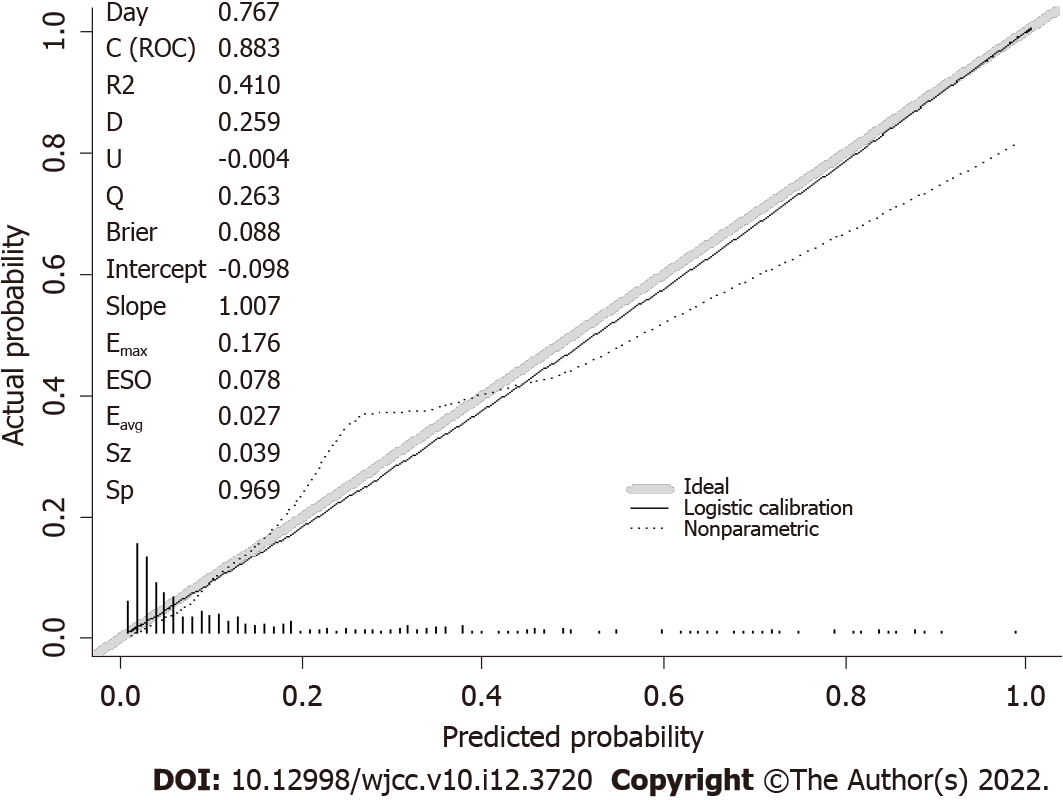
Figure 4 Calibration plot.
A calibration plot compares the model’s predicted probabilities and observed proportions. The diagonal line reflects the ideal situation (predicted probability = observed proportion). The curve represents the relation nonparametrically. The calibration curve is a straight line with a slope close to 1, indicating that this model predicts postoperative complication risk in elderly total hip replacement patients consistent with the actual risk.
- Citation: Tan XJ, Gu XX, Ge FM, Li ZY, Zhang LQ. Nomogram to predict postoperative complications in elderly with total hip replacement. World J Clin Cases 2022; 10(12): 3720-3728
- URL: https://www.wjgnet.com/2307-8960/full/v10/i12/3720.htm
- DOI: https://dx.doi.org/10.12998/wjcc.v10.i12.3720


