Copyright
©The Author(s) 2022.
World J Clin Cases. Jan 7, 2022; 10(1): 177-188
Published online Jan 7, 2022. doi: 10.12998/wjcc.v10.i1.177
Published online Jan 7, 2022. doi: 10.12998/wjcc.v10.i1.177
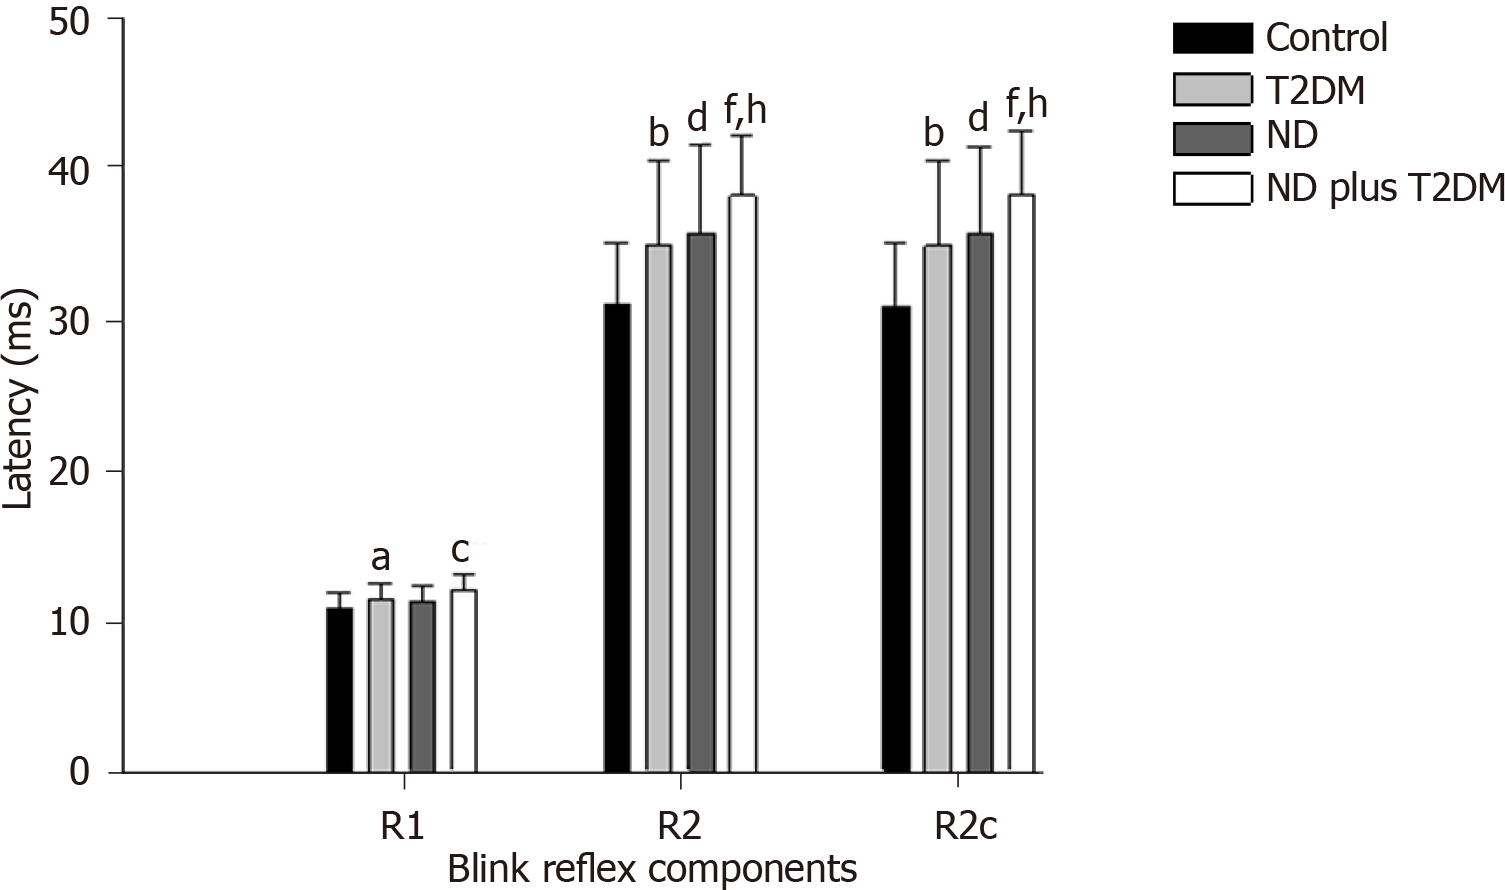
Figure 1 Comparisons of the blink reflex latencies by study group.
R1: aP < 0.05, Control vs T2DM; cP < 0.001, Control vs ND plus T2DM. R2, R2c: bP < 0.001, Control vs T2DM; dP < 0.001, Control vs ND; fP < 0.001, Control vs ND plus T2DM; hP < 0.001, T2DM vs ND plus T2DM. T2DM: Type 2 diabetes mellitus; ND: Neurocognitive disorder.
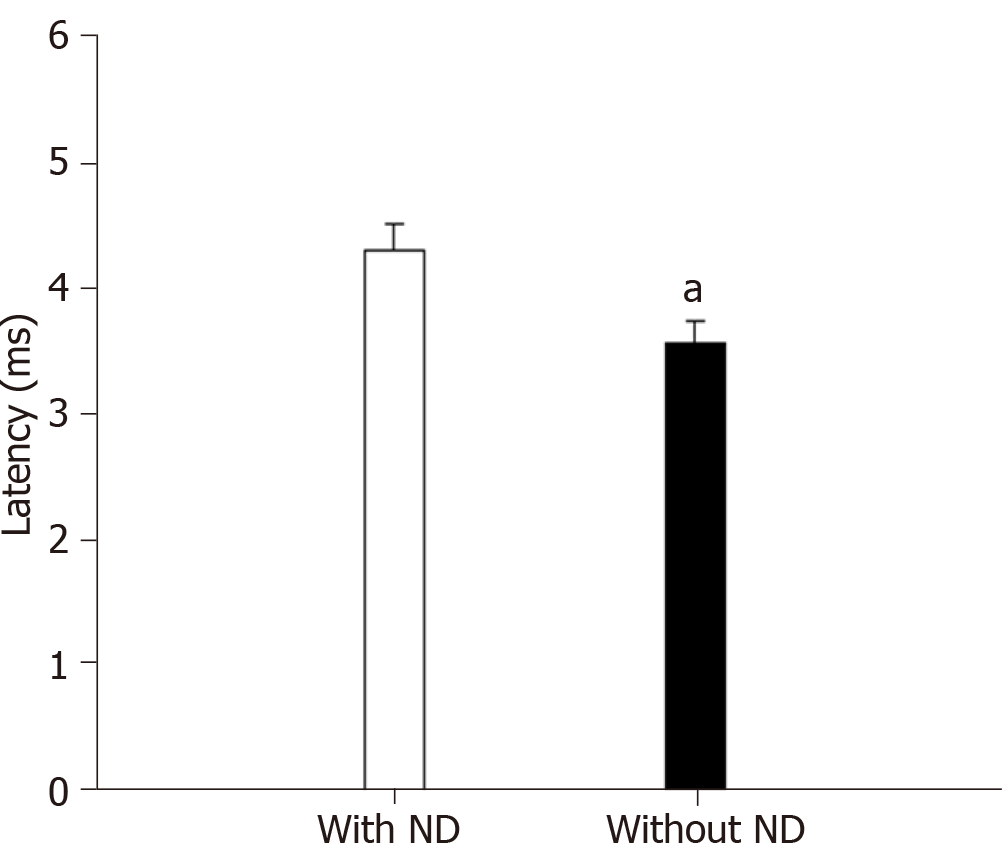
Figure 2 Comparisons of the masseter reflex latencies with and without neurocognitive disorder.
Bars represent the mean and one standard deviation values. aP < 0.05, Mann-Whitney U test. ND: Neurocognitive disorder.
- Citation: Bricio-Barrios JA, Ríos-Bracamontes E, Ríos-Silva M, Huerta M, Serrano-Moreno W, Barrios-Navarro JE, Ortiz GG, Huerta-Trujillo M, Guzmán-Esquivel J, Trujillo X. Alterations in blink and masseter reflex latencies in older adults with neurocognitive disorder and/or diabetes mellitus. World J Clin Cases 2022; 10(1): 177-188
- URL: https://www.wjgnet.com/2307-8960/full/v10/i1/177.htm
- DOI: https://dx.doi.org/10.12998/wjcc.v10.i1.177


