Copyright
©The Author(s) 2025.
World J Methodol. Dec 20, 2025; 15(4): 102894
Published online Dec 20, 2025. doi: 10.5662/wjm.v15.i4.102894
Published online Dec 20, 2025. doi: 10.5662/wjm.v15.i4.102894
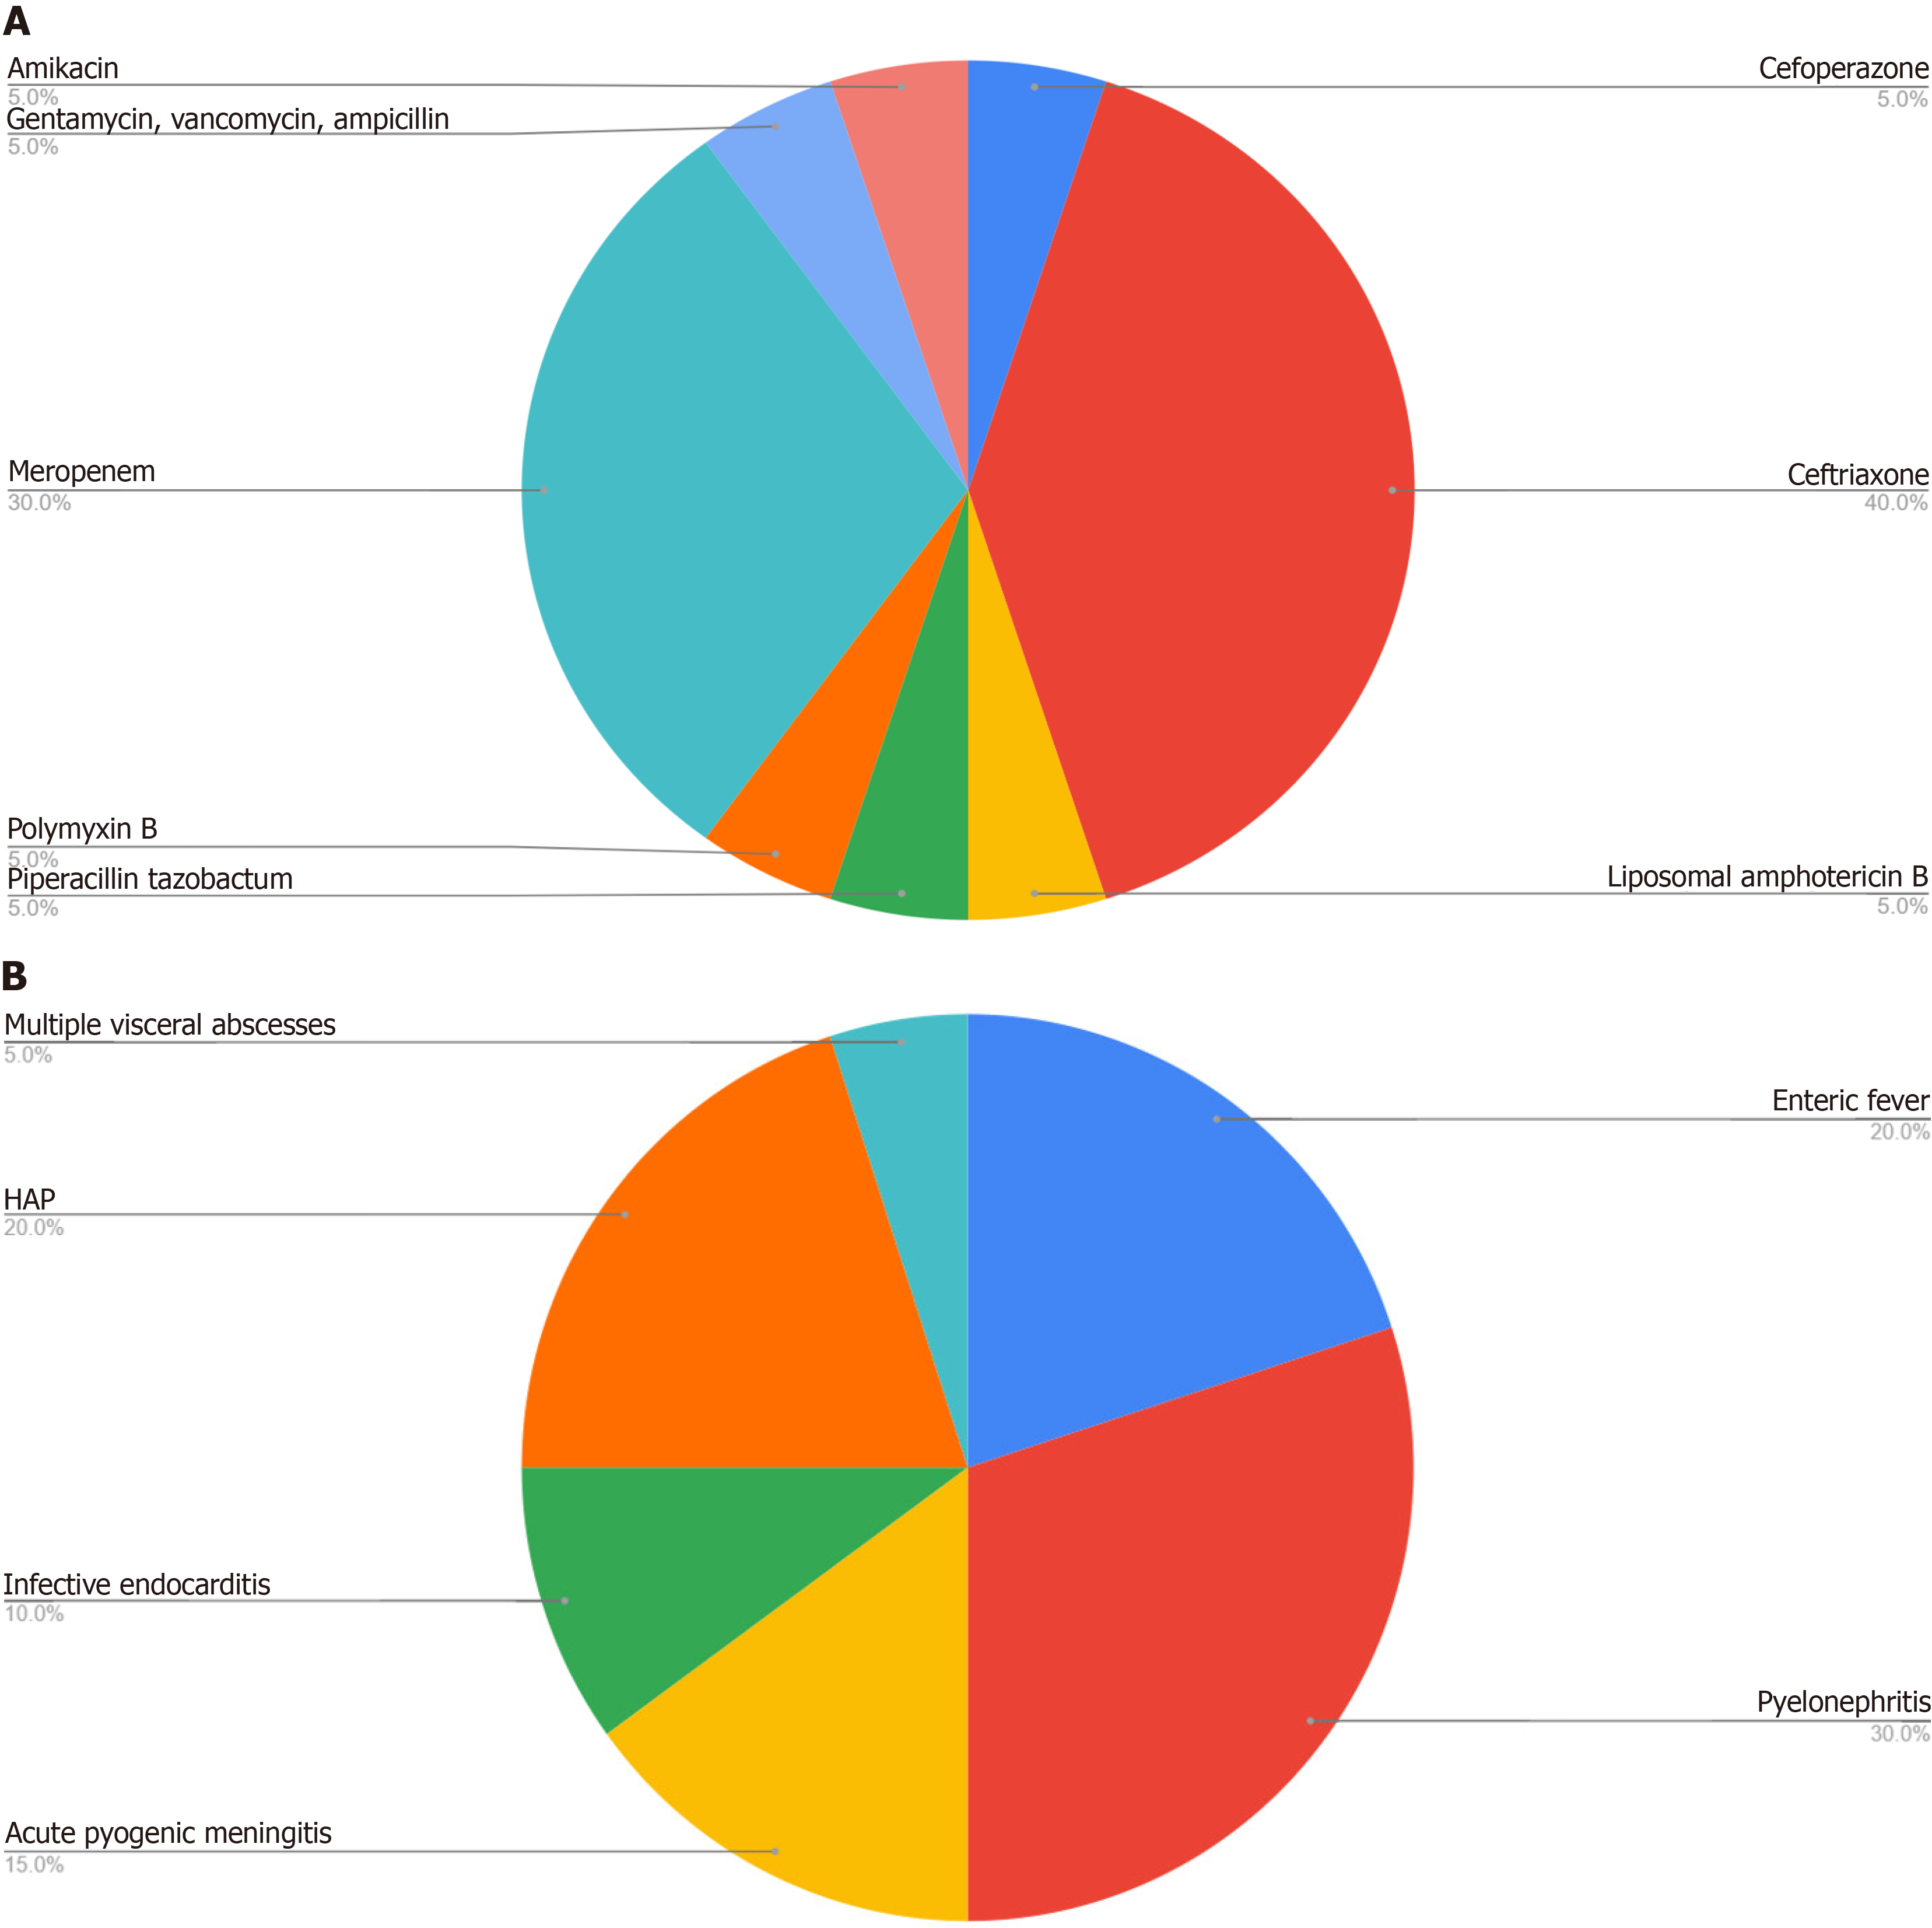
Figure 1 Pie chart representing the distribution of antimicrobials and infections among the 20 patients in the study.
A: Distribution of antimicrobials; B: Distribution of infections.
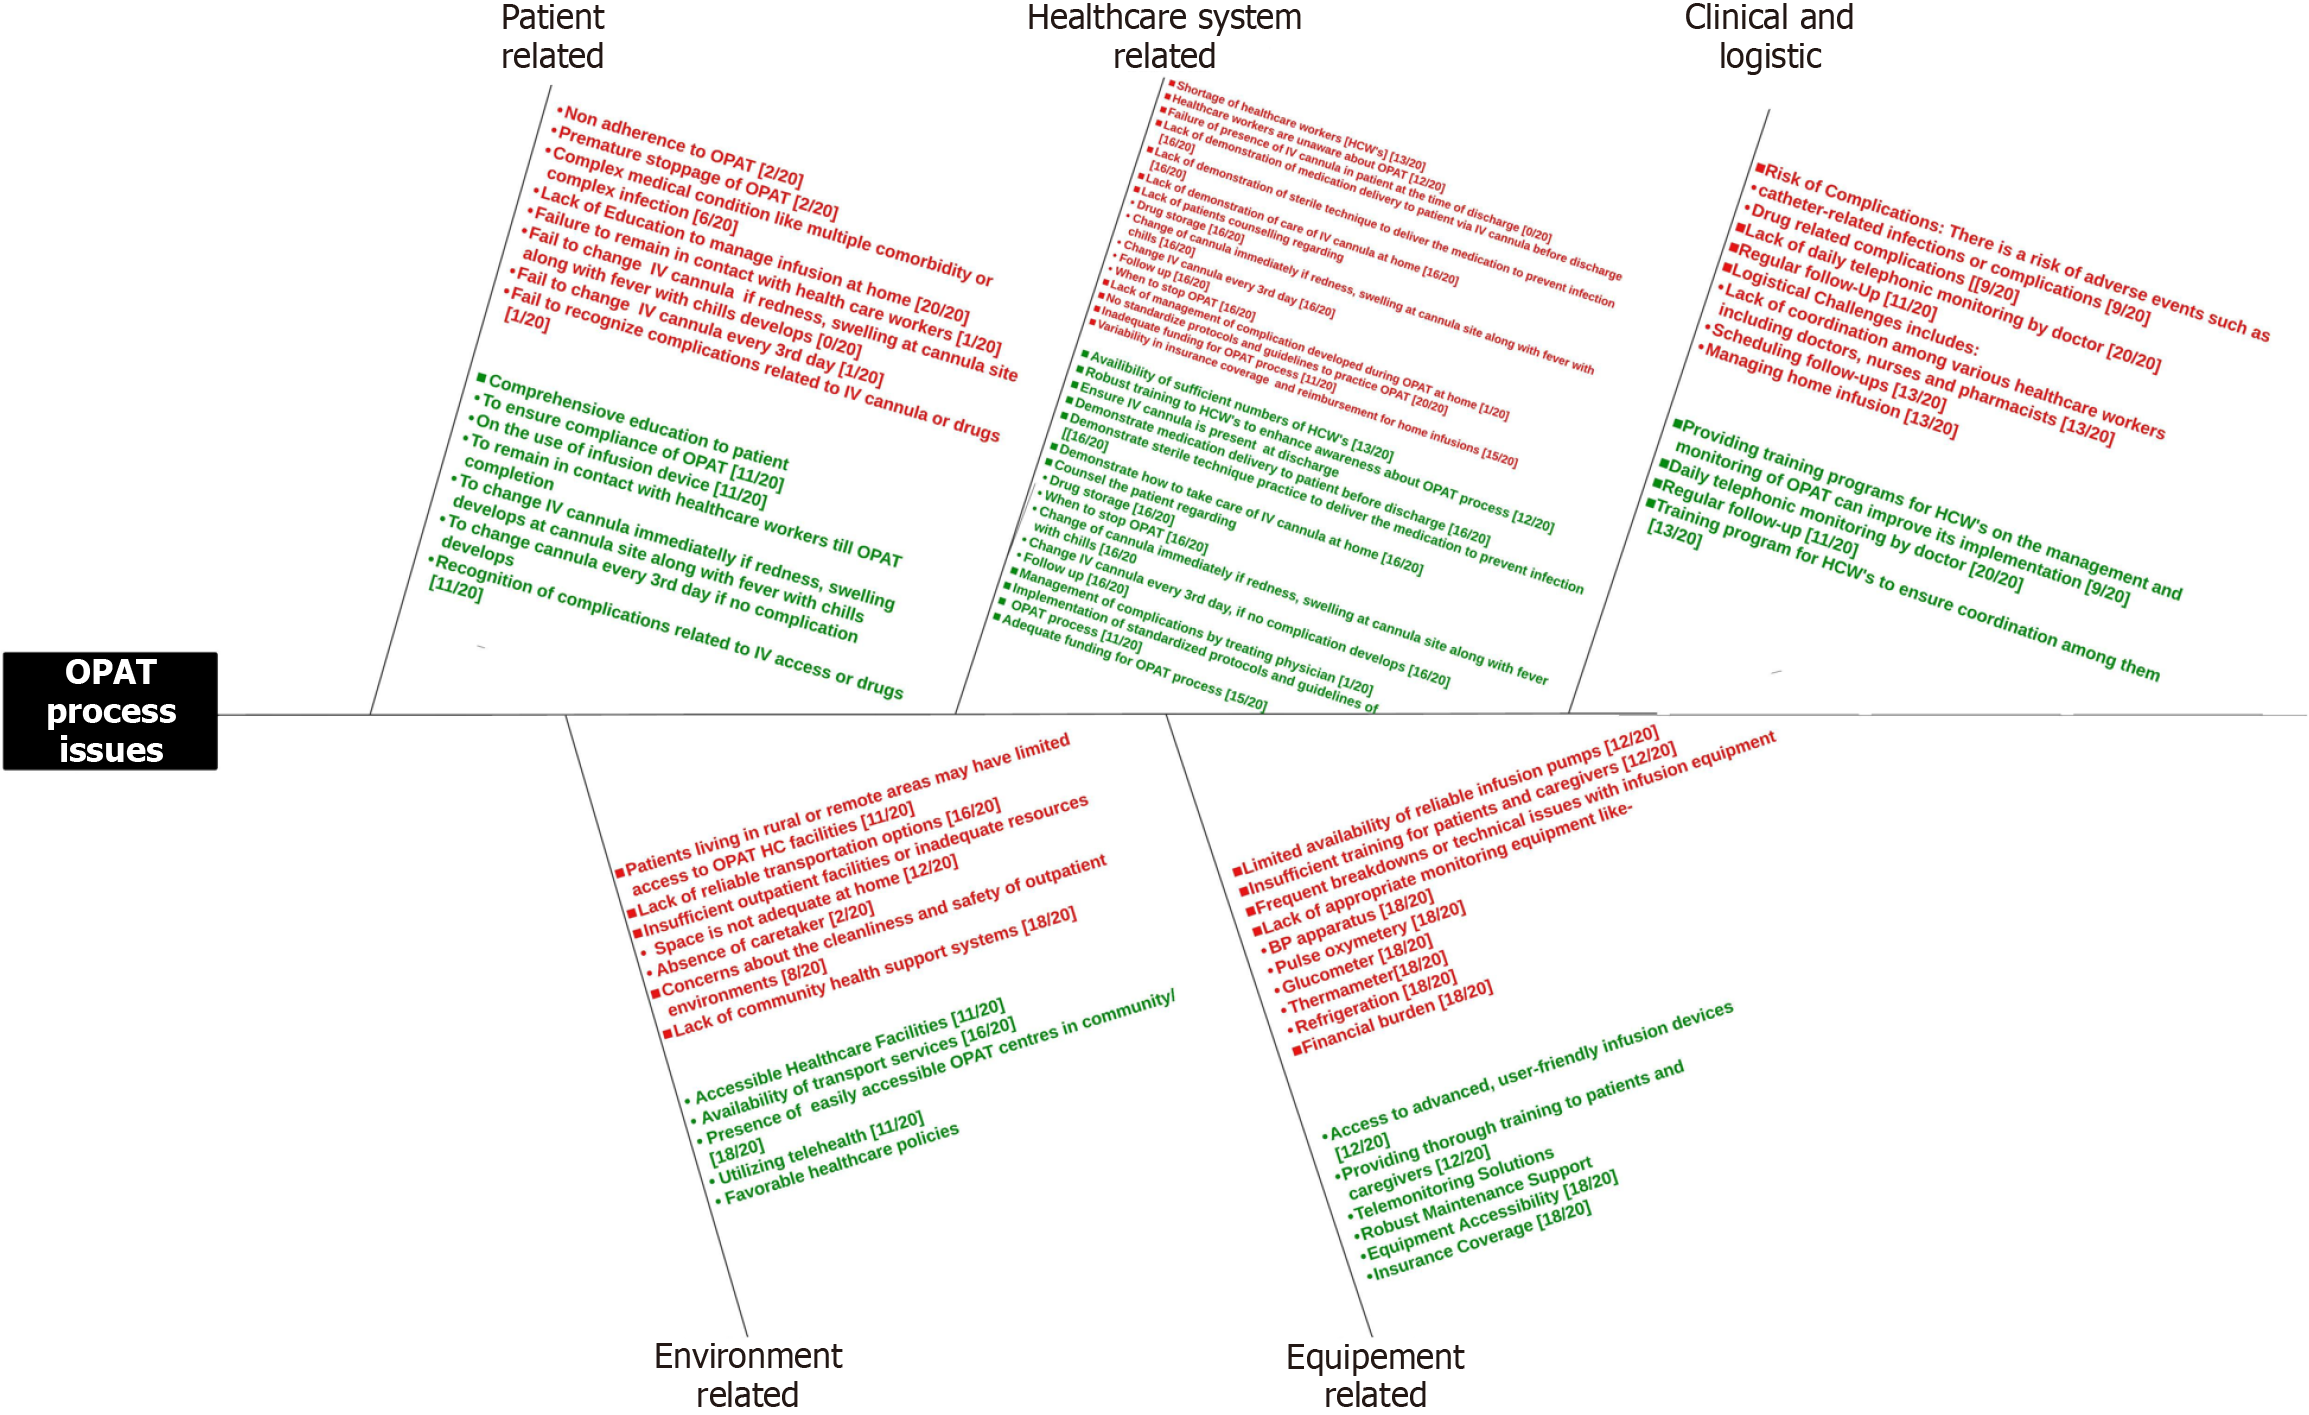
Figure 2 Various barriers and facilitators identified and represented in a fishbone diagram in the study.
OPAT: Outpatient parenteral anti
- Citation: Kumar A, Panda PK. Effectiveness, safety, and feasibility of outpatient parenteral antimicrobial therapy in a resource-limited setting: A pilot longitudinal study. World J Methodol 2025; 15(4): 102894
- URL: https://www.wjgnet.com/2222-0682/full/v15/i4/102894.htm
- DOI: https://dx.doi.org/10.5662/wjm.v15.i4.102894


