Copyright
©The Author(s) 2025.
World J Nephrol. Sep 25, 2025; 14(3): 108534
Published online Sep 25, 2025. doi: 10.5527/wjn.v14.i3.108534
Published online Sep 25, 2025. doi: 10.5527/wjn.v14.i3.108534
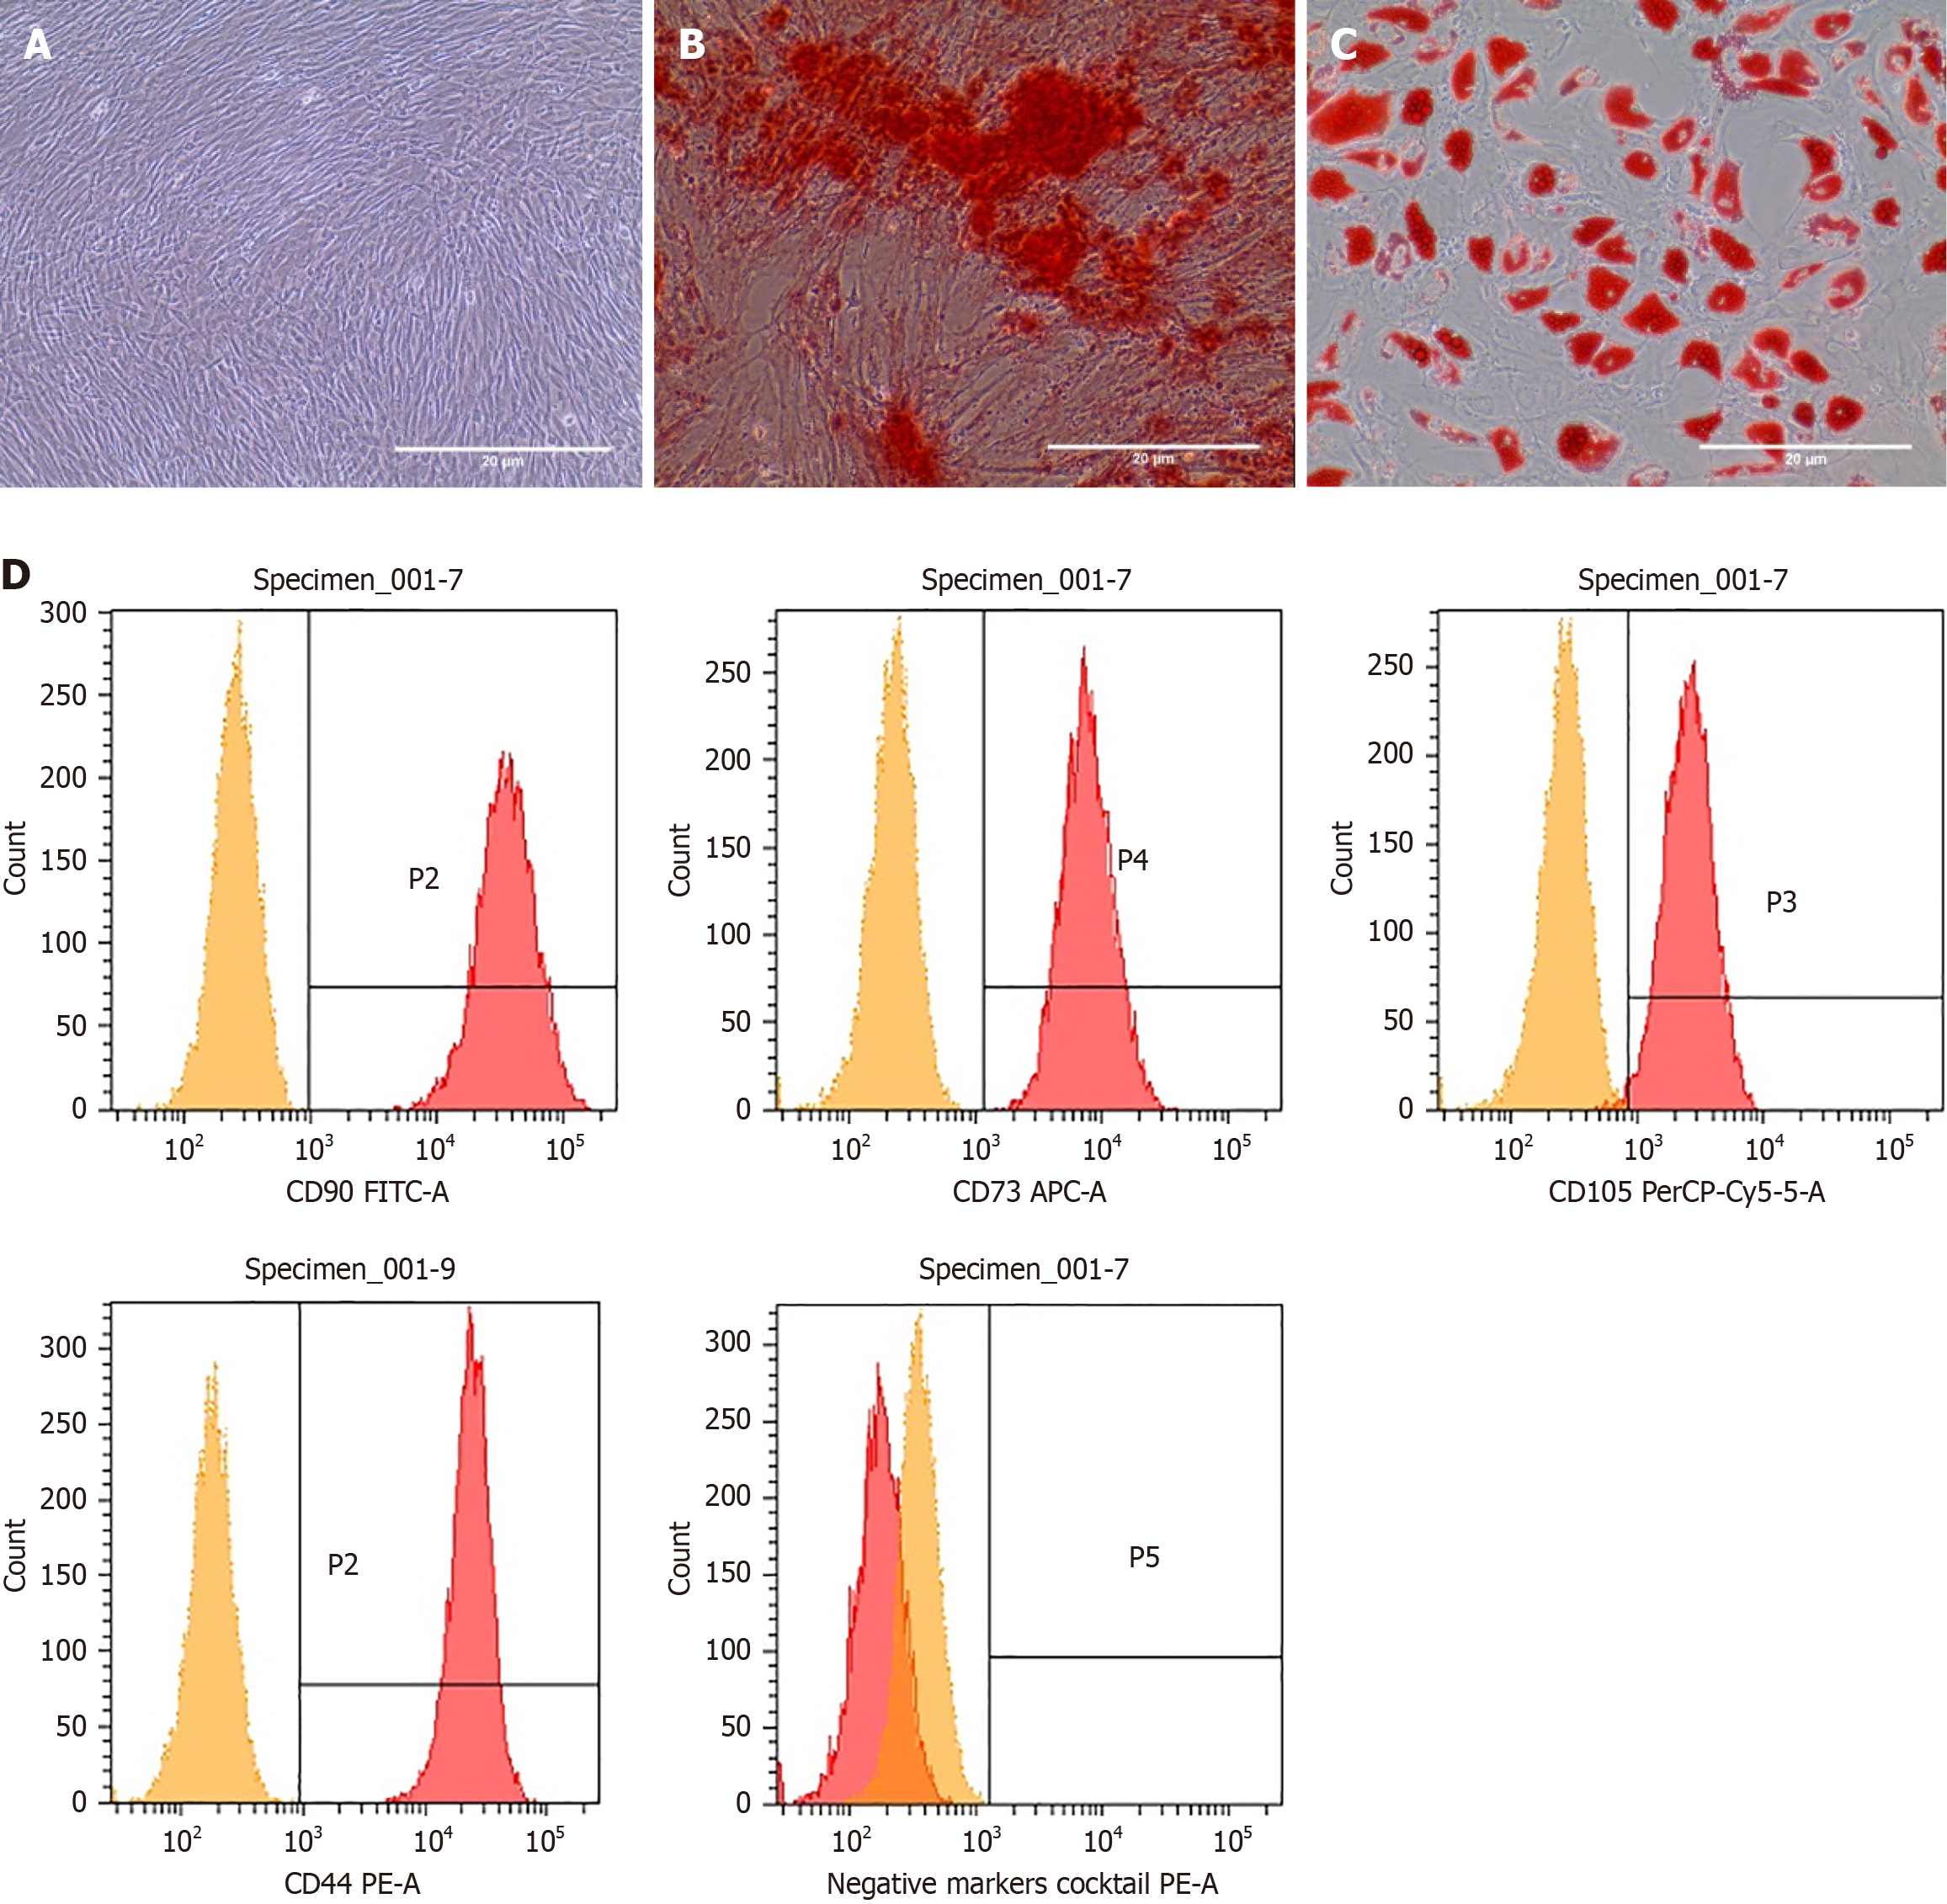
Figure 1 Characterization of adipose-derived mesenchymal stromal cells.
A: Adipose-derived mesenchymal stromal cells (ADMSCs) showed typical spindle-shaped, plastic-adherent morphology in culture; B: Alizarin red; C: Oil red O staining of osteogenic and adipogenic differentiation; D: Flow cytometry analysis of human MSC marker expression in ADMSCs.
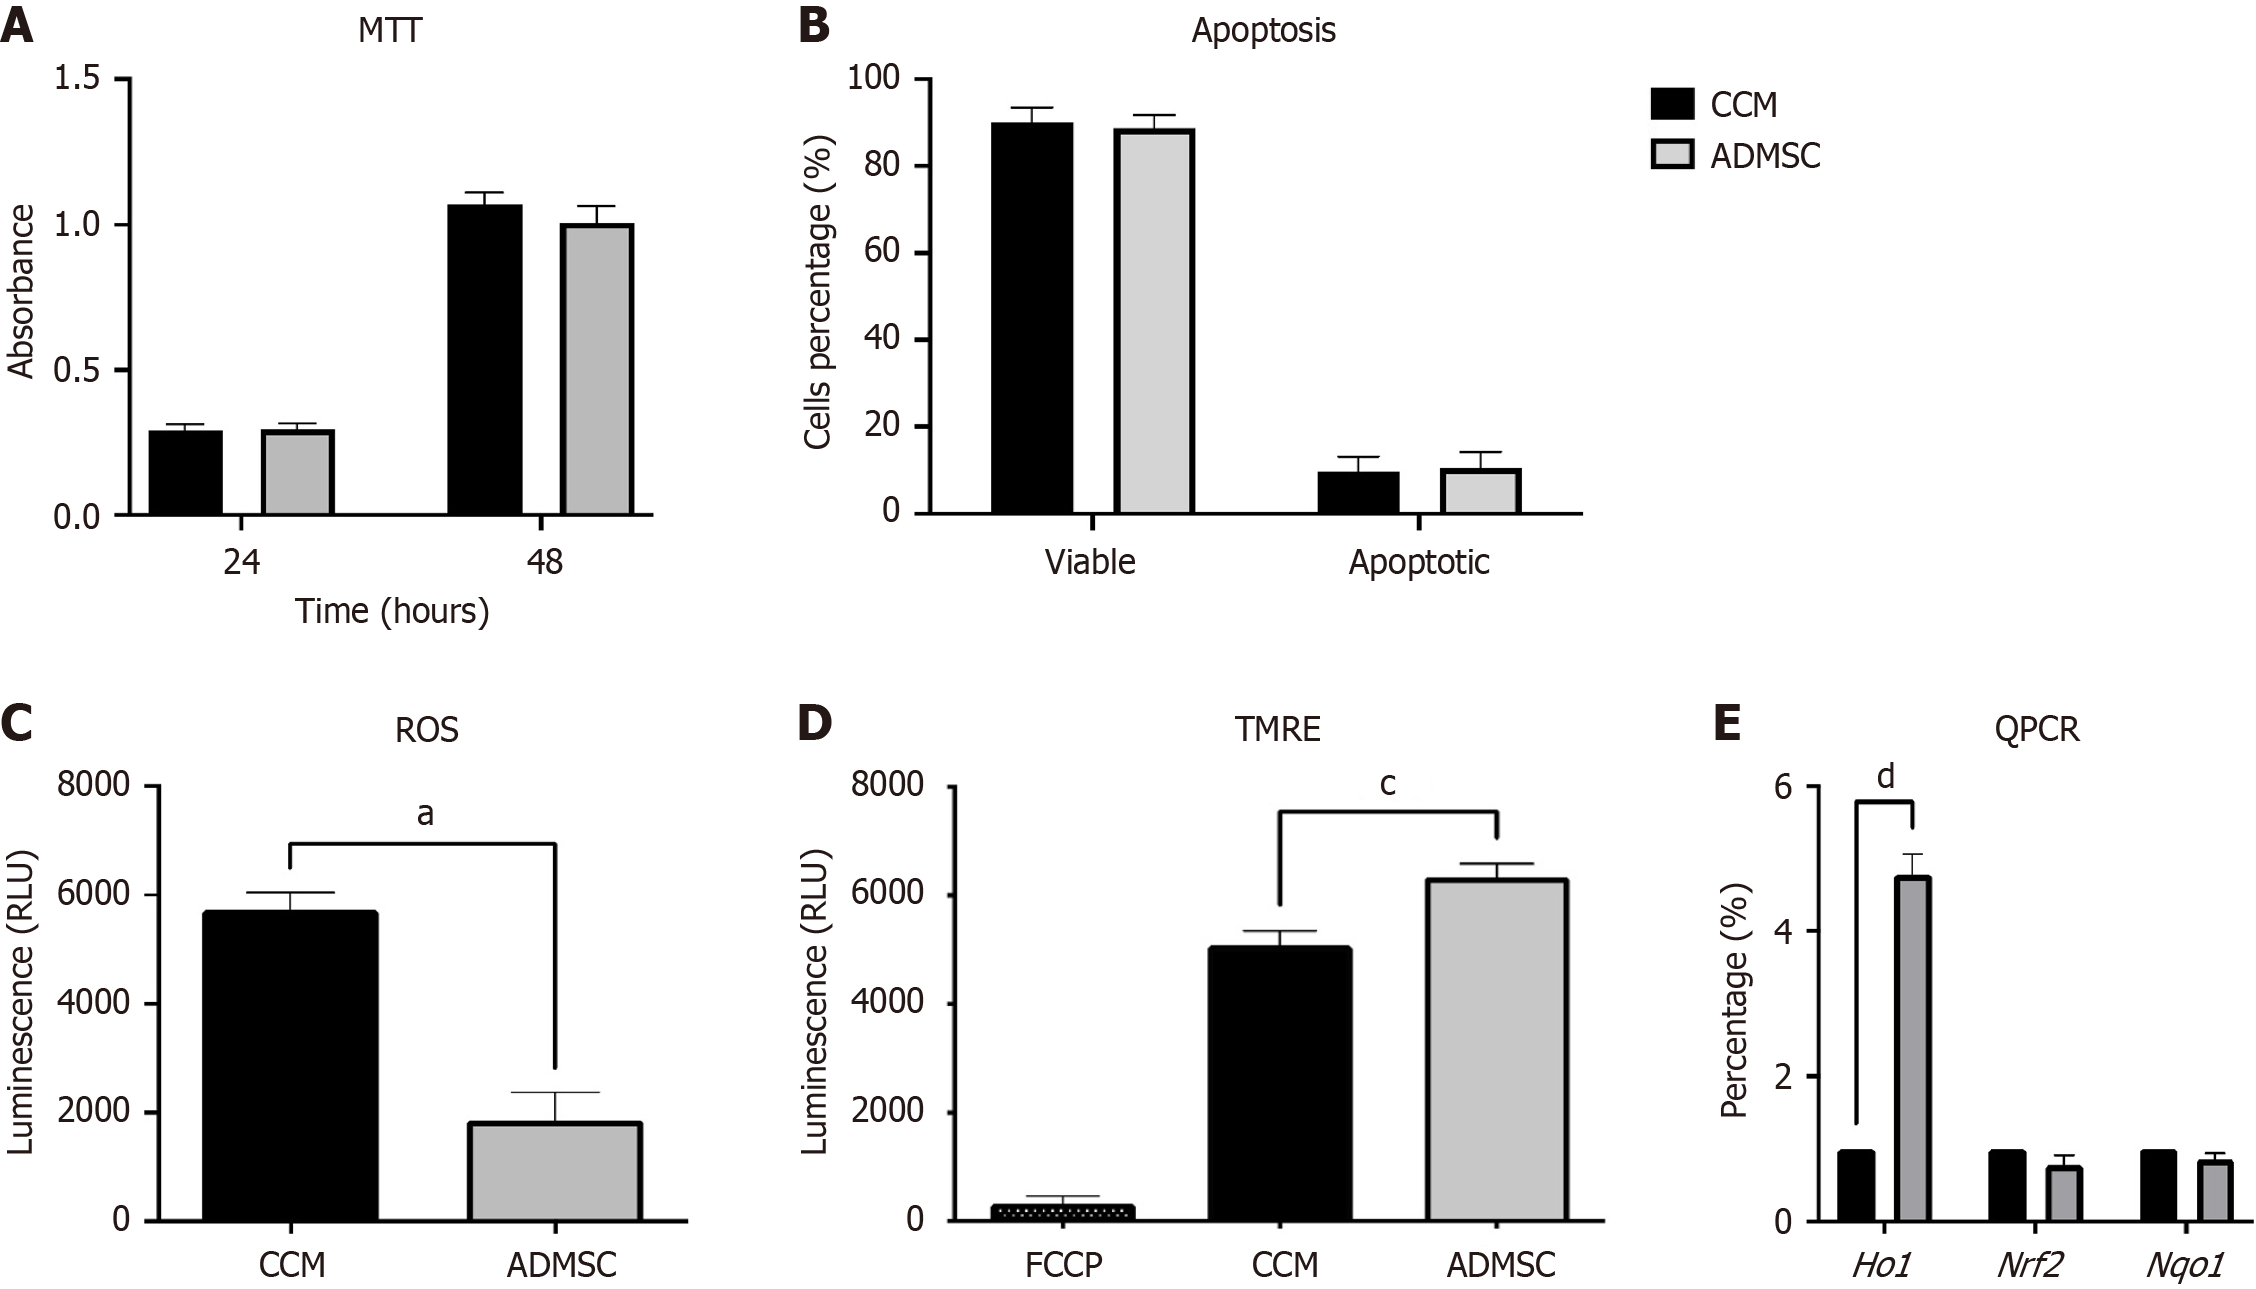
Figure 2 Effects of adipose-derived mesenchymal stromal cells treatment compared to cell culture media on cellular function and oxidative stress.
A: MTT assay showing cellular metabolic activity at 24 hours and 48 hours. Absorbance values indicate no significant difference between adipose-derived mesenchymal stromal cells (ADMSCs) and cell culture media (CCM) groups; B: Apoptosis analysis by flow cytometry indicating similar percentages of viable and apoptotic cells between groups; C: Intracellular reactive oxygen species (ROS) levels measured by luminescence. ADMSC treatment significantly reduced ROS levels compared to CCM (aP < 0.05); D: Mitochondrial membrane potential assessed by tetramethylrhodamine ethyl ester (TMRE) staining. ADMSC-treated cells showed significantly higher TMRE fluorescence, indicating improved mitochondrial function (cP < 0.001); E: Heme oxygenase 1 (HO-1), nuclear factor erythroid 2-related factor 2 (Nrf2), and NAD(P)H quinone dehydrogenase 1 (Nqo1) mRNA levels were measured using quantitative PCR. Relative expression of HO-1, Nrf2, and Nqo1 was calculated and normalized to the b-actin housekeeping gene control. Each value represents the mean ± SD (n = 4) (dP < 0.0001). BM-MSCs: Bone marrow-derived mesenchymal stromal cells.
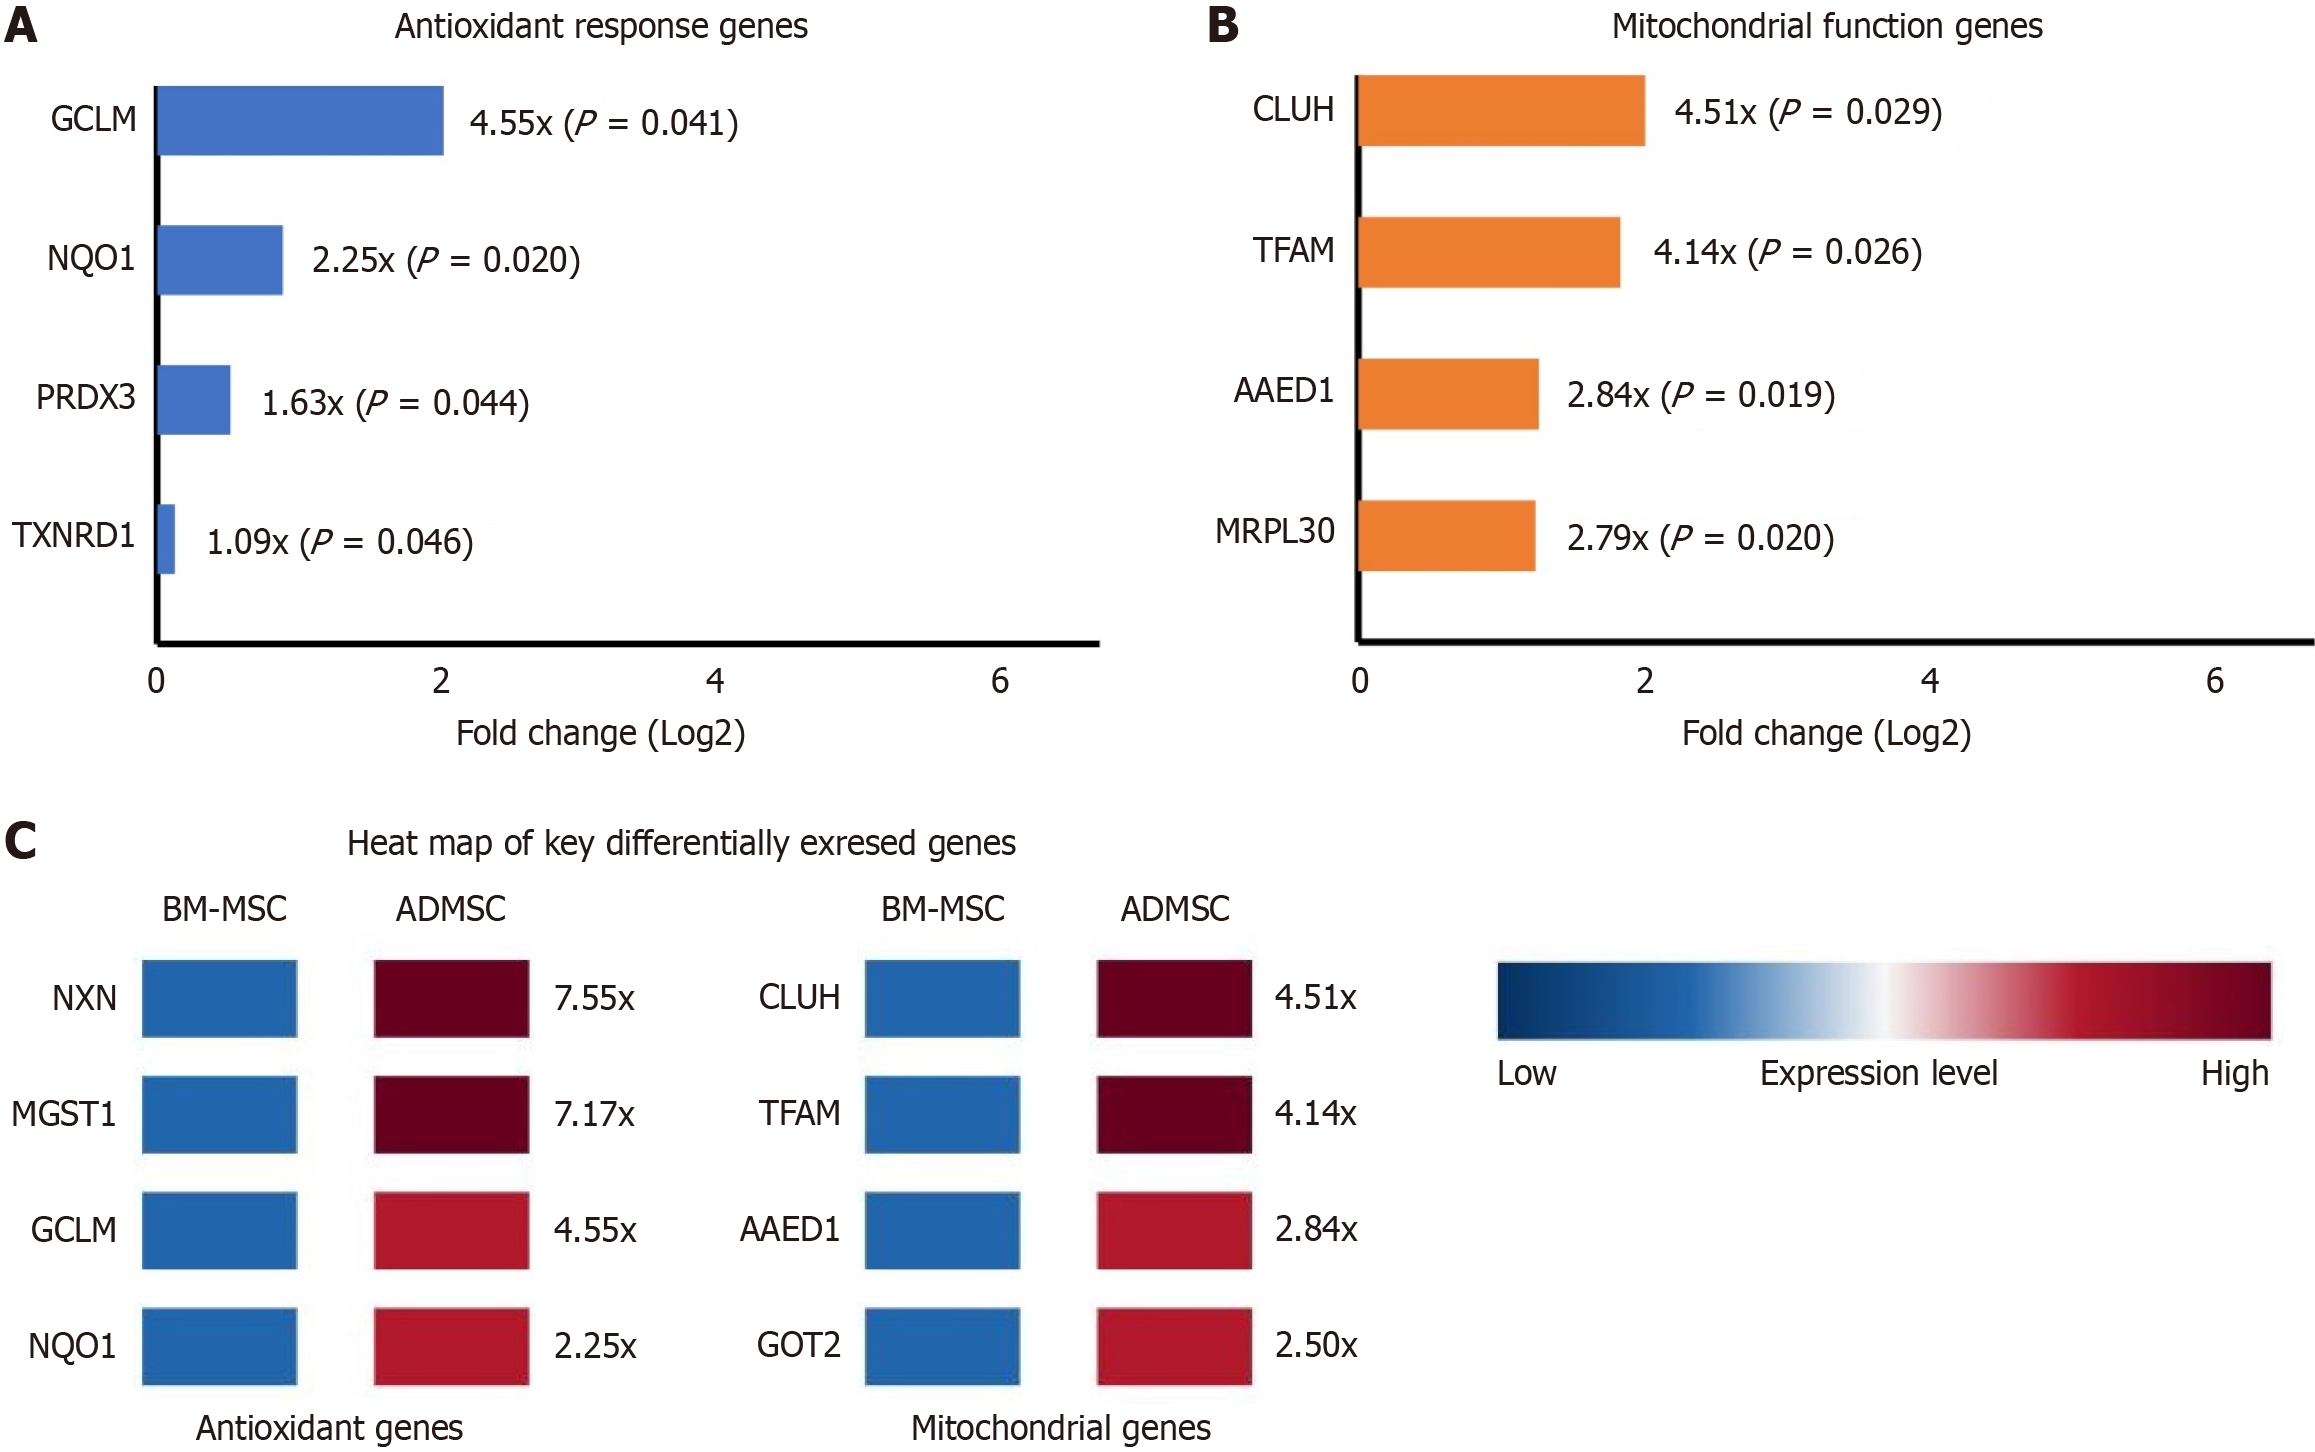
Figure 3 Differential expression of antioxidant and mitochondrial function-related genes in adipose-derived mesenchymal stromal cells compared to bone marrow-derived mesenchymal stromal cells.
A: Bar graph illustrating upregulated antioxidant response genes in adipose-derived mesenchymal stromal cells (ADMSCs), including glutamate-cysteine ligase modifier subunit (GCLM), NAD(P)H quinone dehydrogenase 1 (Nqo1), peroxiredoxin 3 (PRDX3), and thioredoxin reductase 1 (TXNRD1), shown as fold change (Log2) relative to bone marrow-derived MSCs (BM-MSCs). Statistical significance is indicated by P values; B: Bar graph showing upregulation of mitochondrial function genes clustered mitochondria homolog (CLUH), transcription factor A mitochondrial (TFAM), AhpC/TSA antioxidant enzyme domain containing 1 (AAED1), and mitochondrial ribosomal protein L30 (MRPL30) in ADMSCs vs BM-MSCs; C: Heatmap of key differentially expressed genes related to antioxidant defense and mitochondrial function, comparing gene expression levels between BM-MSCs and ADMSCs. Expression values are represented on a color scale from low (blue) to high (red), with corresponding fold change indicated.
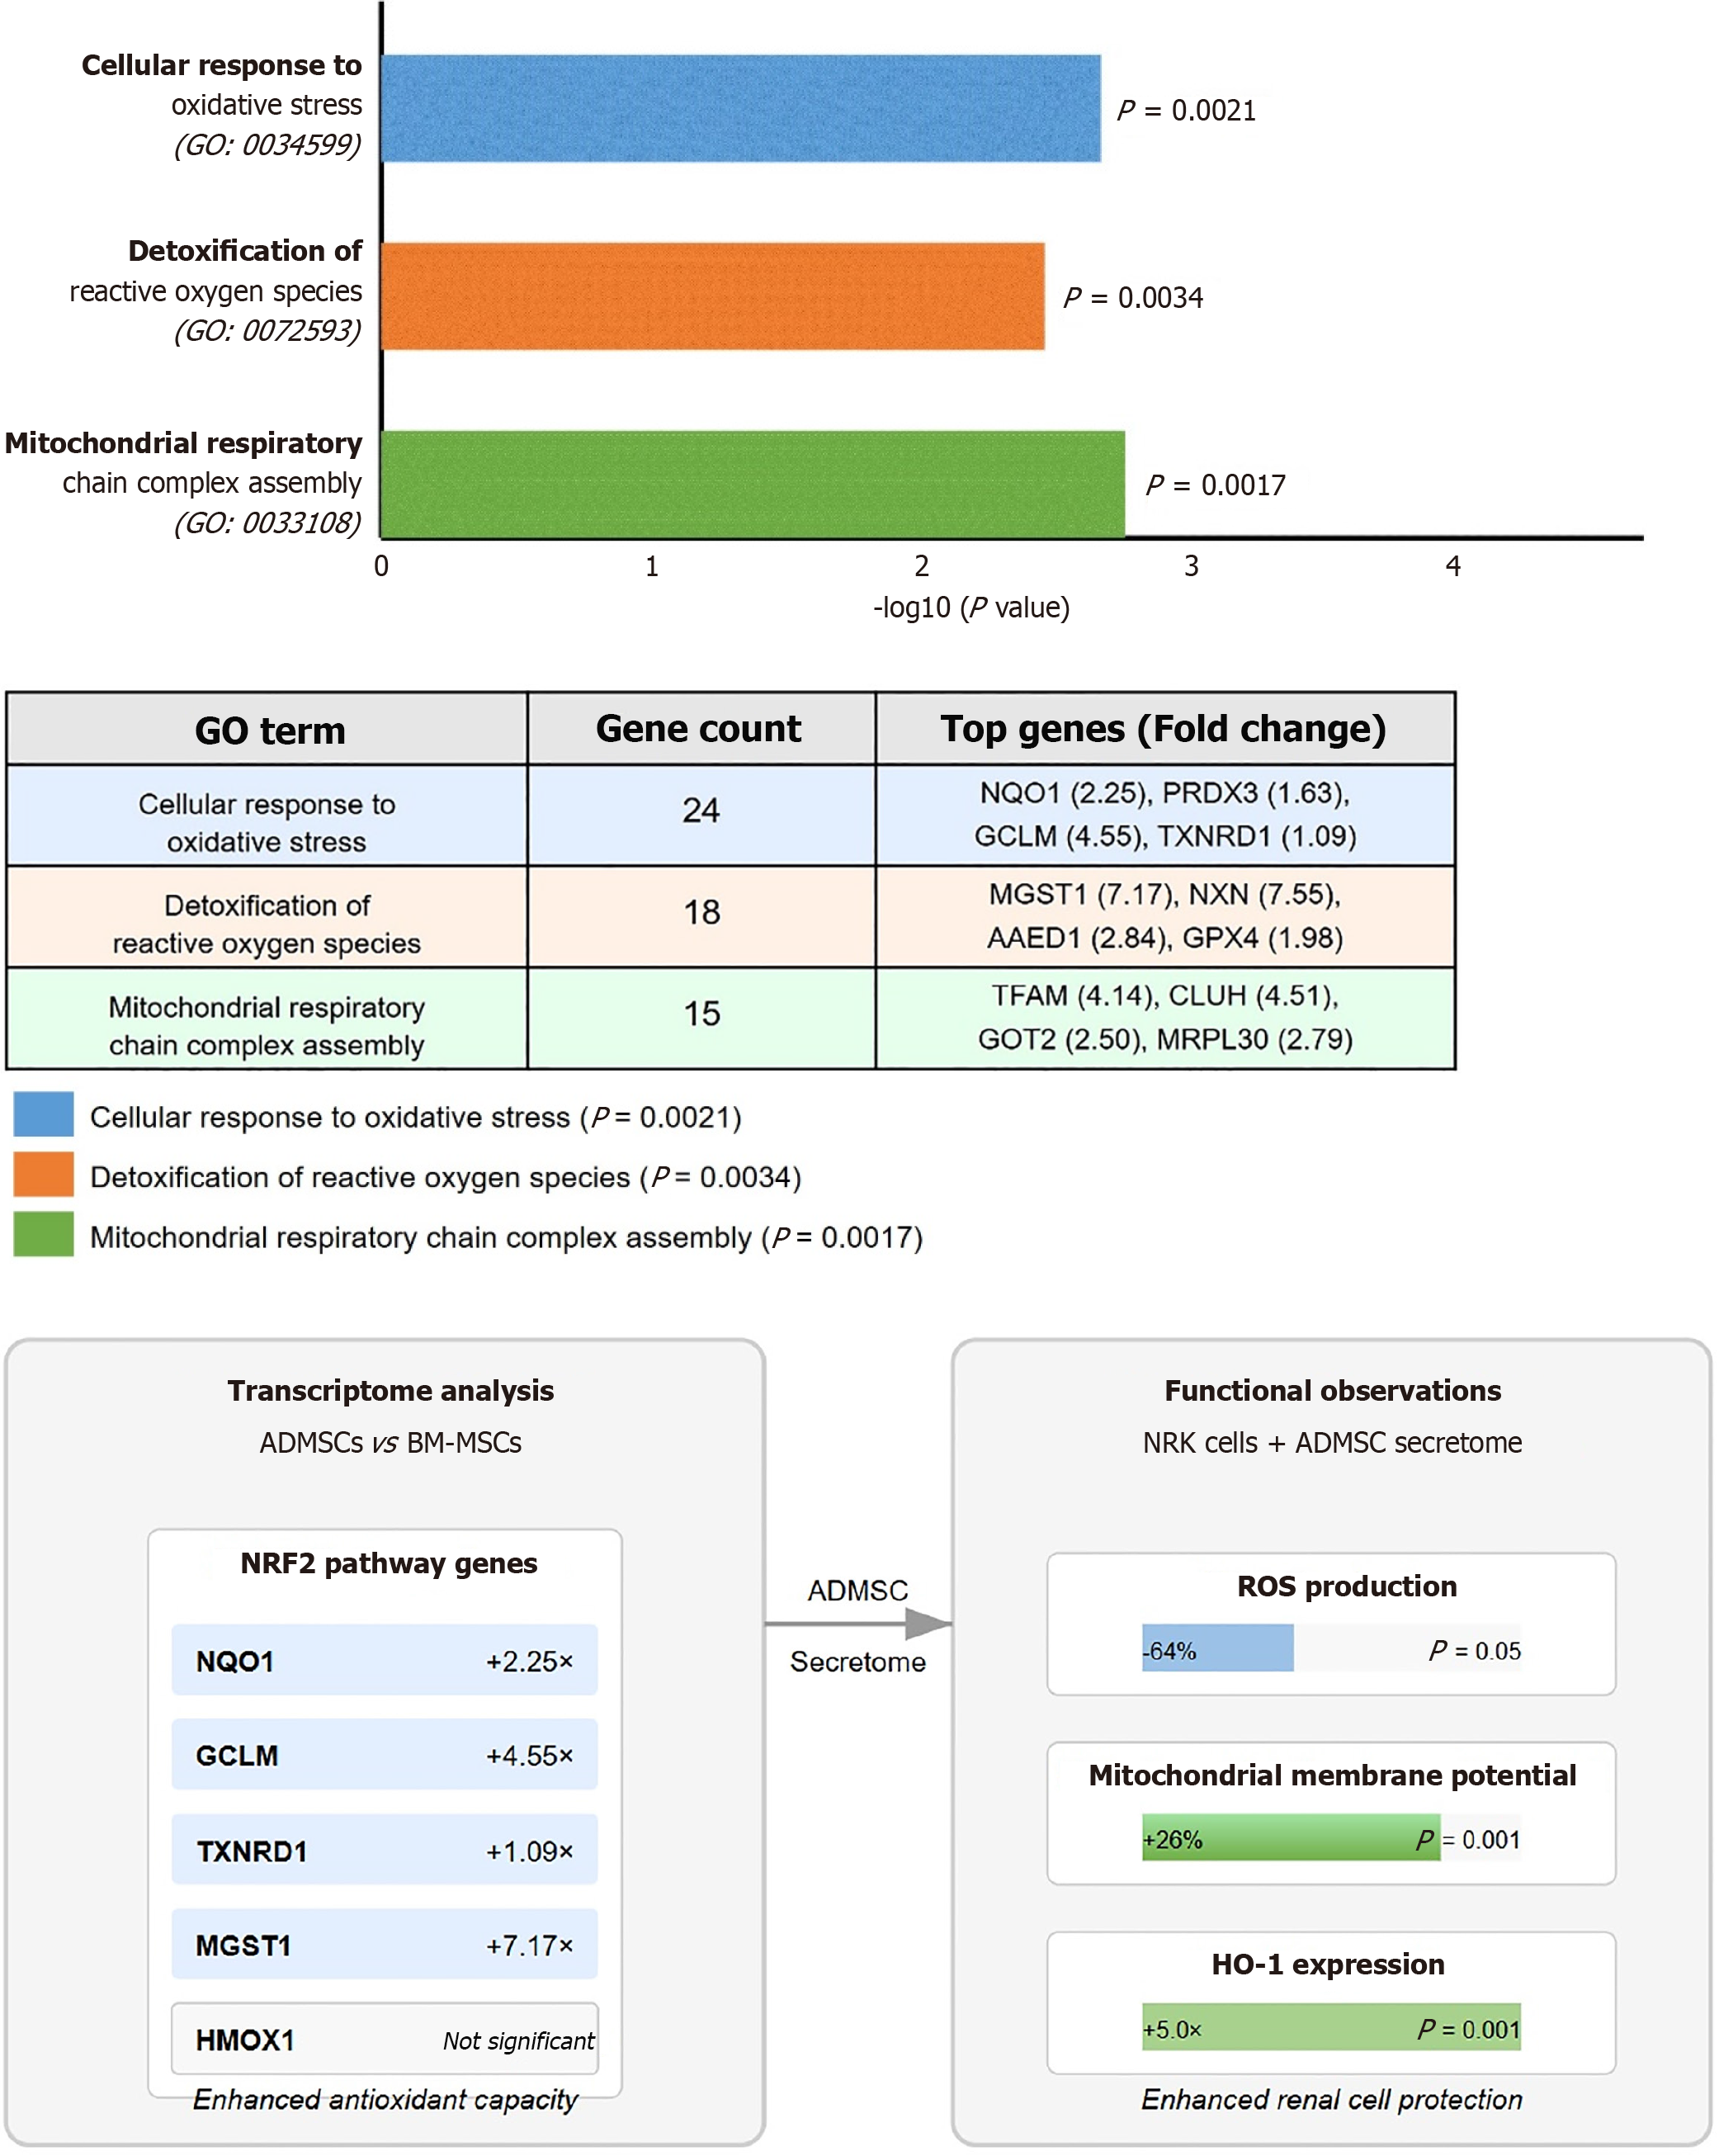
Figure 4 Gene Ontology term enrichment and contributing genes in adipose-derived mesenchymal stromal cells vs bone marrow-derived mesenchymal stromal cells.
Significantly enriched Gene Ontology (GO) biological processes in adipose-derived mesenchymal stromal cells (ADMSCs) compared to bone marrow-derived MSCs, including cellular response to oxidative stress (GO: 0034599; P = 0.0021), detoxification of reactive oxygen species (GO: 0072593; P = 0.0034), and mitochondrial respiratory chain complex assembly (GO: 0033108; P = 0.0017). The connection between transcriptome analysis and functional observations showing that enhanced nuclear factor erythroid 2-related factor 2 (Nrf2) pathway gene expression suggests an increased antioxidant capacity, which is reflected in the functional upregulation of heme oxygenase 1 (HO-1) in NRK cells treated with the ADMSC secretome.
- Citation: Jafar H, Ababneh NA, Alhattab D, Alatoom RM, Zalloum S, Salah B, Alhawari H, Awidi A. Adipose-derived mesenchymal stromal cell secretome protects against kidney injury through induction of heme oxygenase 1 upregulation in vitro. World J Nephrol 2025; 14(3): 108534
- URL: https://www.wjgnet.com/2220-6124/full/v14/i3/108534.htm
- DOI: https://dx.doi.org/10.5527/wjn.v14.i3.108534


