Copyright
©The Author(s) 2025.
World J Nephrol. Sep 25, 2025; 14(3): 107736
Published online Sep 25, 2025. doi: 10.5527/wjn.v14.i3.107736
Published online Sep 25, 2025. doi: 10.5527/wjn.v14.i3.107736
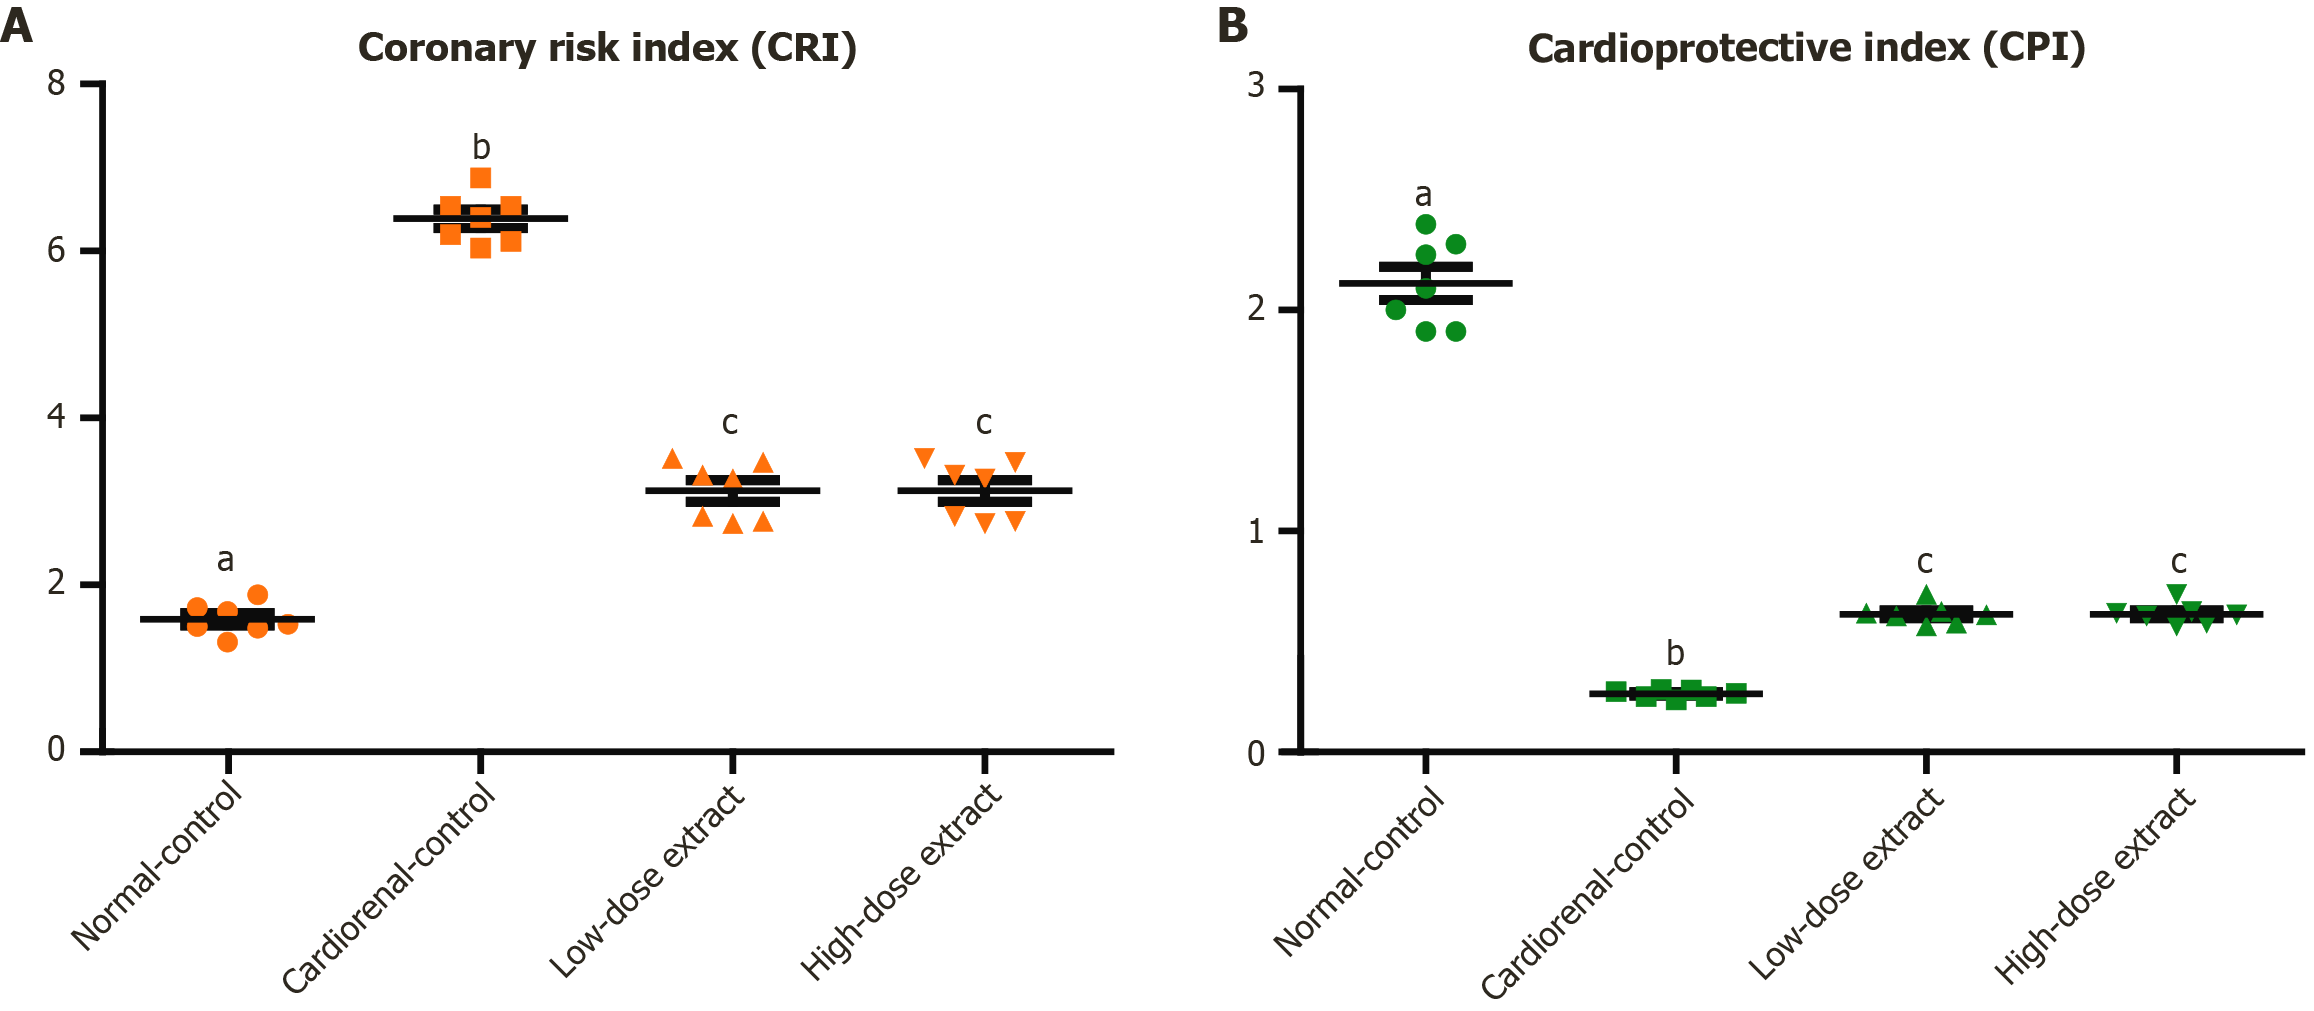
Figure 1 Coronary risk and cardioprotective index of different experimental groups.
A: Coronary risk index = T-Ch/HDL-Ch; B: Cardioprotective index = HDL-Ch/LDL-Ch, values are mean ± SE, n = 6, means with different letters show significant difference between values at probability level of 0.05.
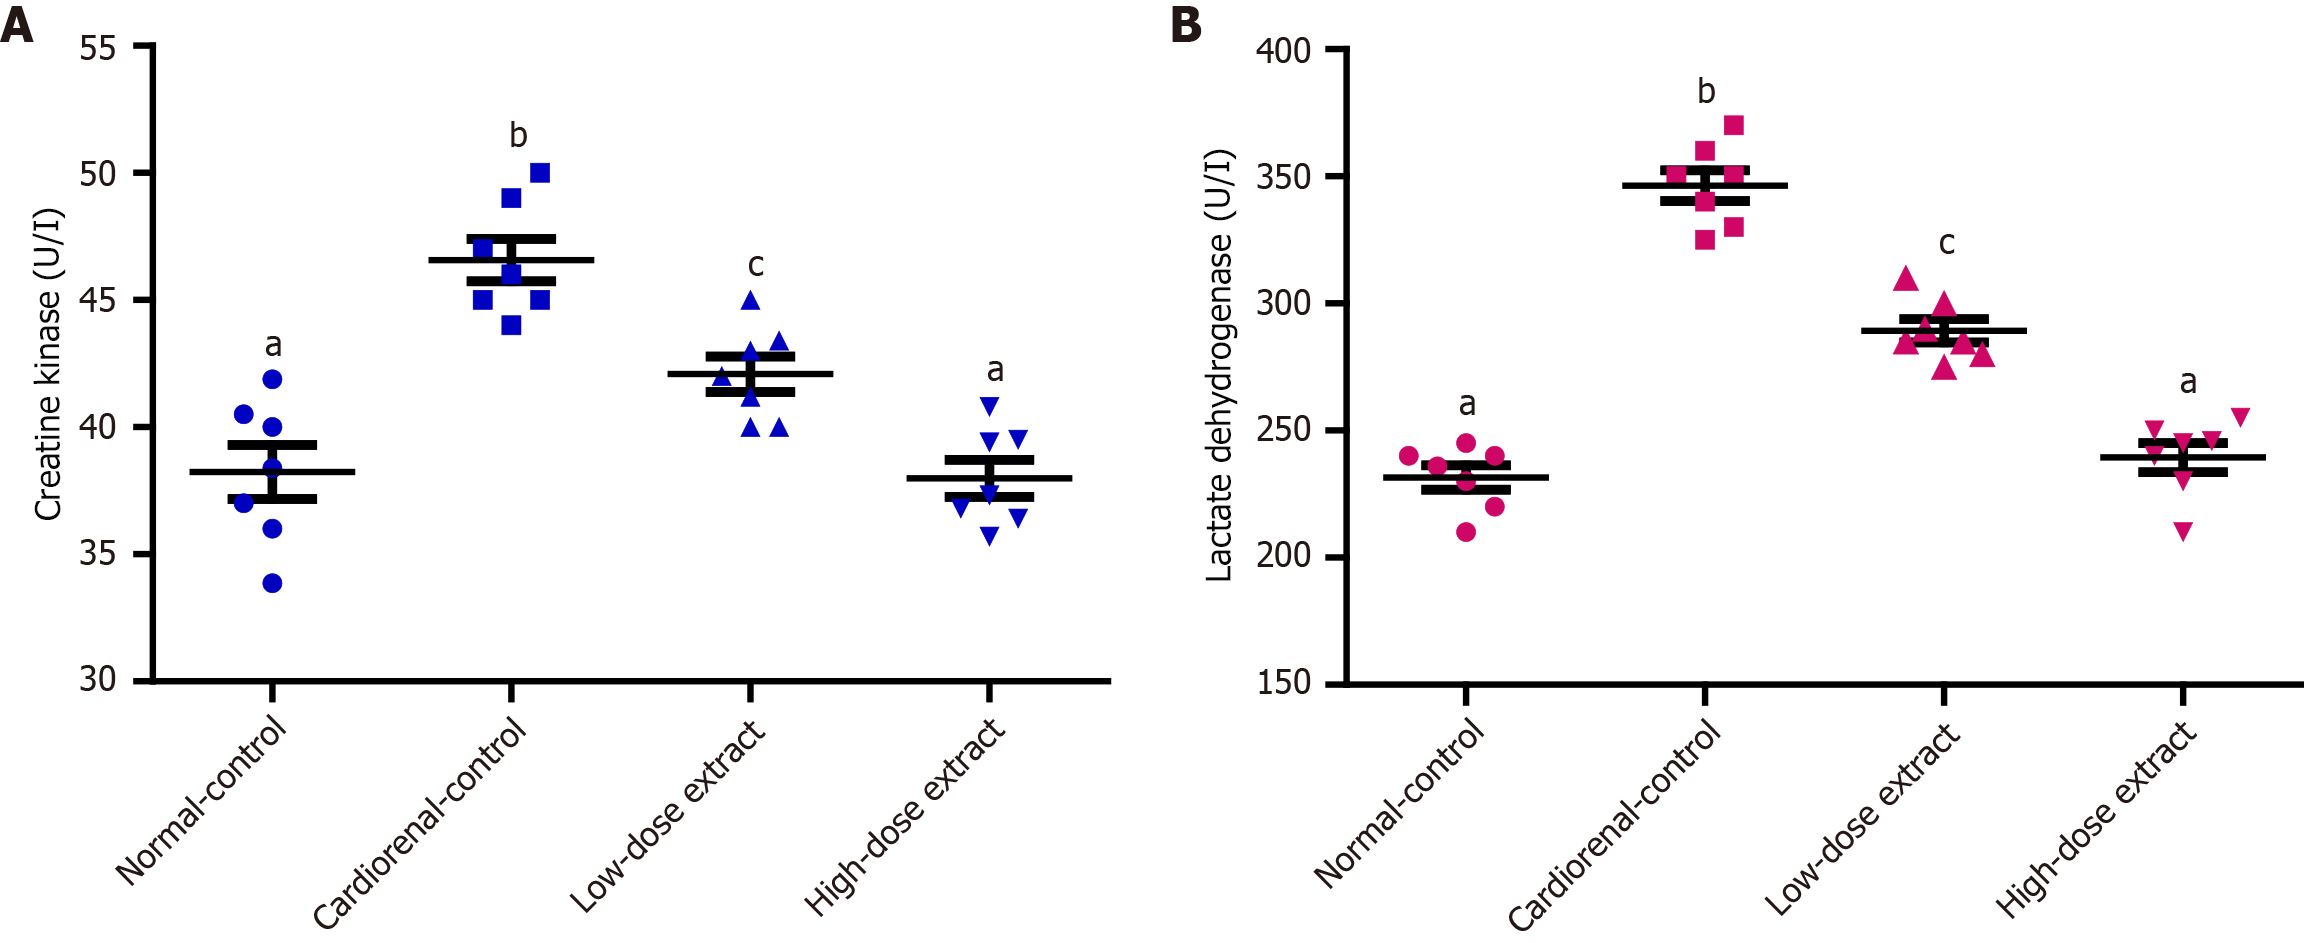
Figure 2 Creatine kinase and lactate dehydrogenase as heart function indices in all experimental groups.
A: Creatine kinase; B: Lactate dehydrogenase; Values are mean ± SE, n = 6, means with different letters show significant difference between values at probability level of 0.05.
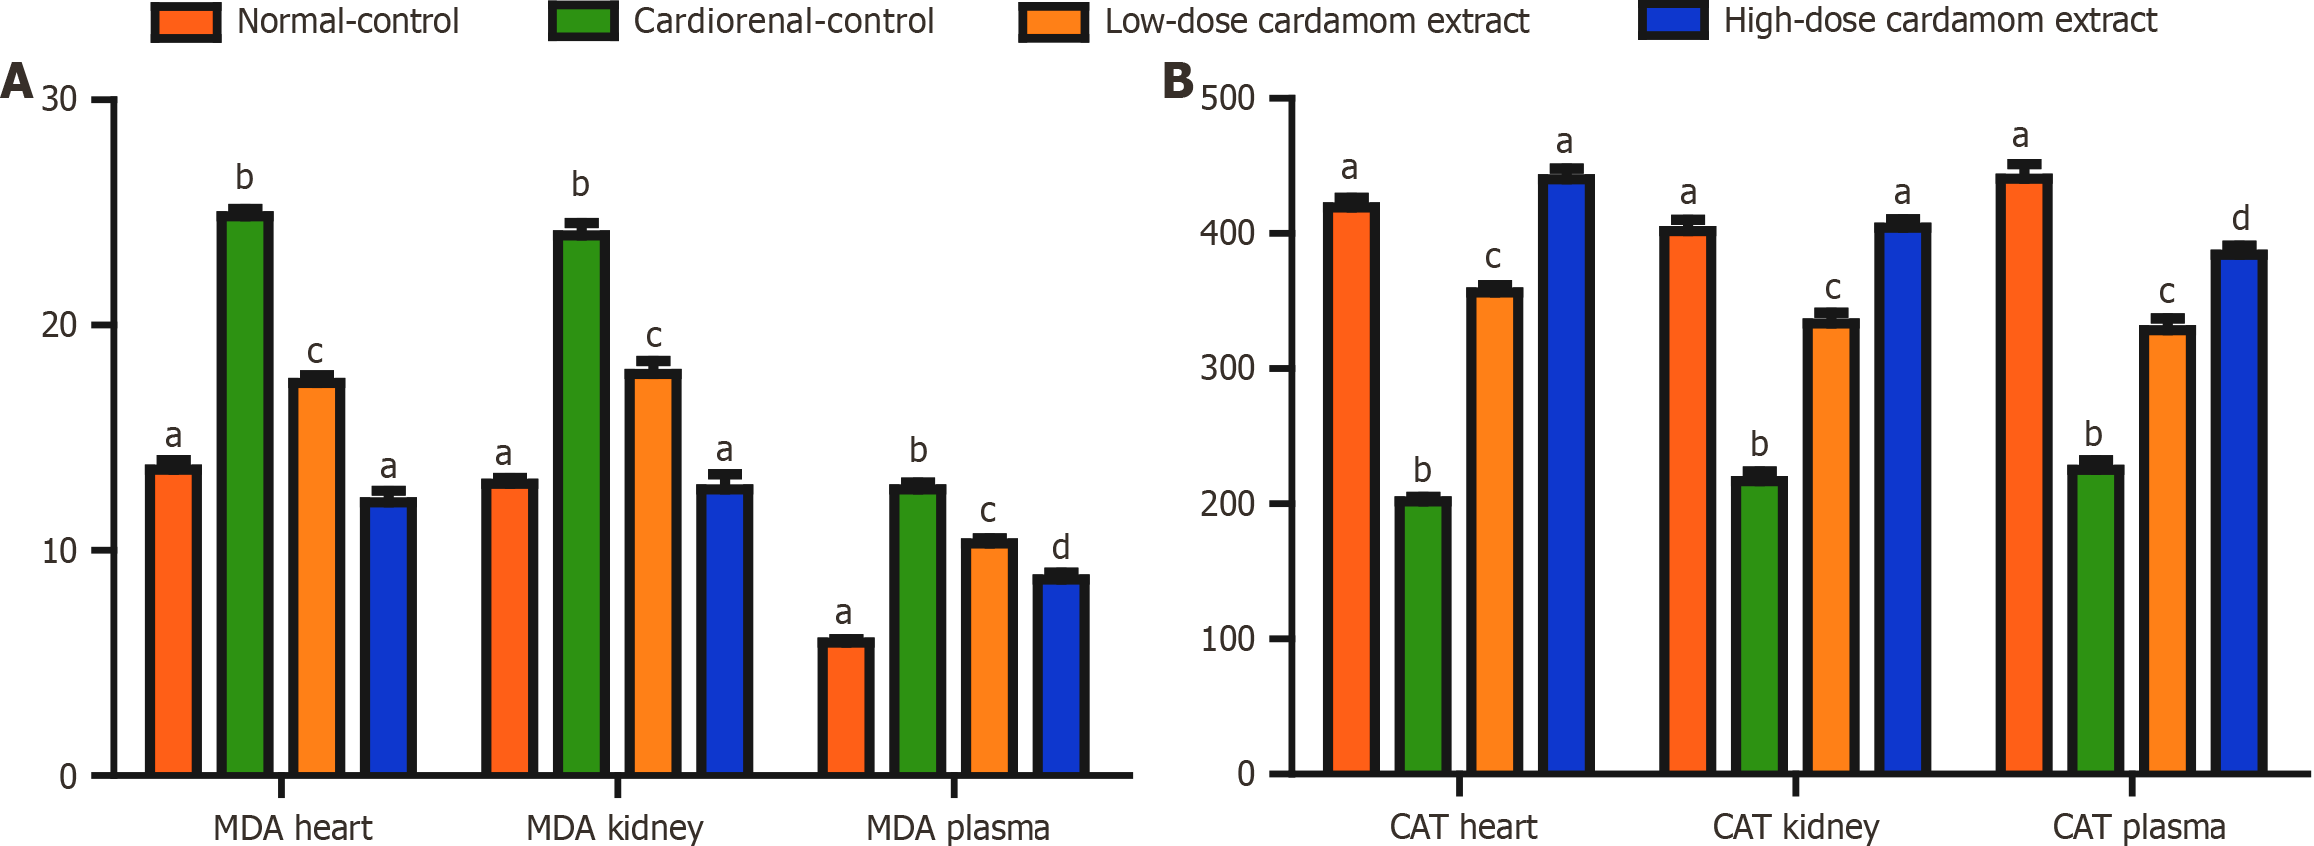
Figure 3 Effect of cardamom extract administration on malondialdehyde and catalase in plasma, heart, and kidney tissues.
Values are mean ± SE, n = 6, means with different letters show significant difference between values at probability level of 0.05. MDA: Malondialdehyde; CAT: Catalase.
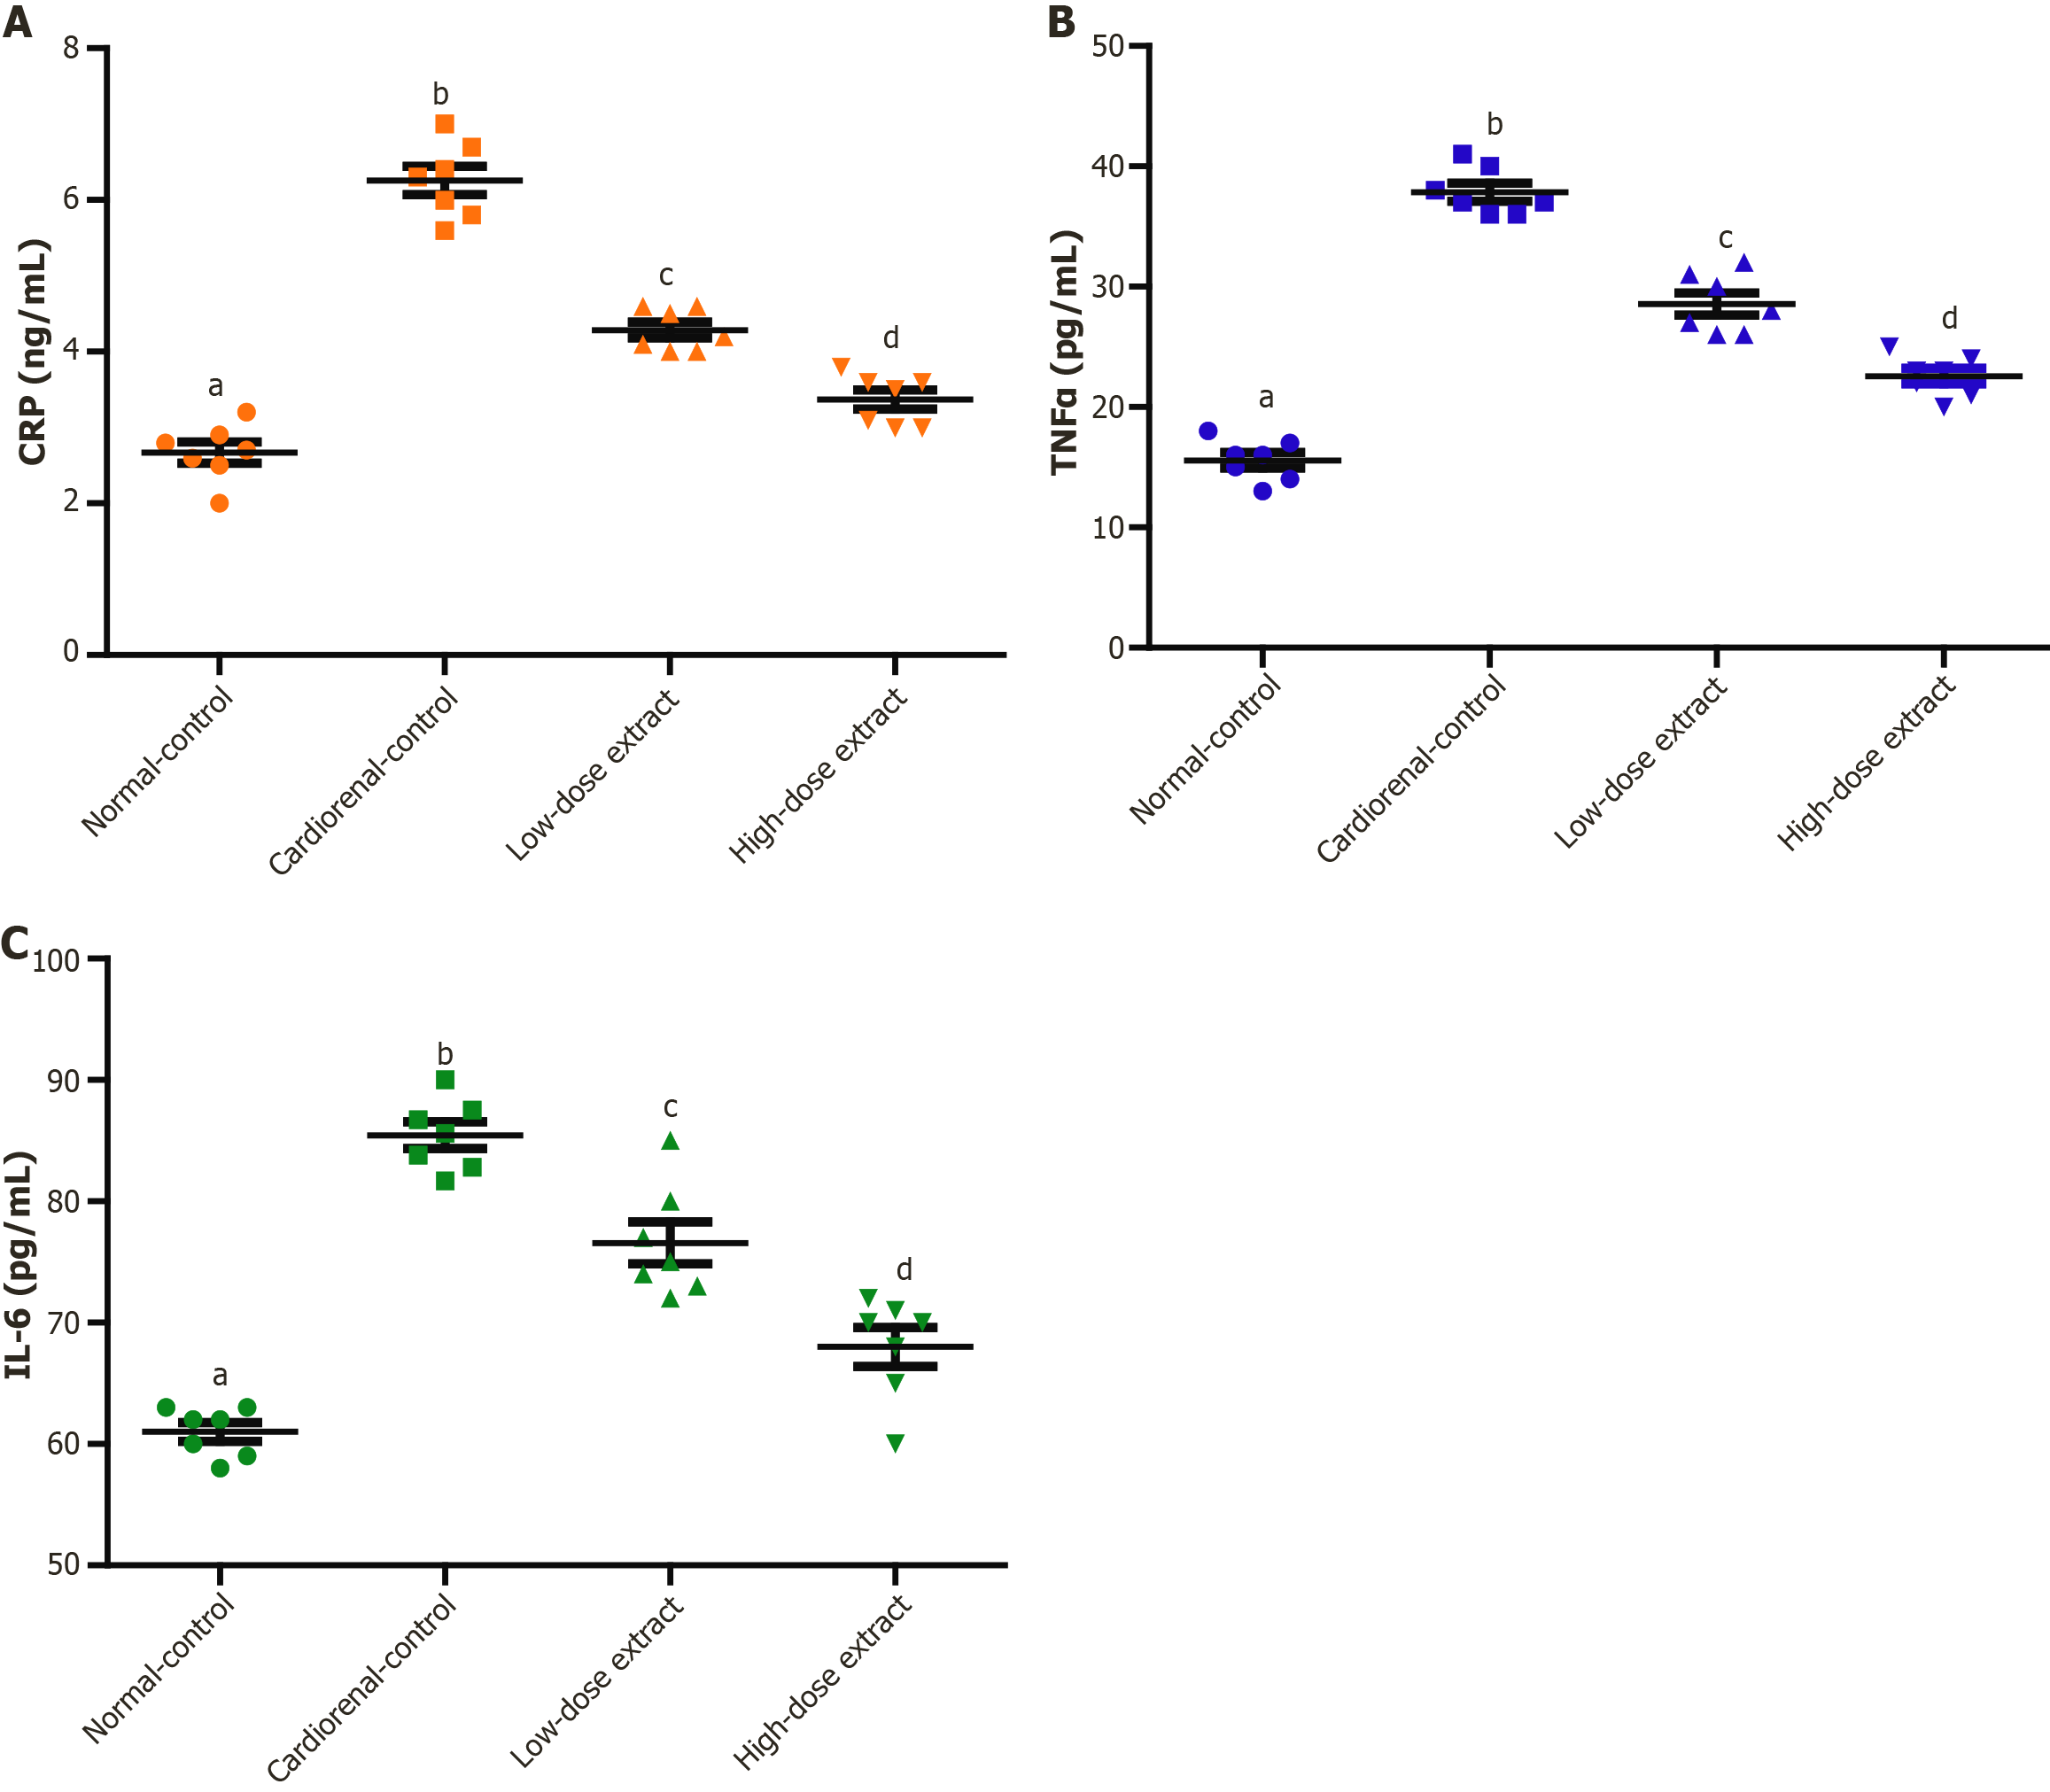
Figure 4 Effect of cardamom extract administration on plasma inflammatory markers in different groups.
A: C-reactive protein; B: Tumor necrosis factor-α; C: Interleukin-6. Values are mean ± SE, n = 6, means with different letters show significant difference between values at probability level of 0.05.
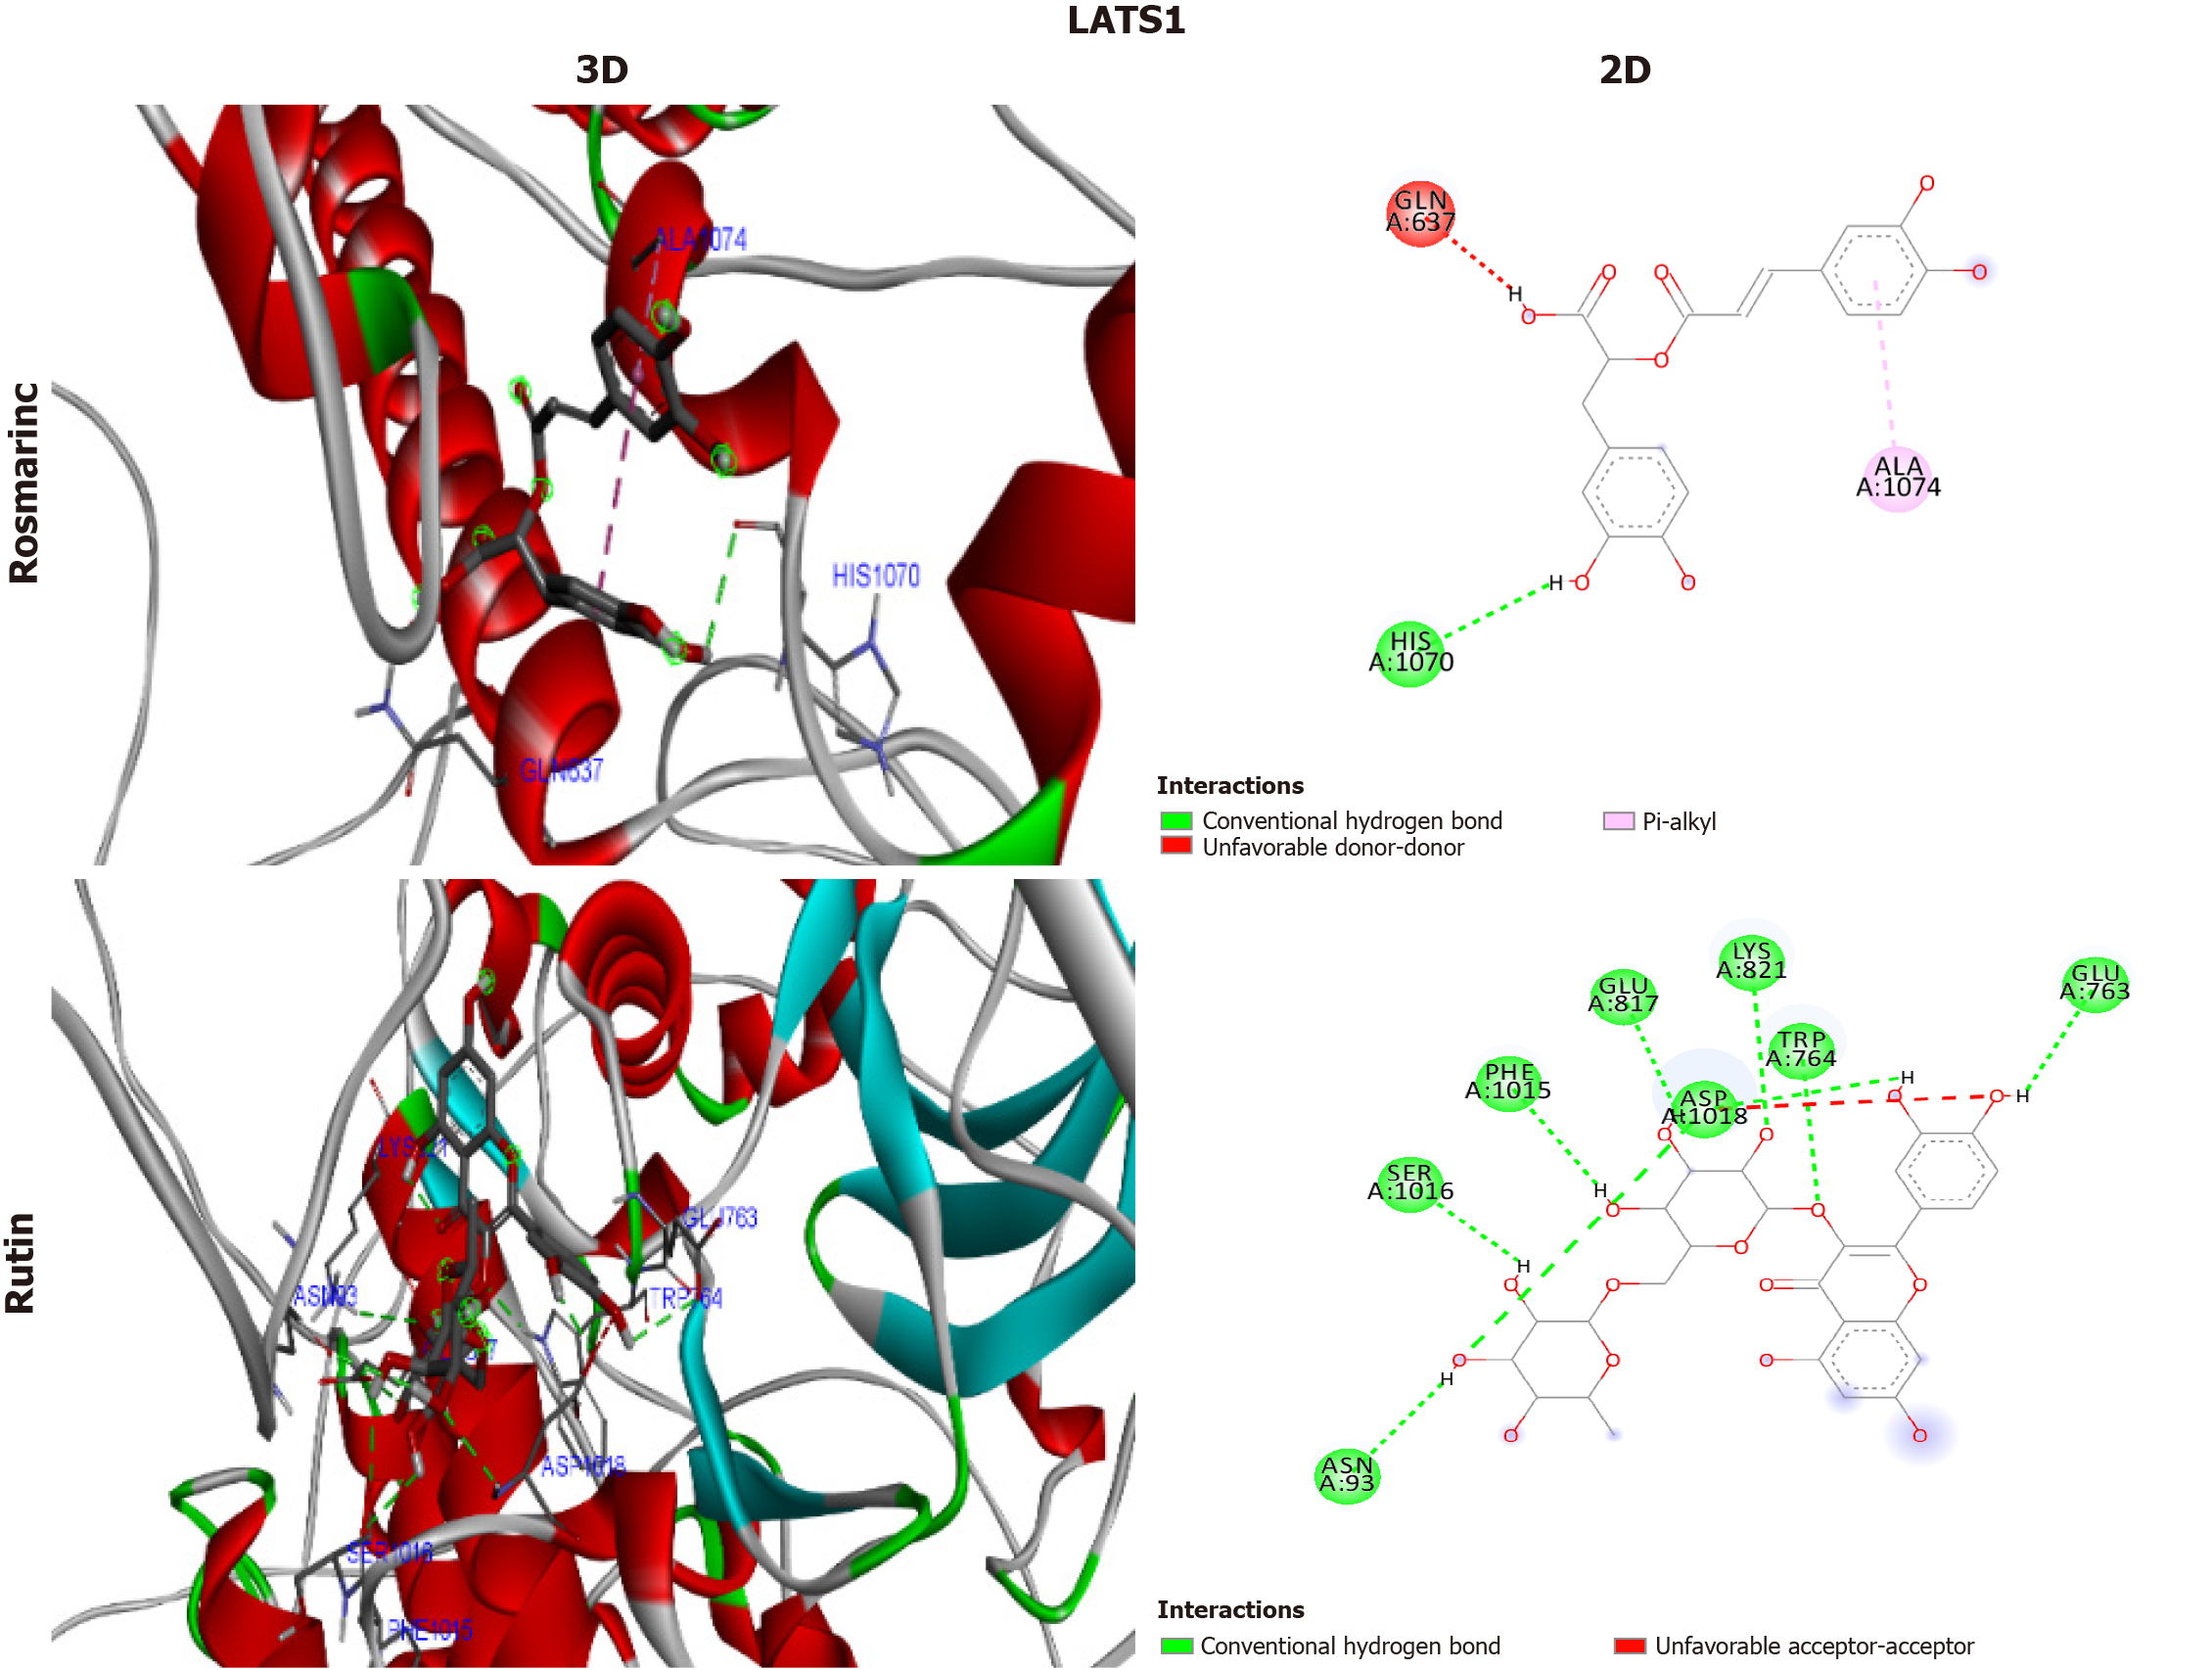
Figure 5 3D and 2D interactions between each compound with large tumor suppressor kinase 1.
LATS1: Large tumor suppressor kinase 1.
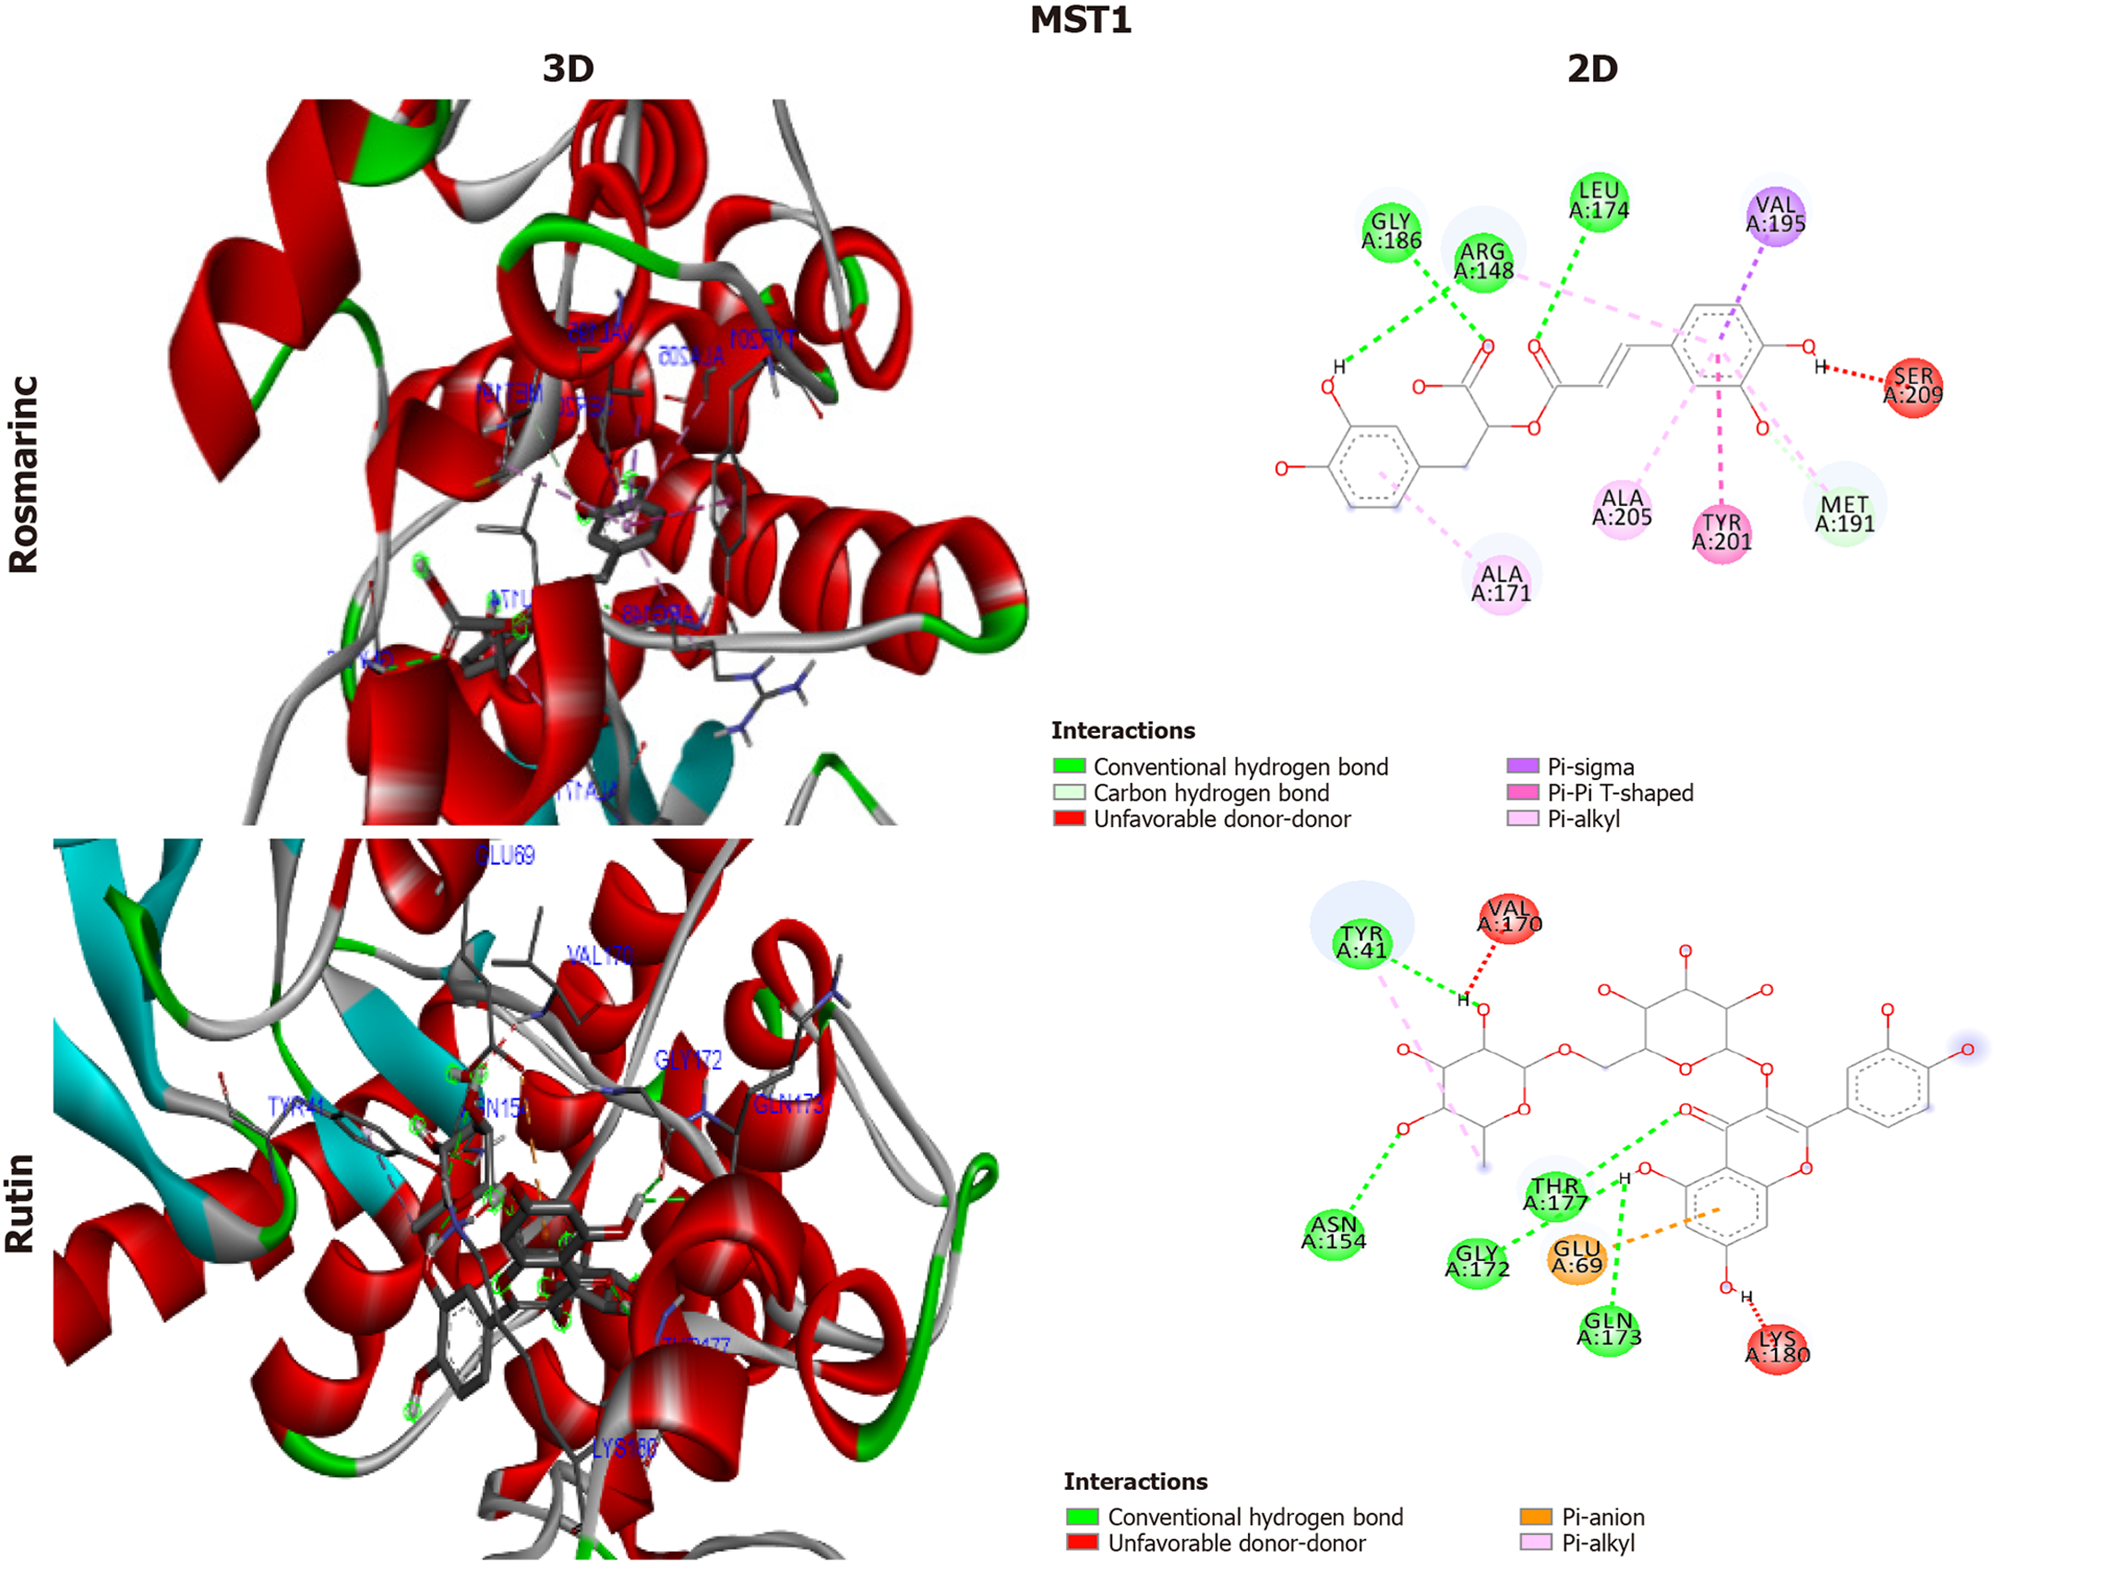
Figure 6 3D and 2D interactions between each compound with mammalian sterile 20-like kinase 1.
MST1: Mammalian sterile 20-like kinase 1.
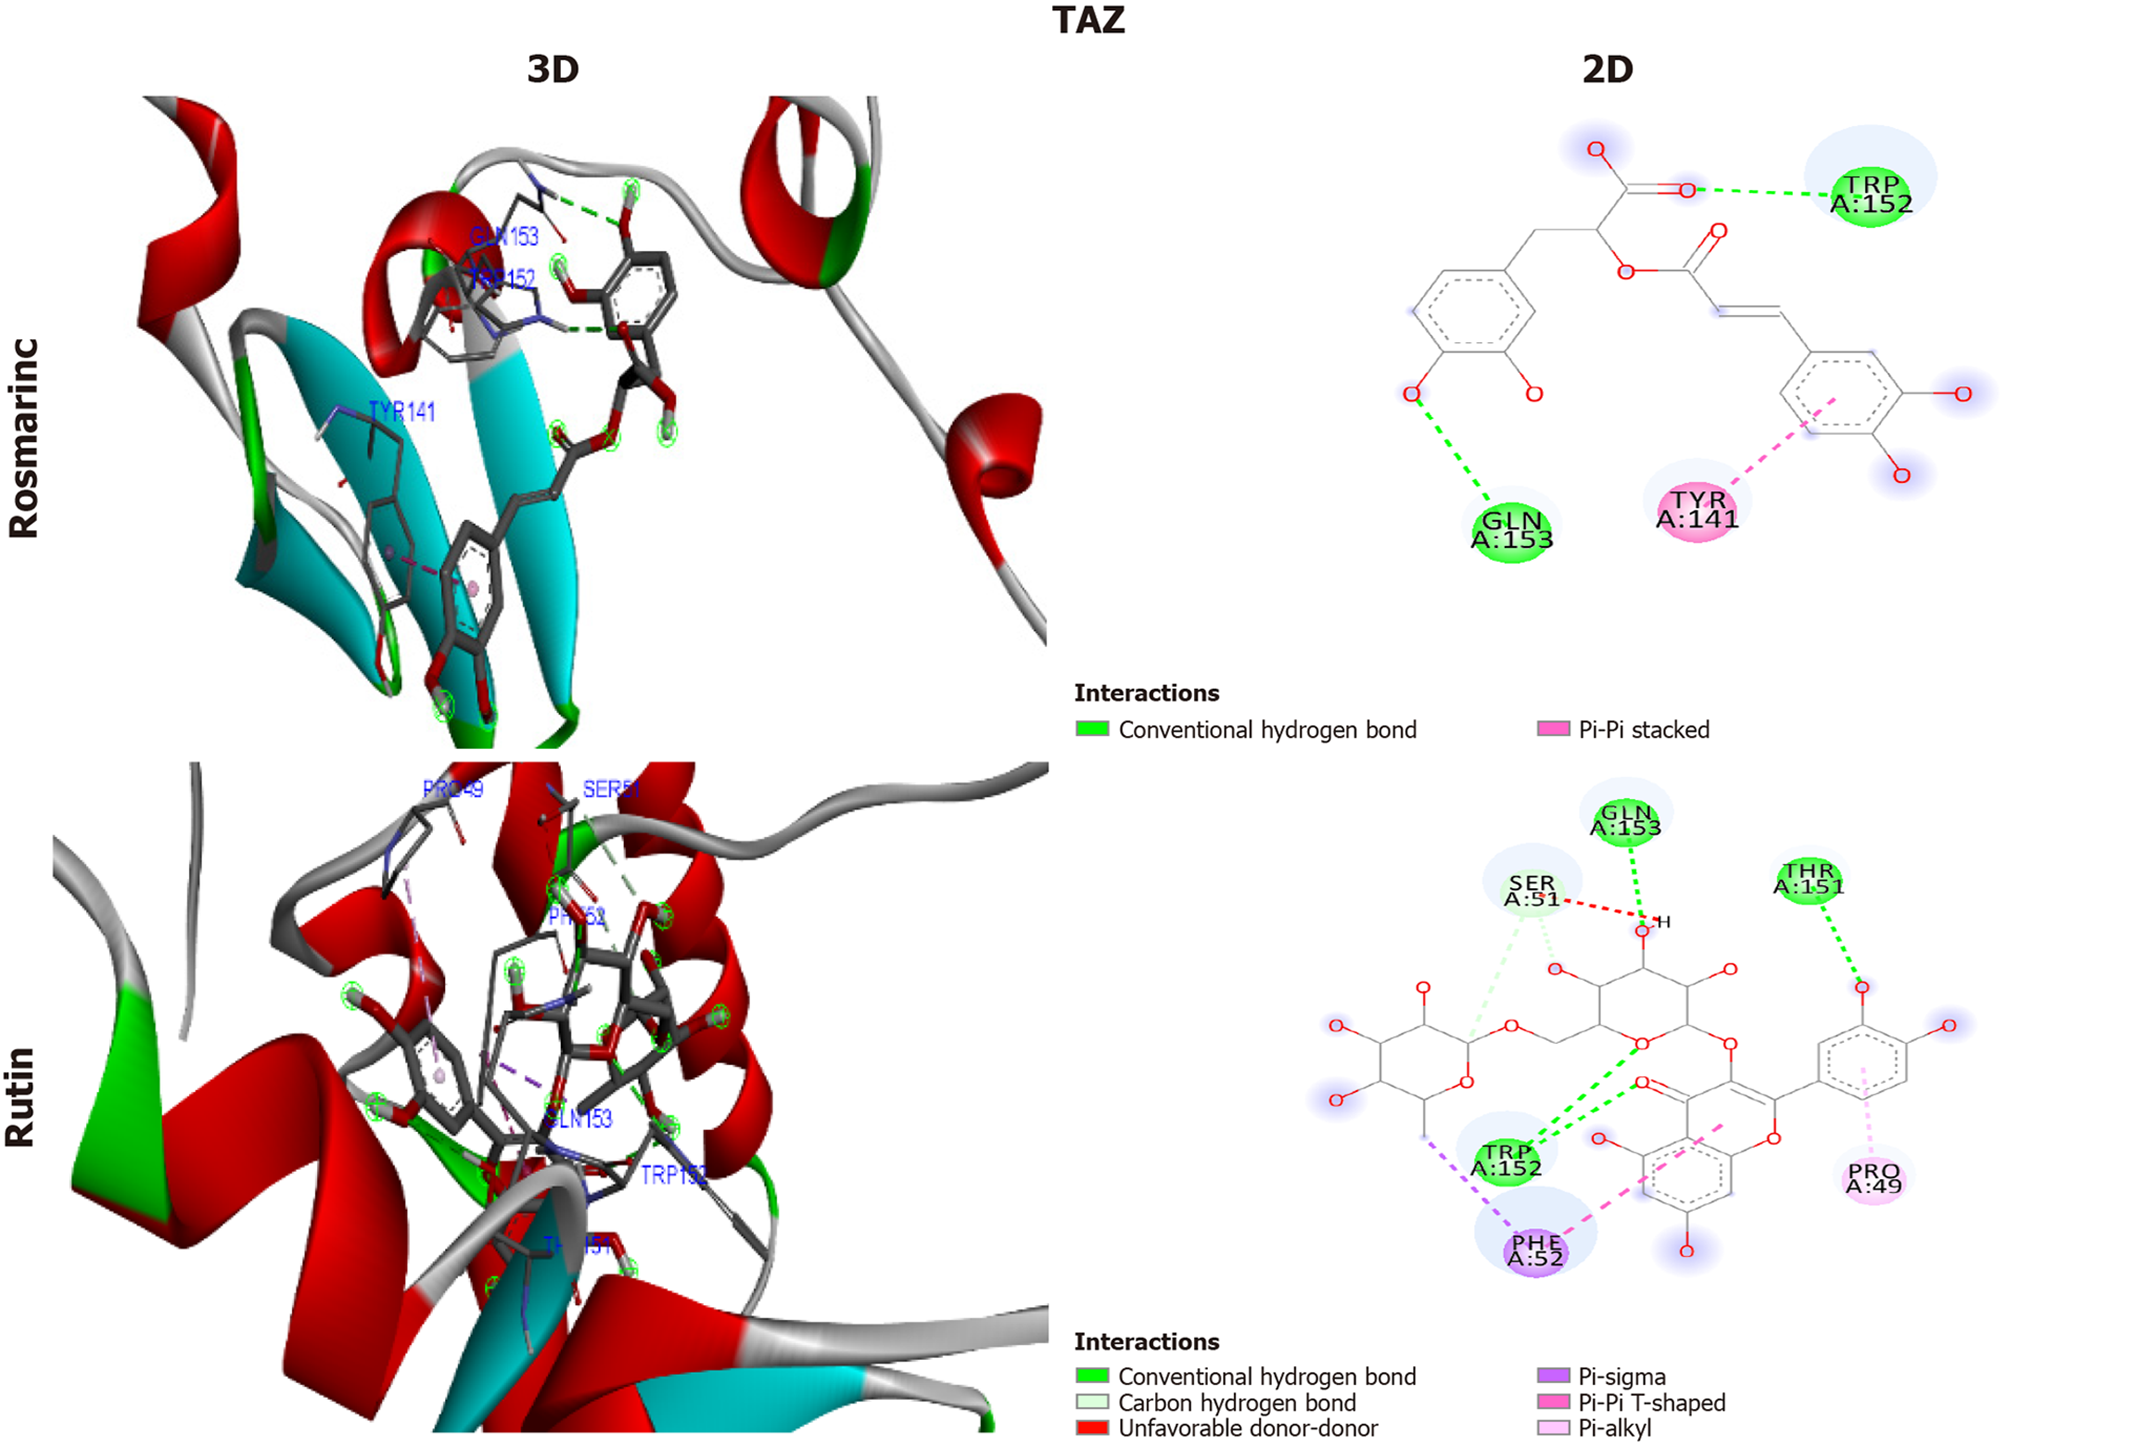
Figure 7 3D and 2D interactions between each compound with PDZ-binding motif.
TAZ: Transcriptional coactivator with PDZ-binding motif.
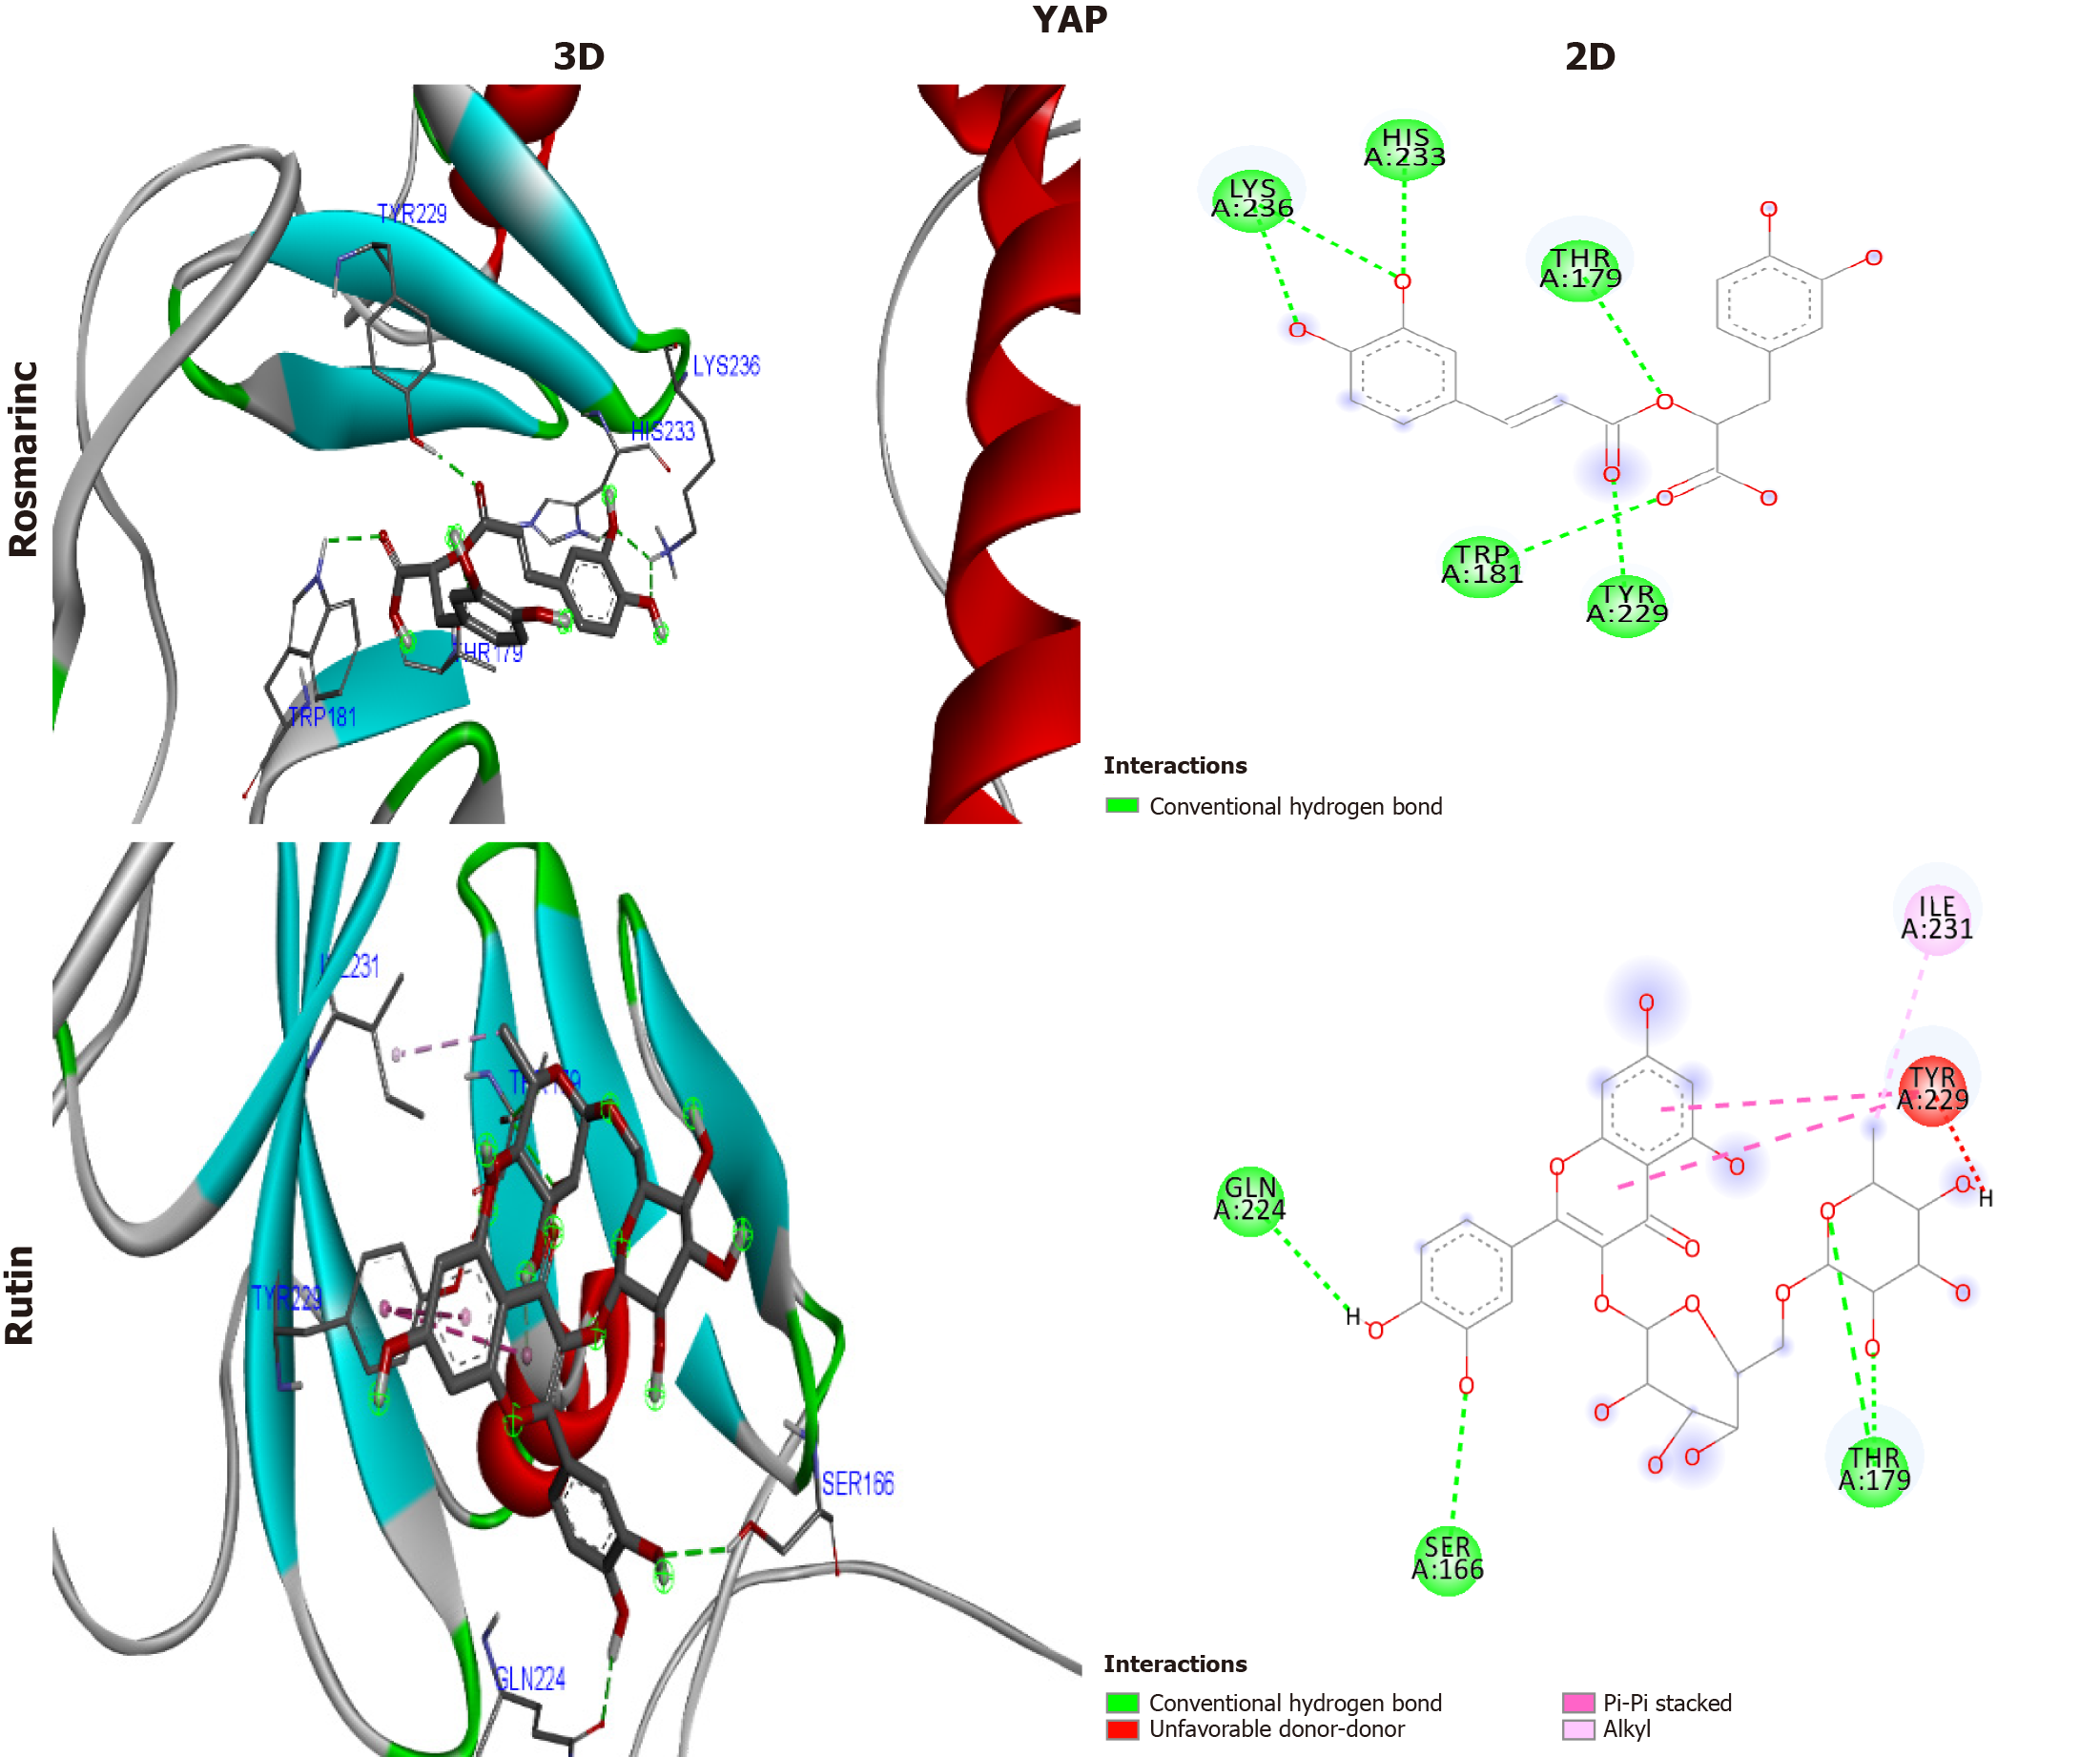
Figure 8 3D and 2D interactions between each compound with Yes-associated protein.
YAP: Yes-associated protein.
- Citation: Mohamed D, Hamed I, Mabrok HB. Cardamom extract: An effective weapon in prevention of cardiorenal syndrome induced in rats by cisplatin and high-fat diet. World J Nephrol 2025; 14(3): 107736
- URL: https://www.wjgnet.com/2220-6124/full/v14/i3/107736.htm
- DOI: https://dx.doi.org/10.5527/wjn.v14.i3.107736


