©The Author(s) 2025.
World J Virol. Jun 25, 2025; 14(2): 101976
Published online Jun 25, 2025. doi: 10.5501/wjv.v14.i2.101976
Published online Jun 25, 2025. doi: 10.5501/wjv.v14.i2.101976
Figure 1 The genomes of hepatitis C virus[2].
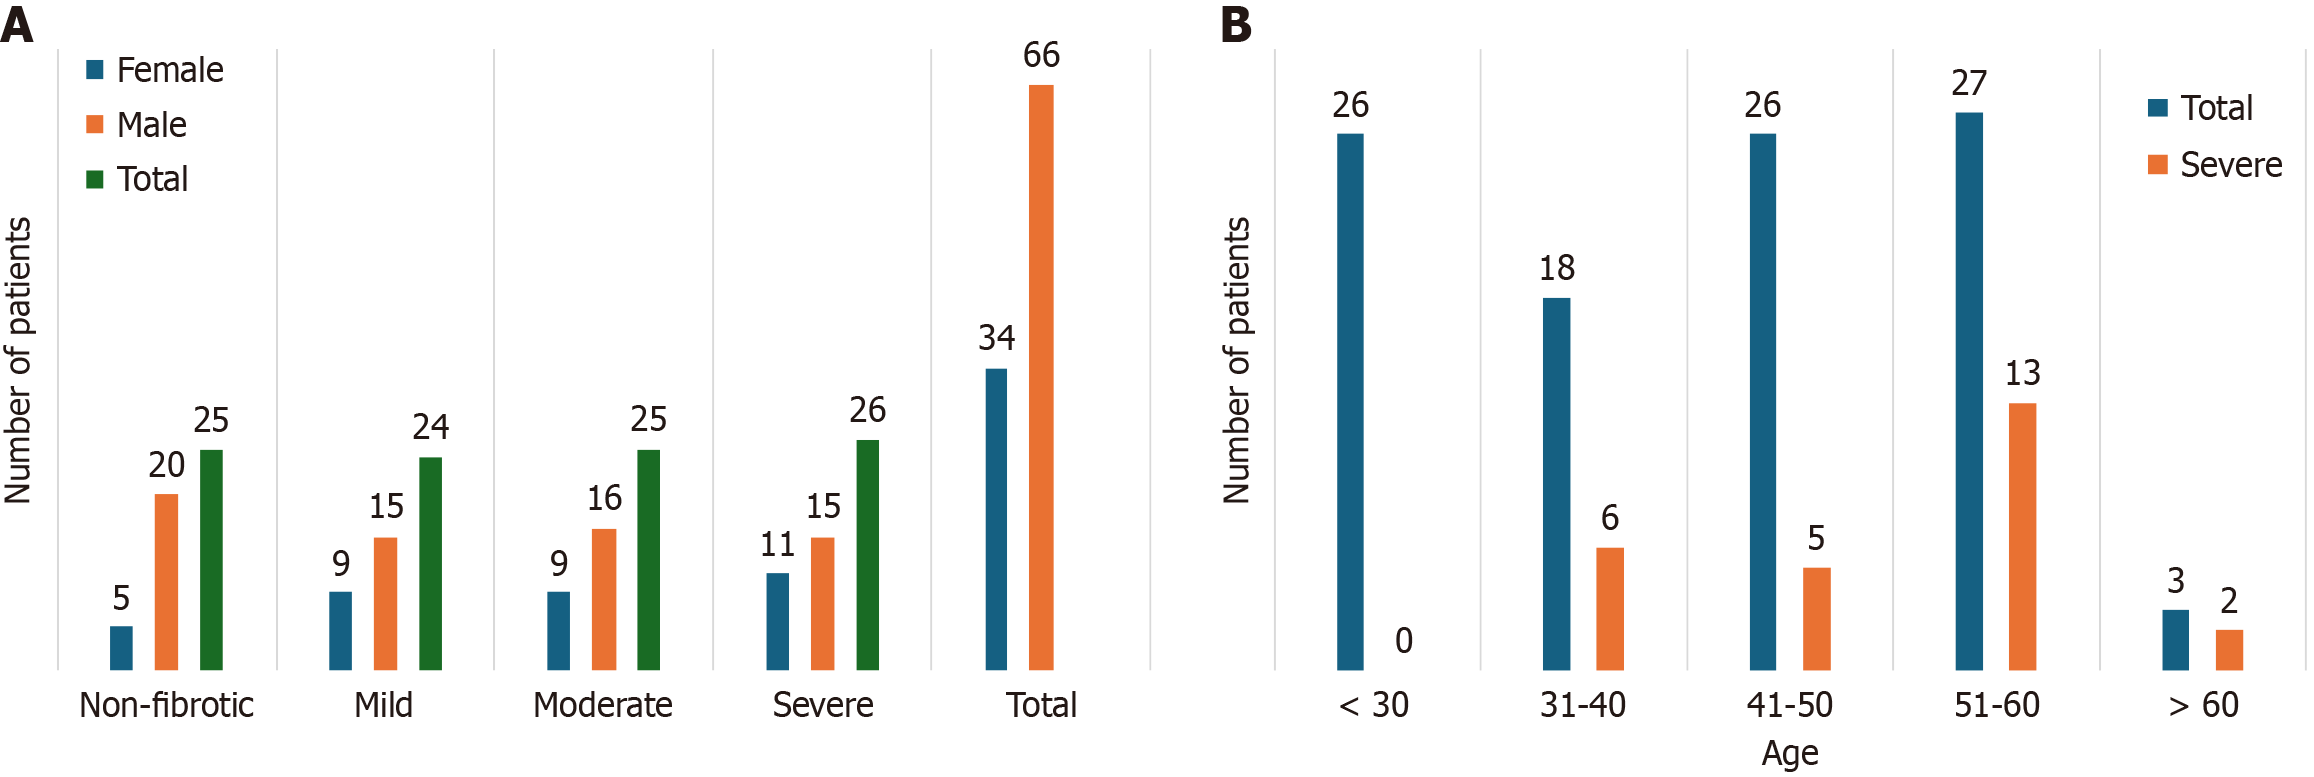
Figure 2 Distribution of hepatitis C virus patients vs Fibrotic stages.
A: Gender-specific distribution of hepatitis C virus patients; B: Age distribution of hepatitis C virus infected patients.
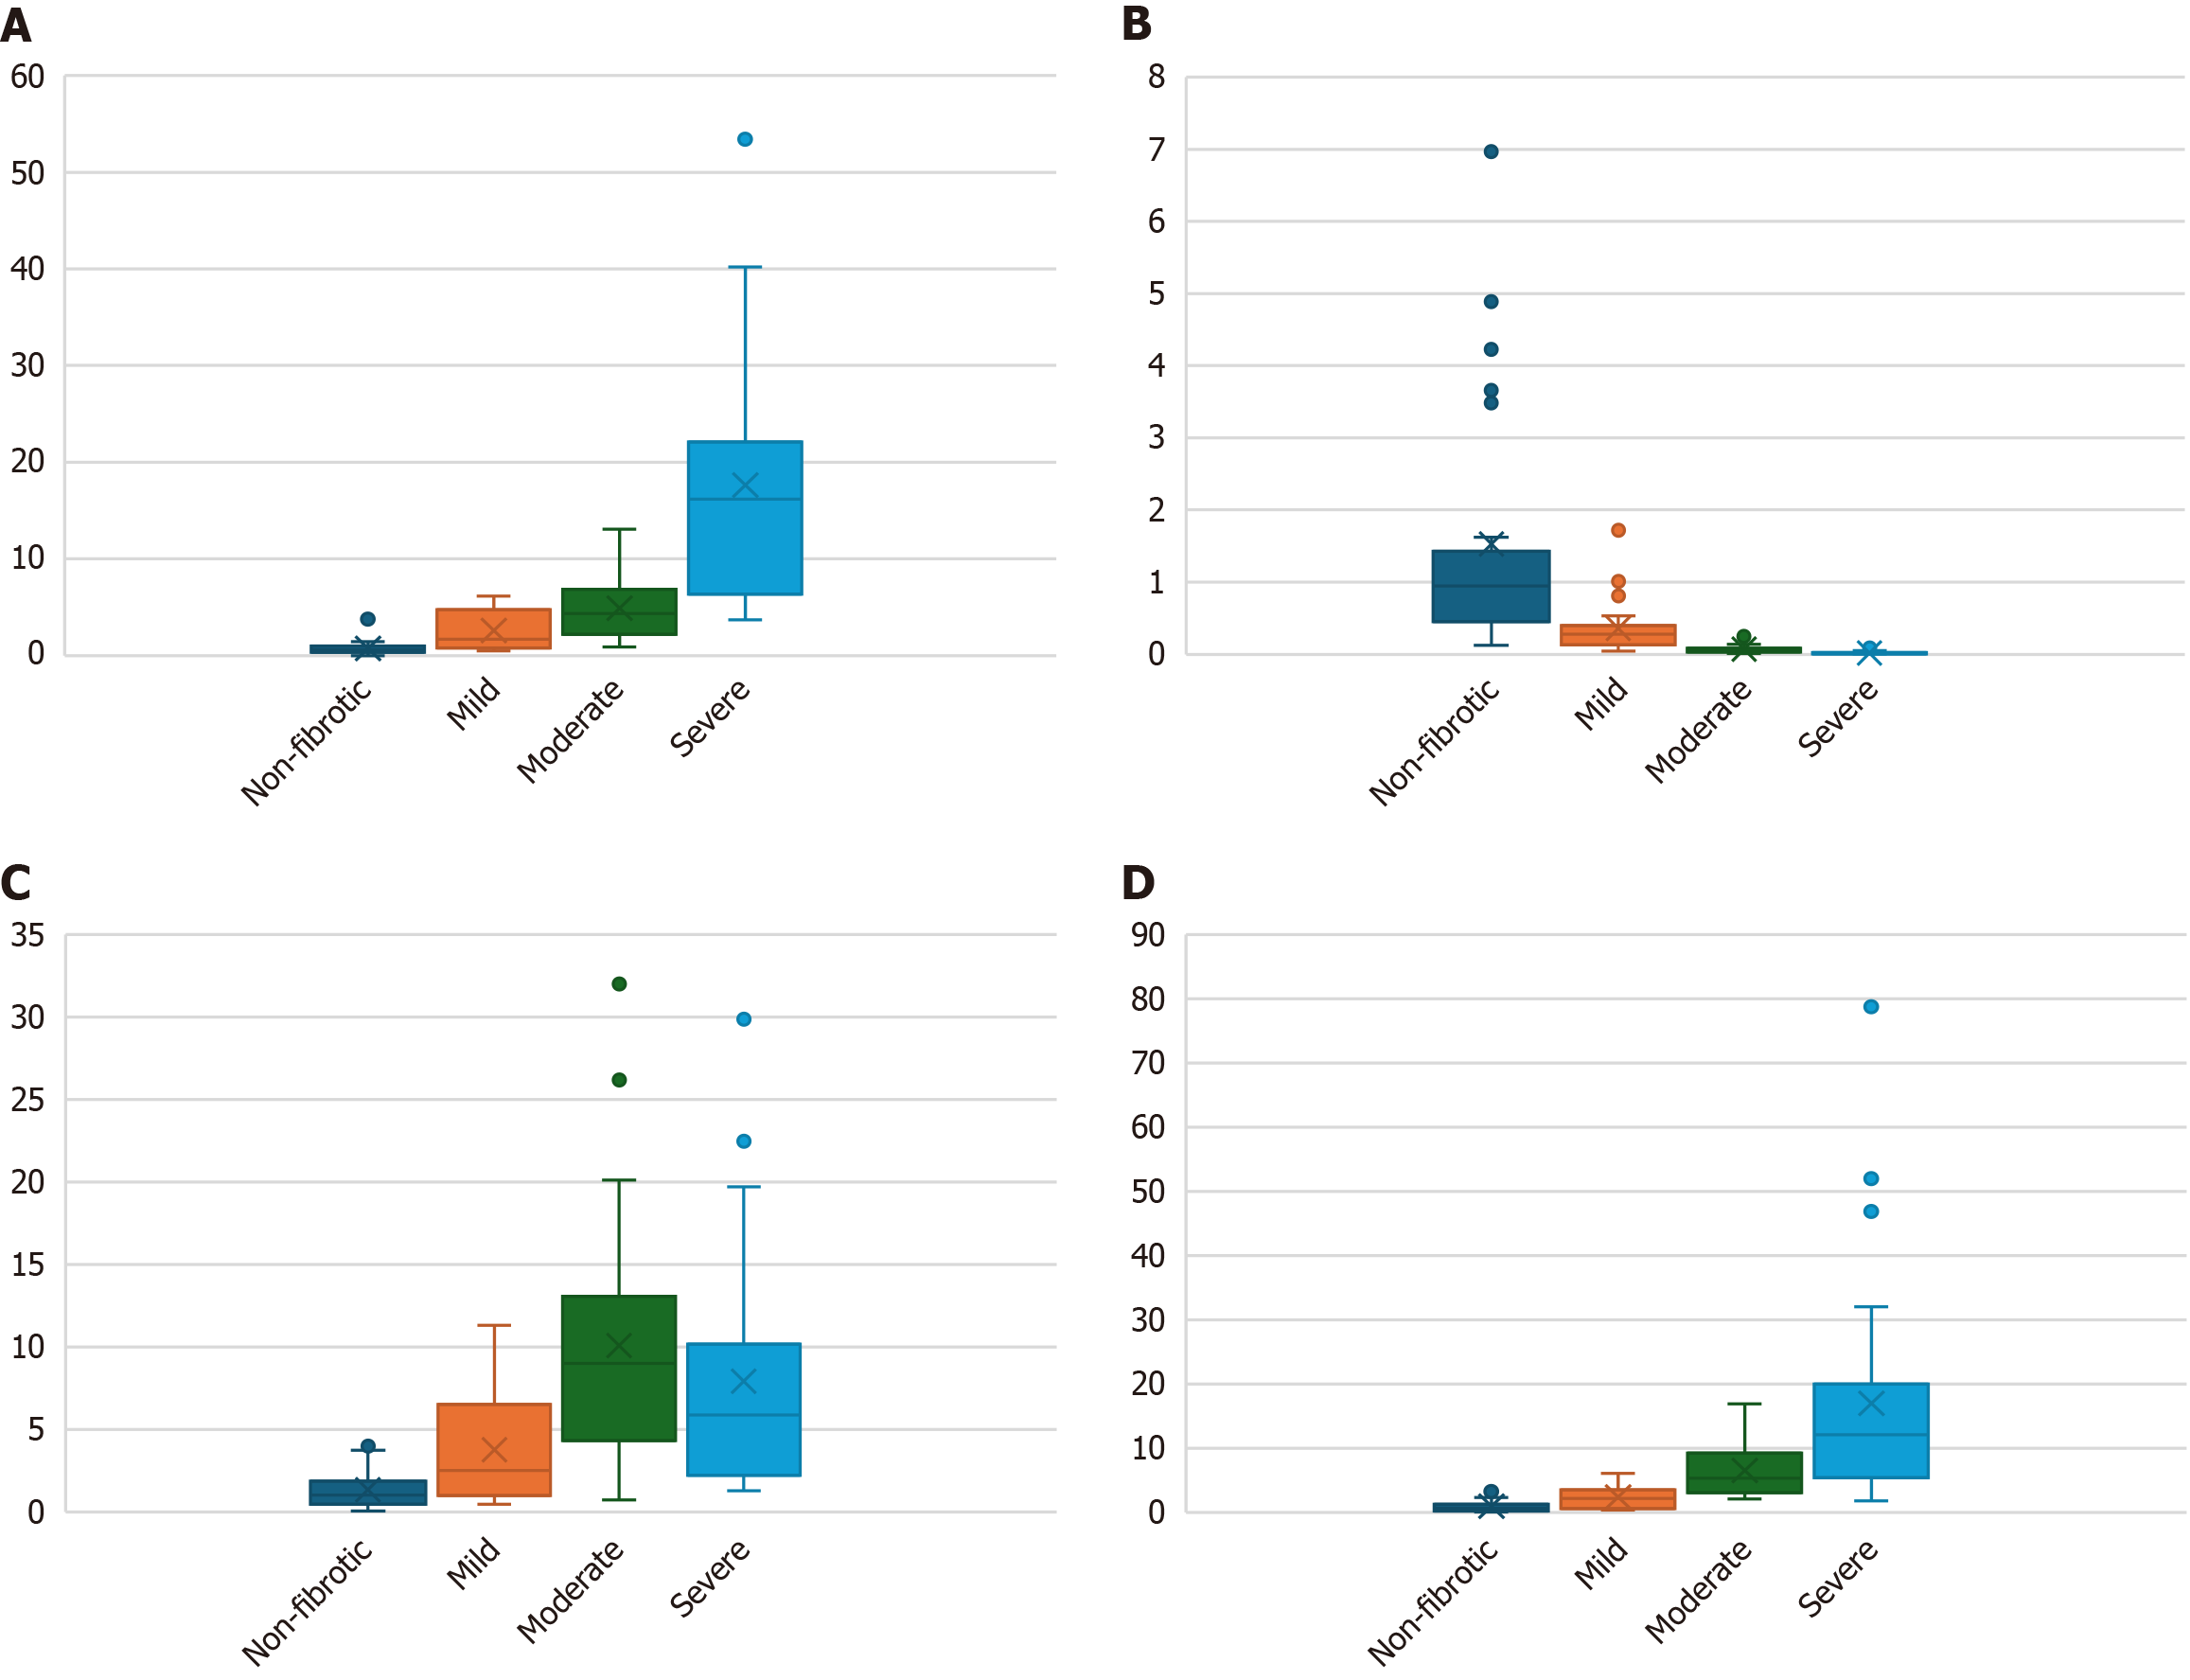
Figure 3 miRNA Expression regulation of hepatitis C virus patient’s vs fibrotic stages.
A: MiR-122; B: MiR-199-a; C: MiR-155; D: MiR-21.
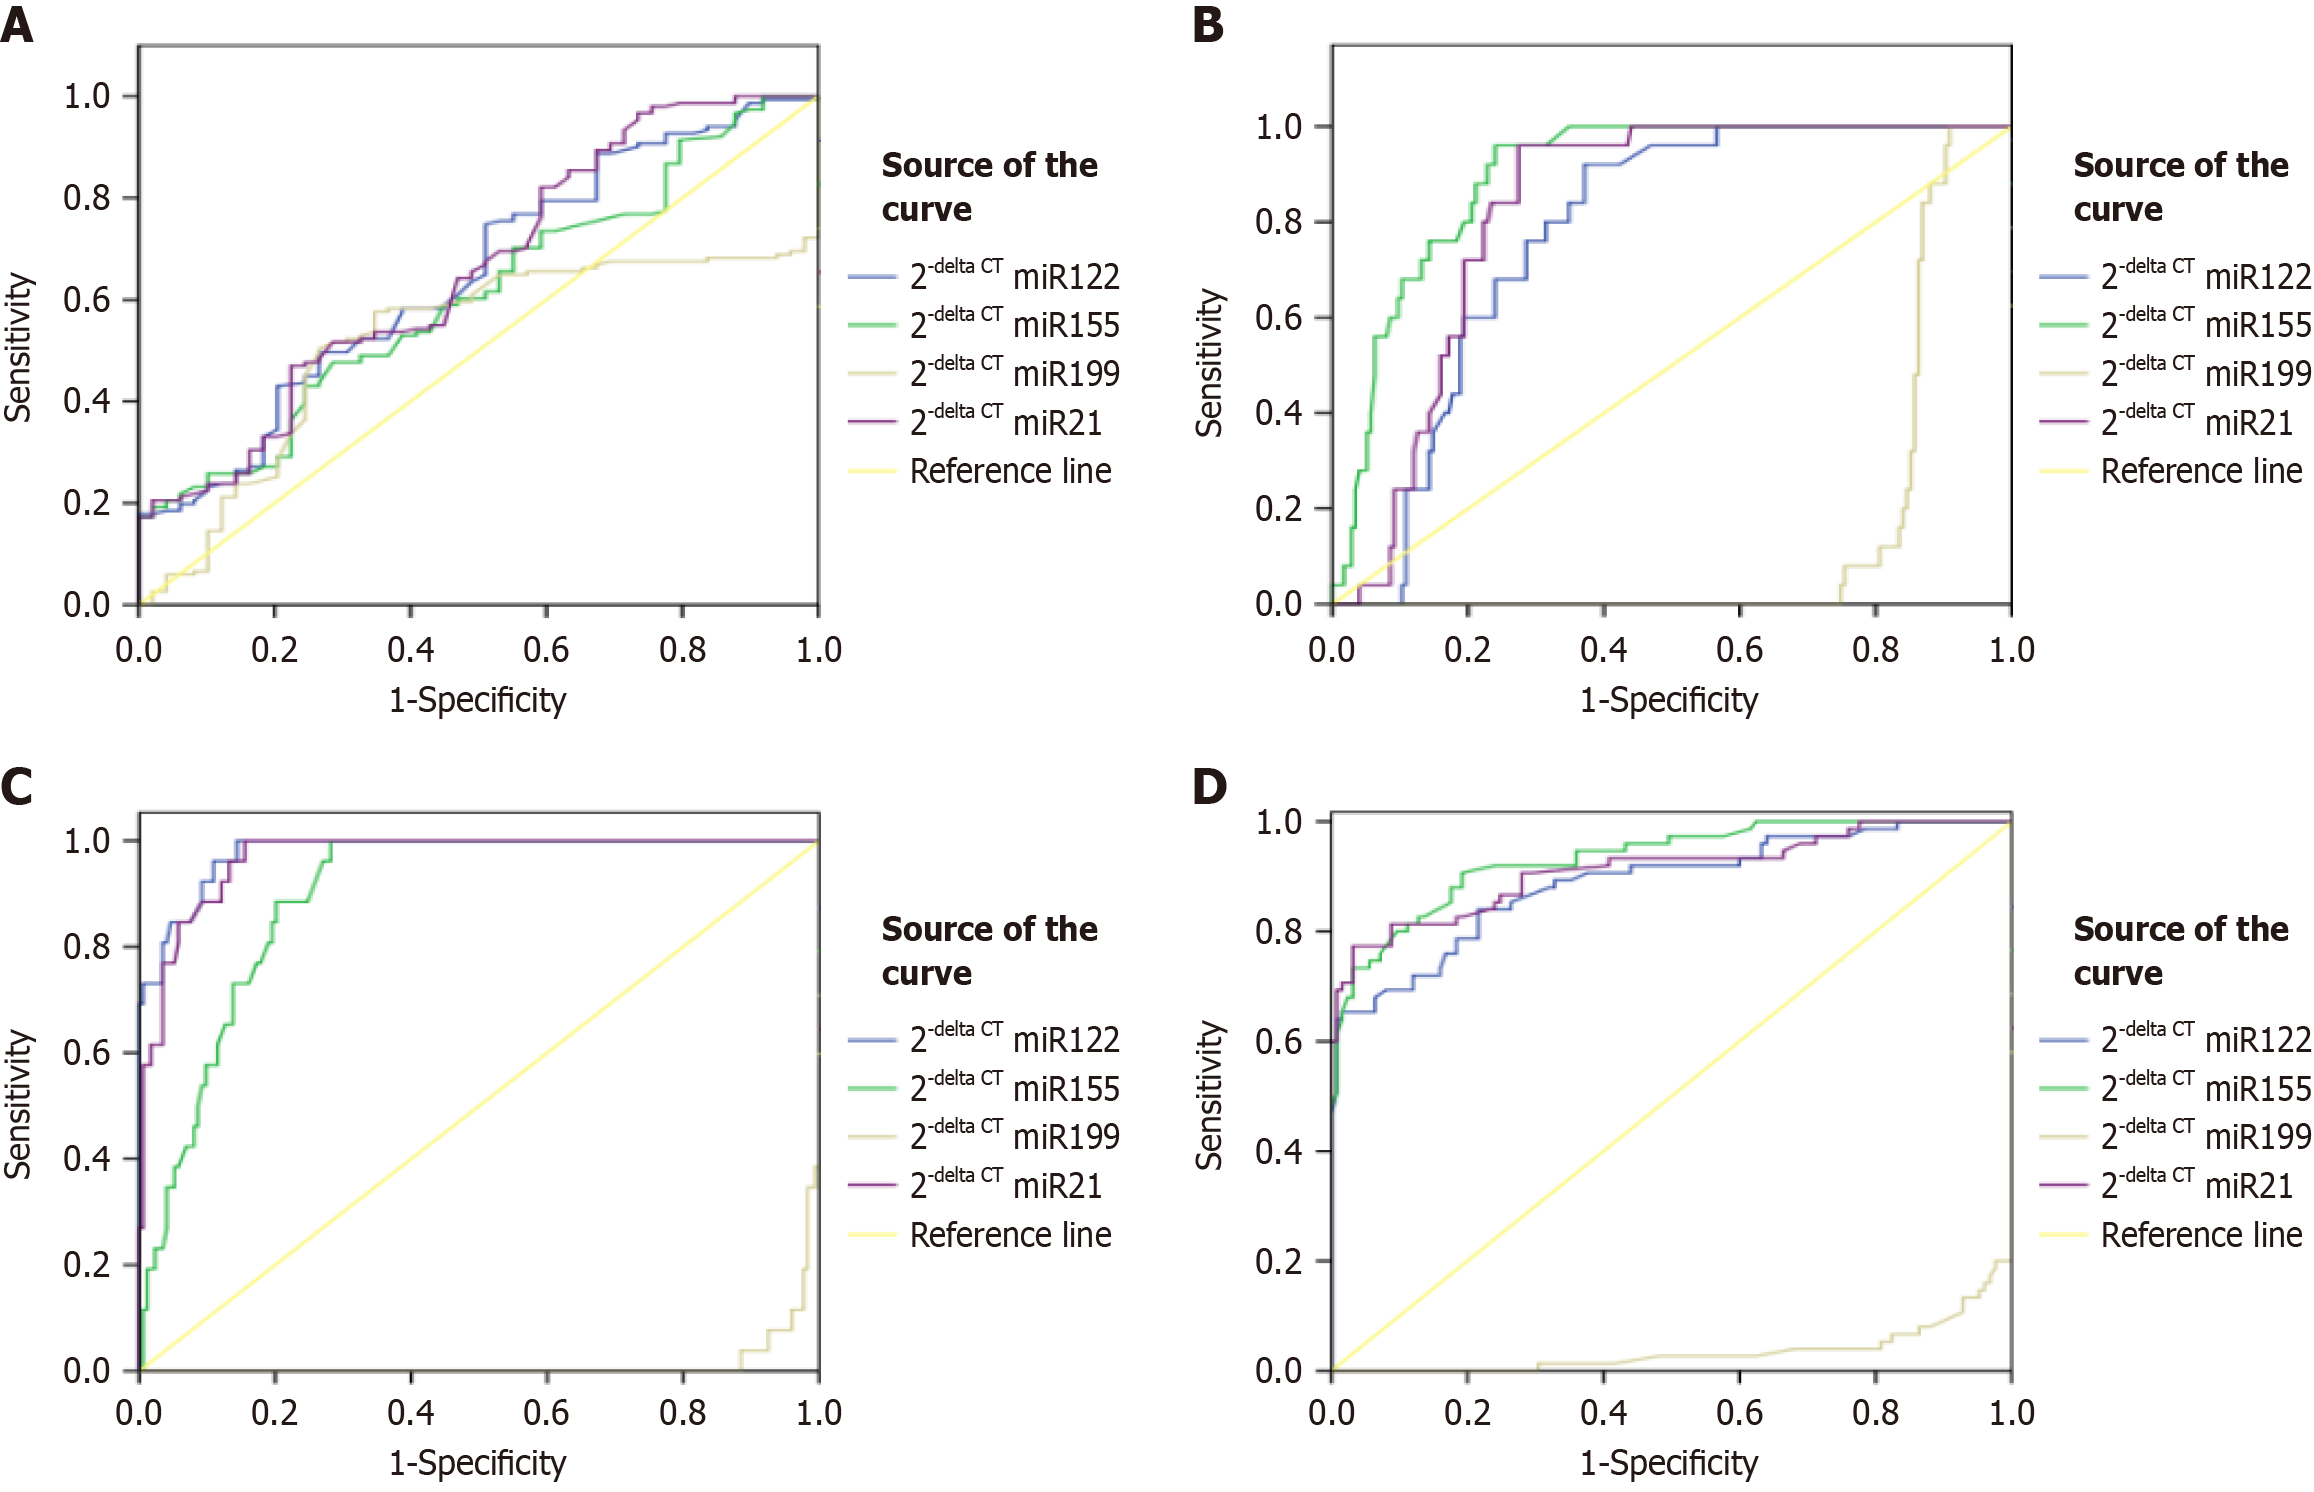
Figure 4 Area under the receiver operating characteristic curve for special investigations (four miRNAs).
A: Mild; B: Moderate; C: Severe; D: Overall fibrosis cases.
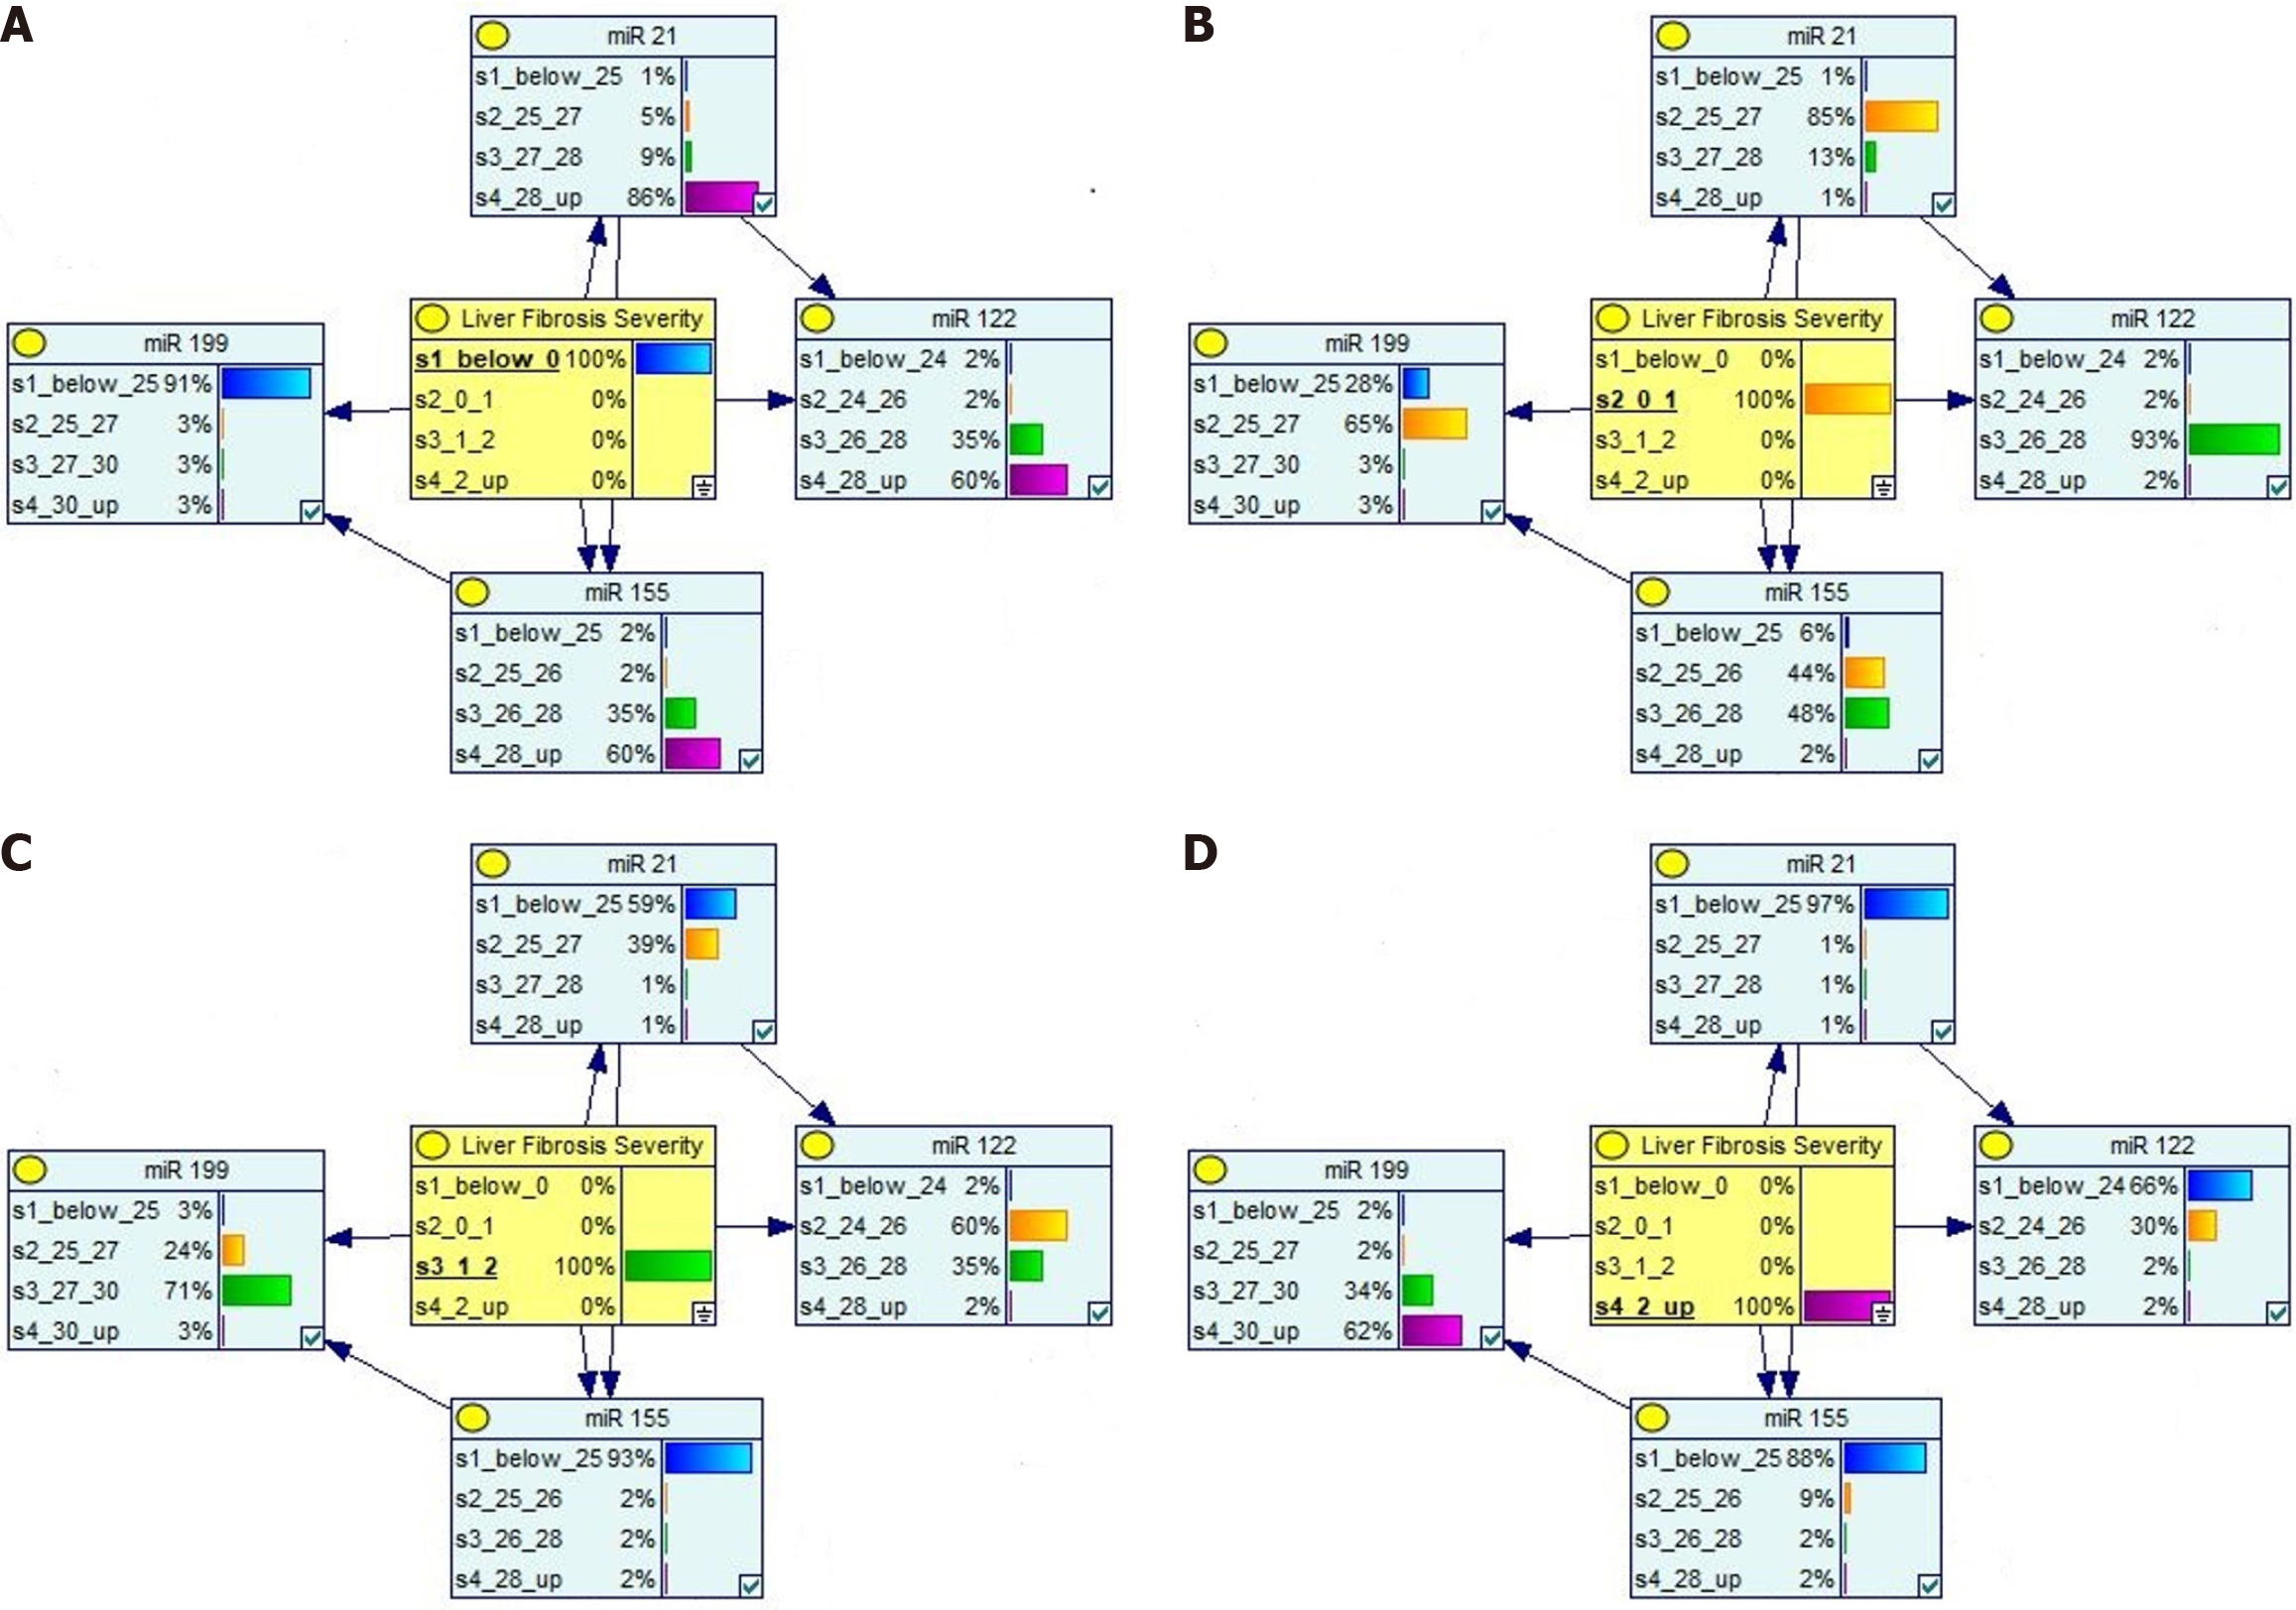
Figure 5 Bayesian analysis for severity of liver fibrosis.
A: Non-fibrotic; B: Mild fibrosis; C: Moderate fibrosis; D: Severe fibrosis.
- Citation: Kaur N, Garg R, Tapasvi C, Goyal G. Micro RNAs as a potential biomarker for predicting liver fibrosis severity in hepatitis C virus affected patients. World J Virol 2025; 14(2): 101976
- URL: https://www.wjgnet.com/2220-3249/full/v14/i2/101976.htm
- DOI: https://dx.doi.org/10.5501/wjv.v14.i2.101976


