















Copyright: ©Author(s) 2026.
World J Psychiatry. Aug 19, 2026; 16(8): 122383
Published online Aug 19, 2026. doi: 10.5498/wjp.122383
Published online Aug 19, 2026. doi: 10.5498/wjp.122383
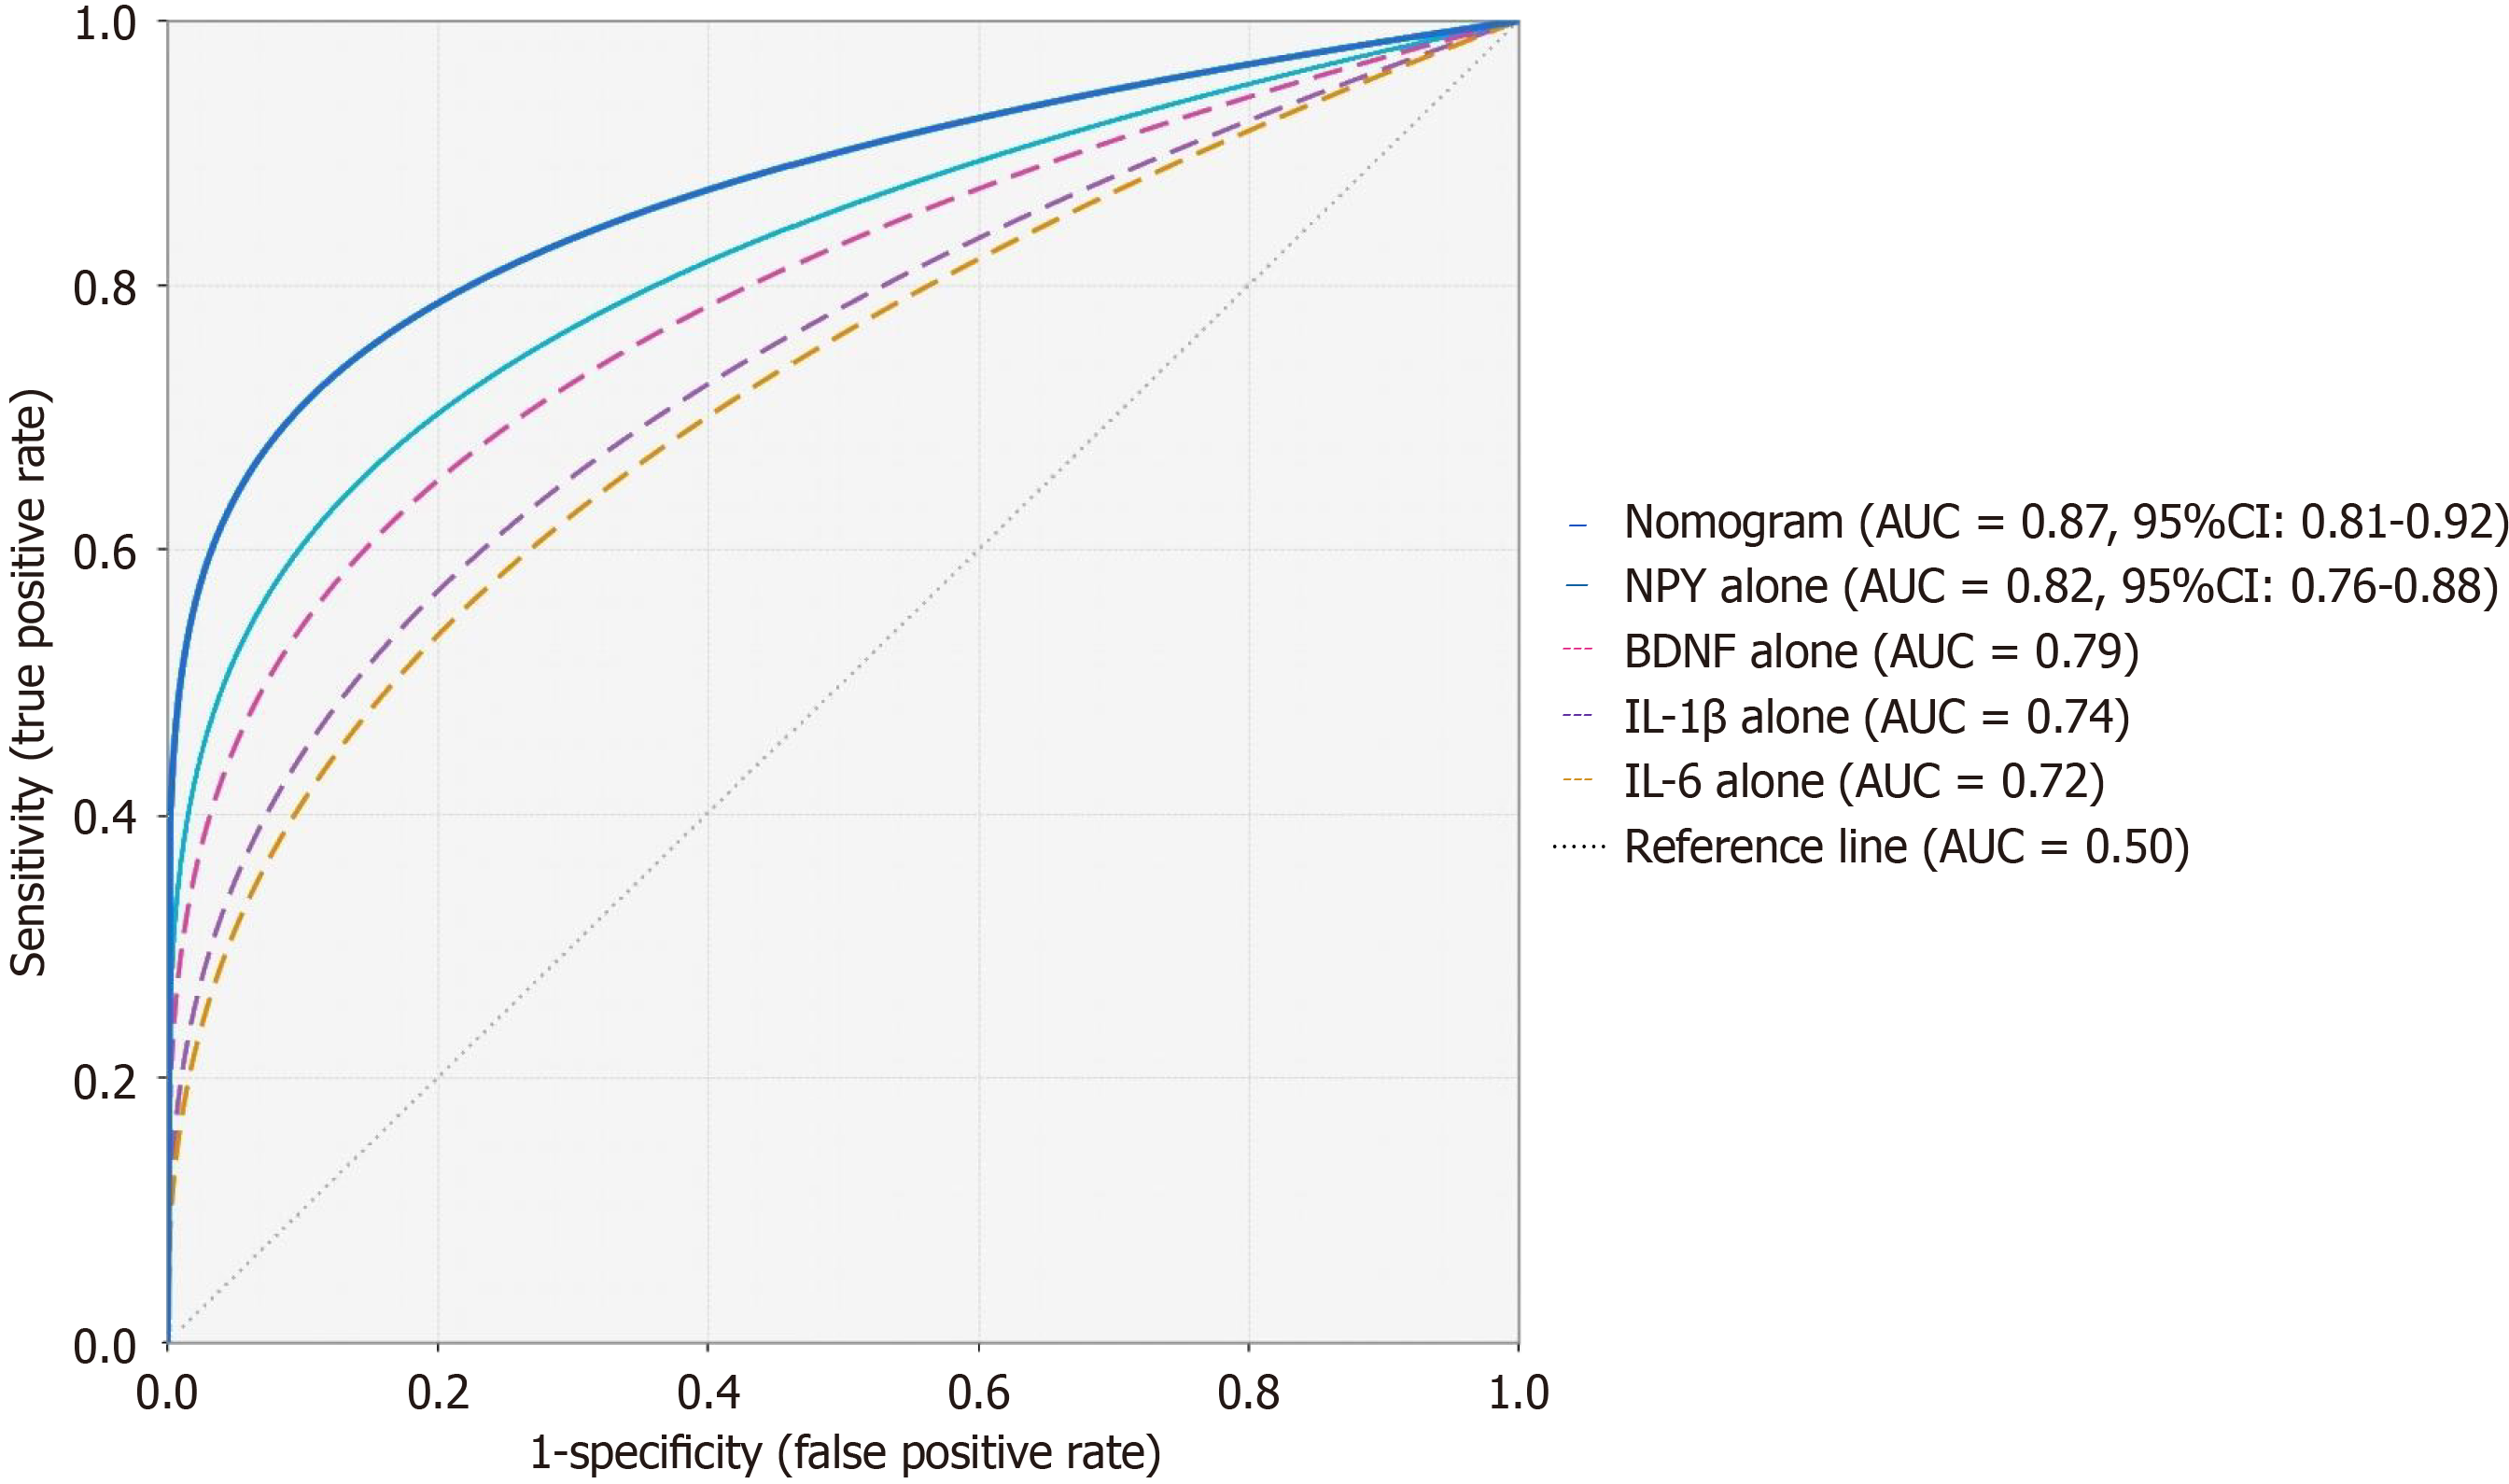
Figure 1 Receiver operating characteristic curves comparing the nomogram prediction model against individual biomarkers for predicting comprehensive rehabilitation treatment response.
The nomogram model integrating seven independent predictors achieved the highest area under the curve (AUC) (0.87), followed by neuropeptide Y alone (AUC = 0.82). All curves were significantly superior to the diagonal reference line (all P < 0.001, DeLong method). AUC: Area under the curve; CI: Confidence interval; NPY: Neuropeptide Y; BDNF: Brain-derived neurotrophic factor; IL: Interleukin.
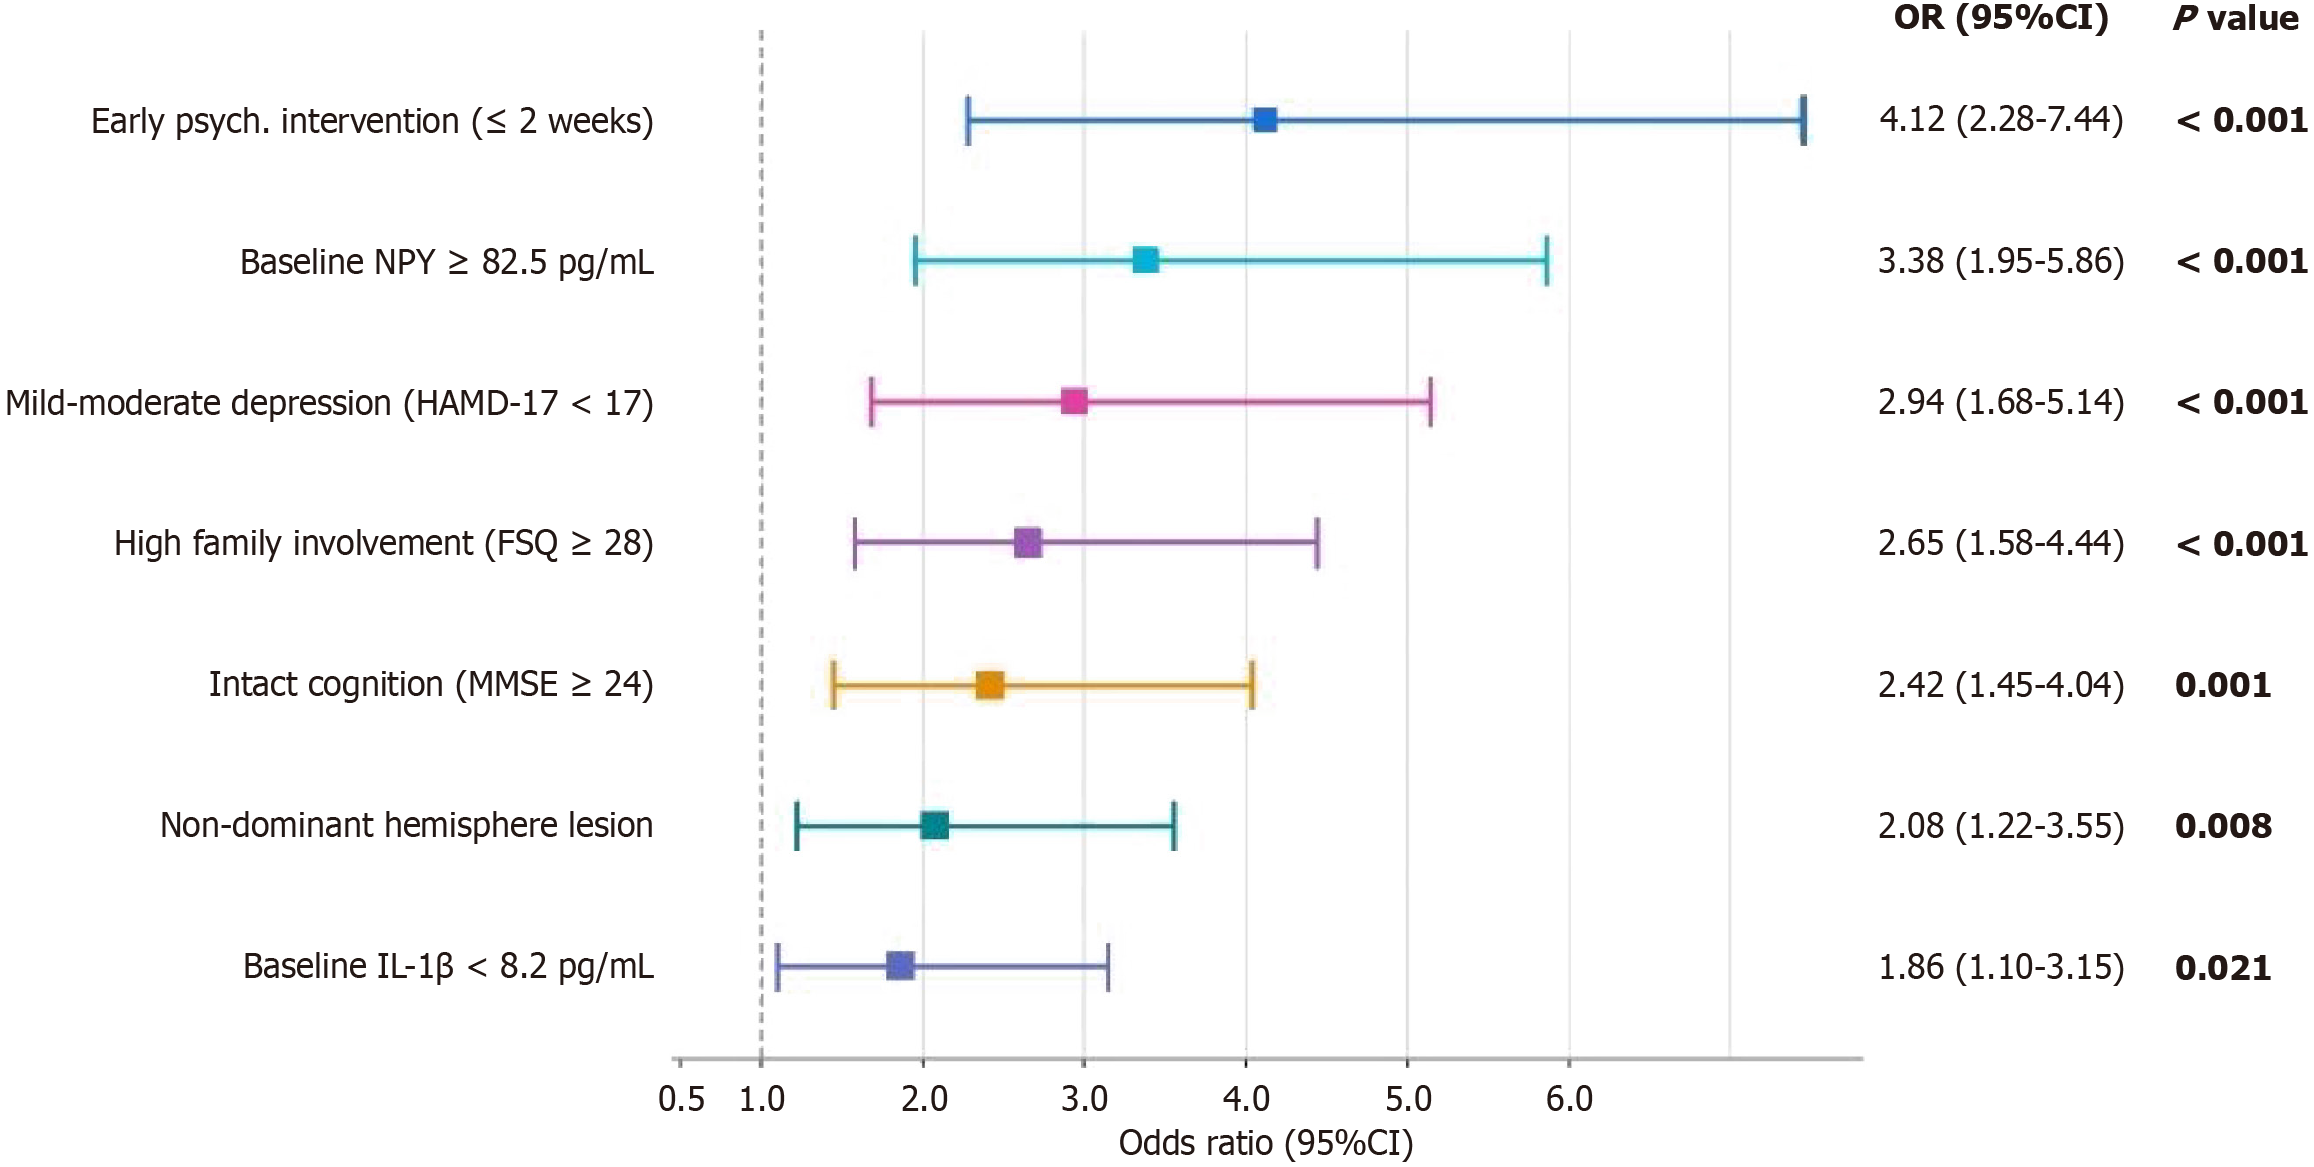
Figure 2 Forest plot displaying odds ratios and 95% confidence intervals for seven independent predictors of comprehensive rehabilitation treatment response from multivariable logistic regression analysis.
All confidence intervals lie entirely to the right of odds ratio = 1.0 (dashed reference line), confirming statistical significance. Colored squares represent point estimates; horizontal lines represent 95% confidence intervals. OR: Odds ratio; CI: Confidence interval; NPY: Neuropeptide Y; HAMD-17: Hamilton Depression Rating Scale-17; FSQ: Family support questionnaire; MMSE: Mini-Mental State Examination; IL: Interleukin.
- Citation: Yan SZ, Hu ZY, Zhou HY, Chai S. Comprehensive psychological and neurological rehabilitation for post-stroke depression: A retrospective comparative study with biomarker exploration. World J Psychiatry 2026; 16(8): 122383
- URL: https://www.wjgnet.com/2220-3206/full/v16/i8/122383.htm
- DOI: https://dx.doi.org/10.5498/wjp.122383