
















Copyright: ©Author(s) 2026.
World J Psychiatry. Aug 19, 2026; 16(8): 122295
Published online Aug 19, 2026. doi: 10.5498/wjp.122295
Published online Aug 19, 2026. doi: 10.5498/wjp.122295
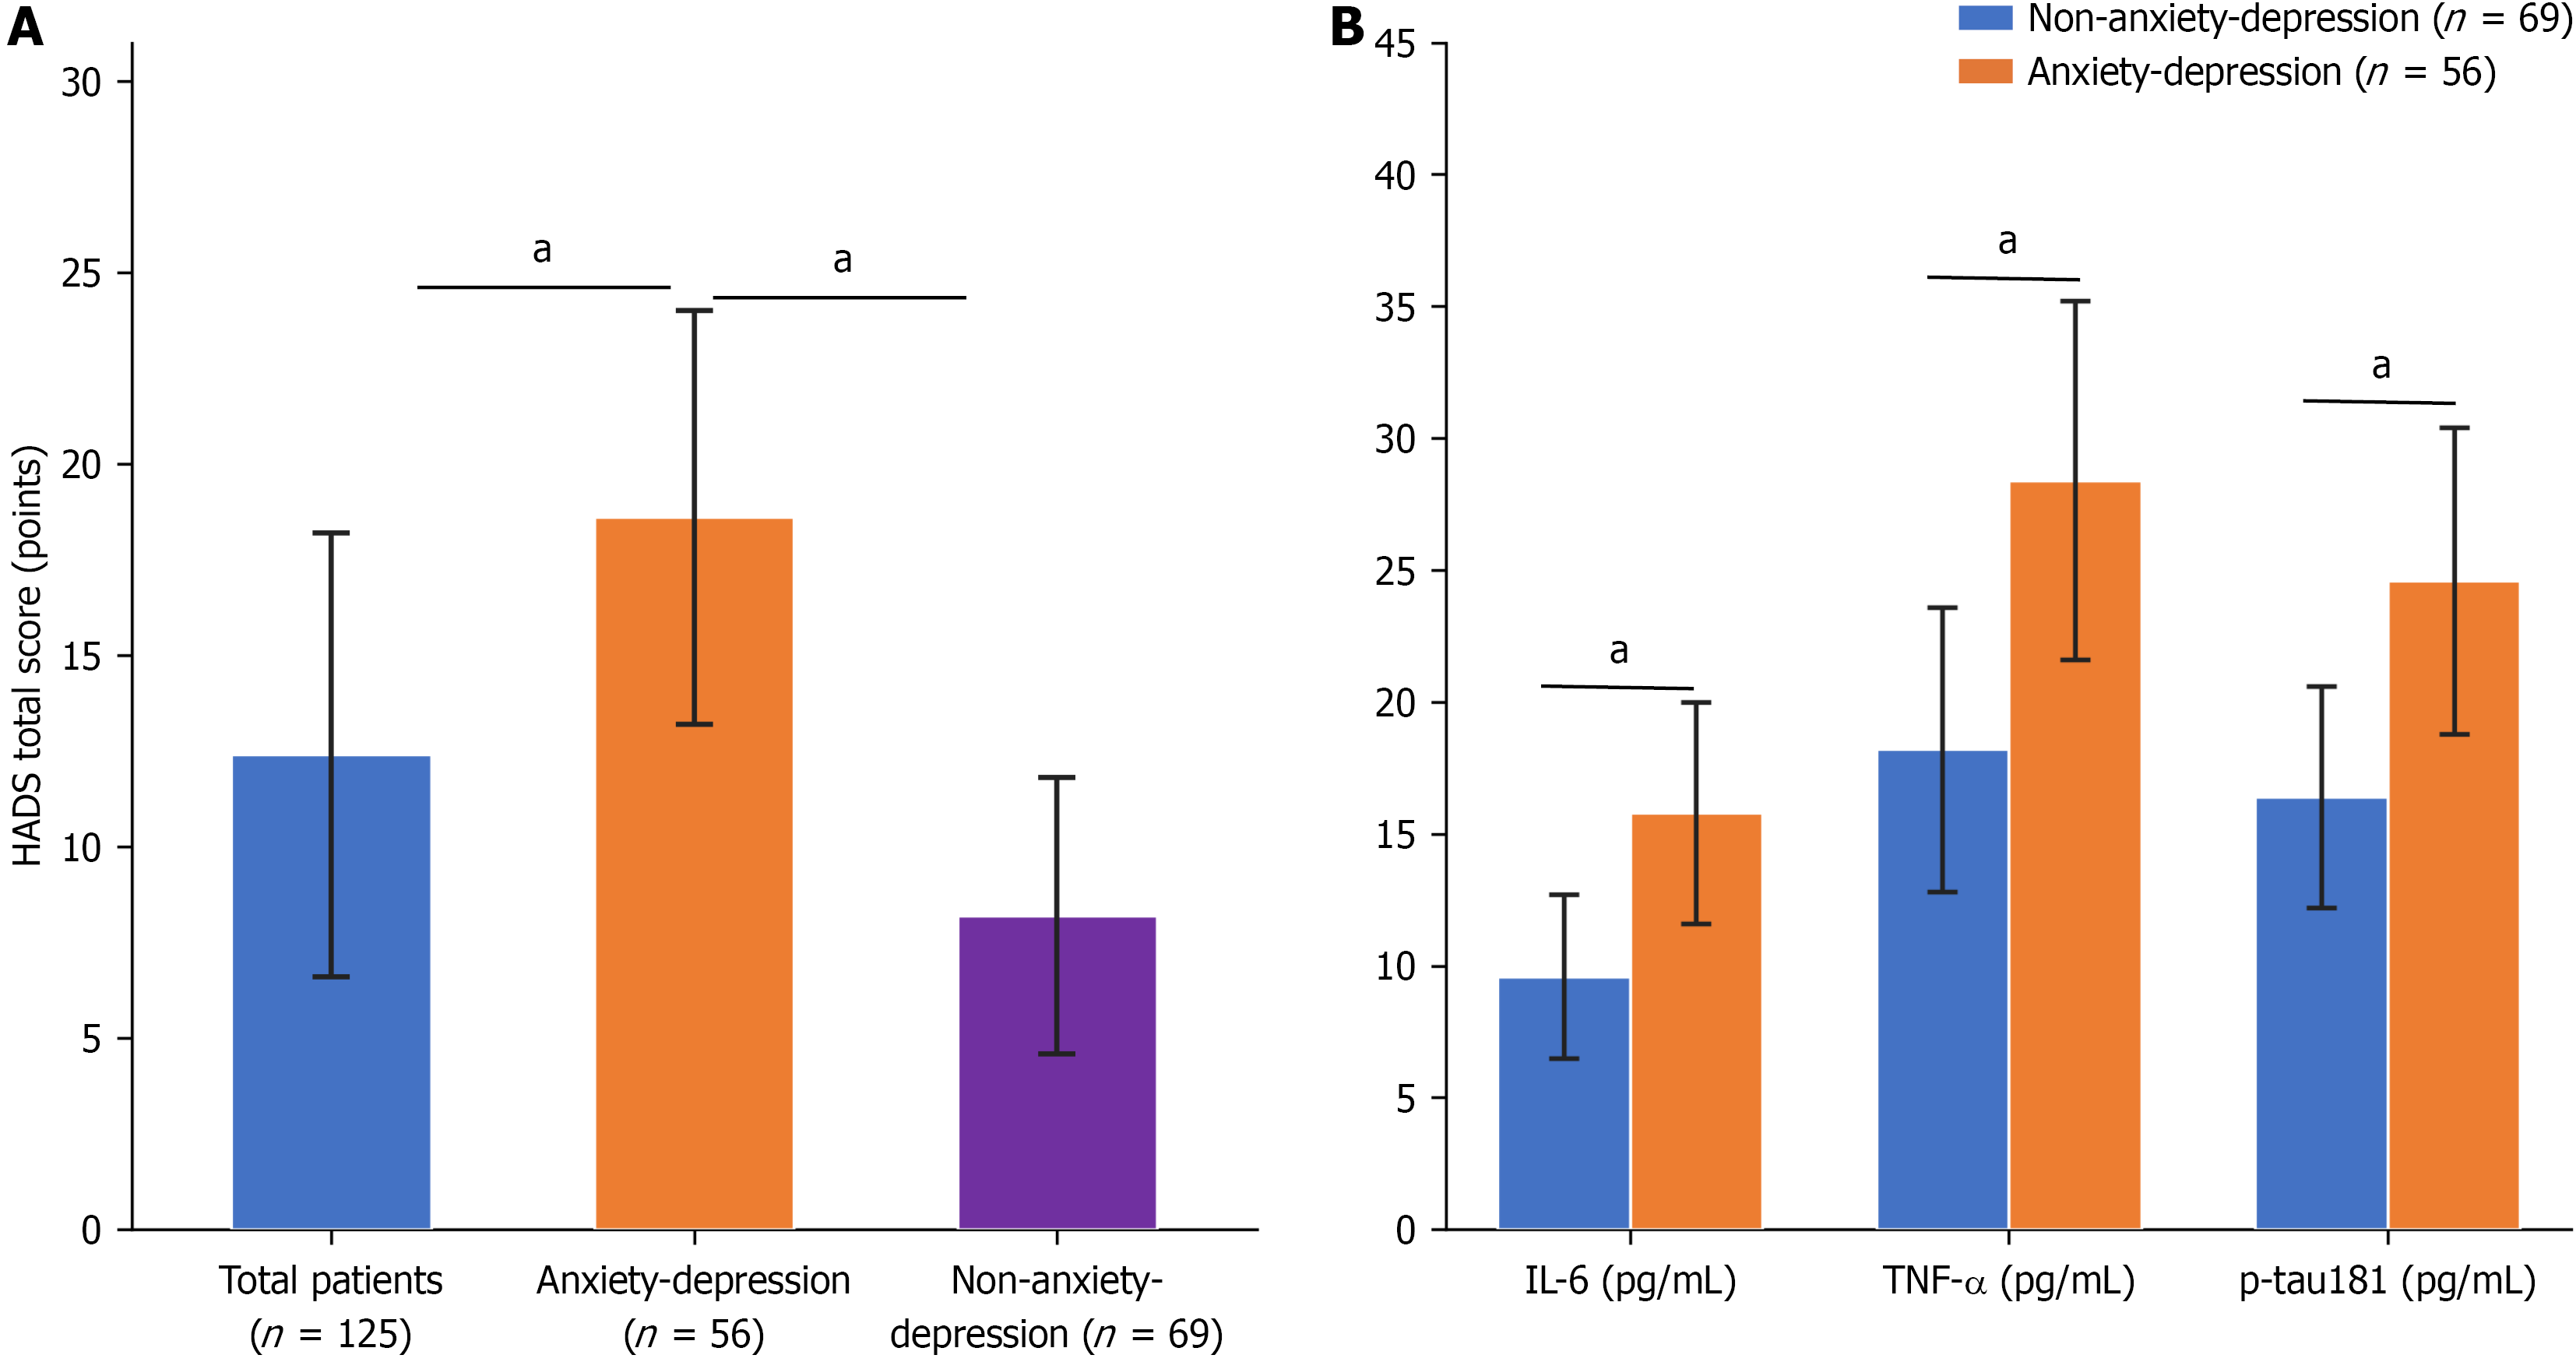
Figure 1 Comparison of different groups.
A: Comparison of Hospital Anxiety and Depression Scale scores; B: Comparison of biomarker levels between groups. aP < 0.05. HADS: Hospital Anxiety and Depression Scale; IL-6: Interleukin-6; TNF-α: Tumor necrosis factor-alpha; p-tau181: Phosphorylated tau-181.
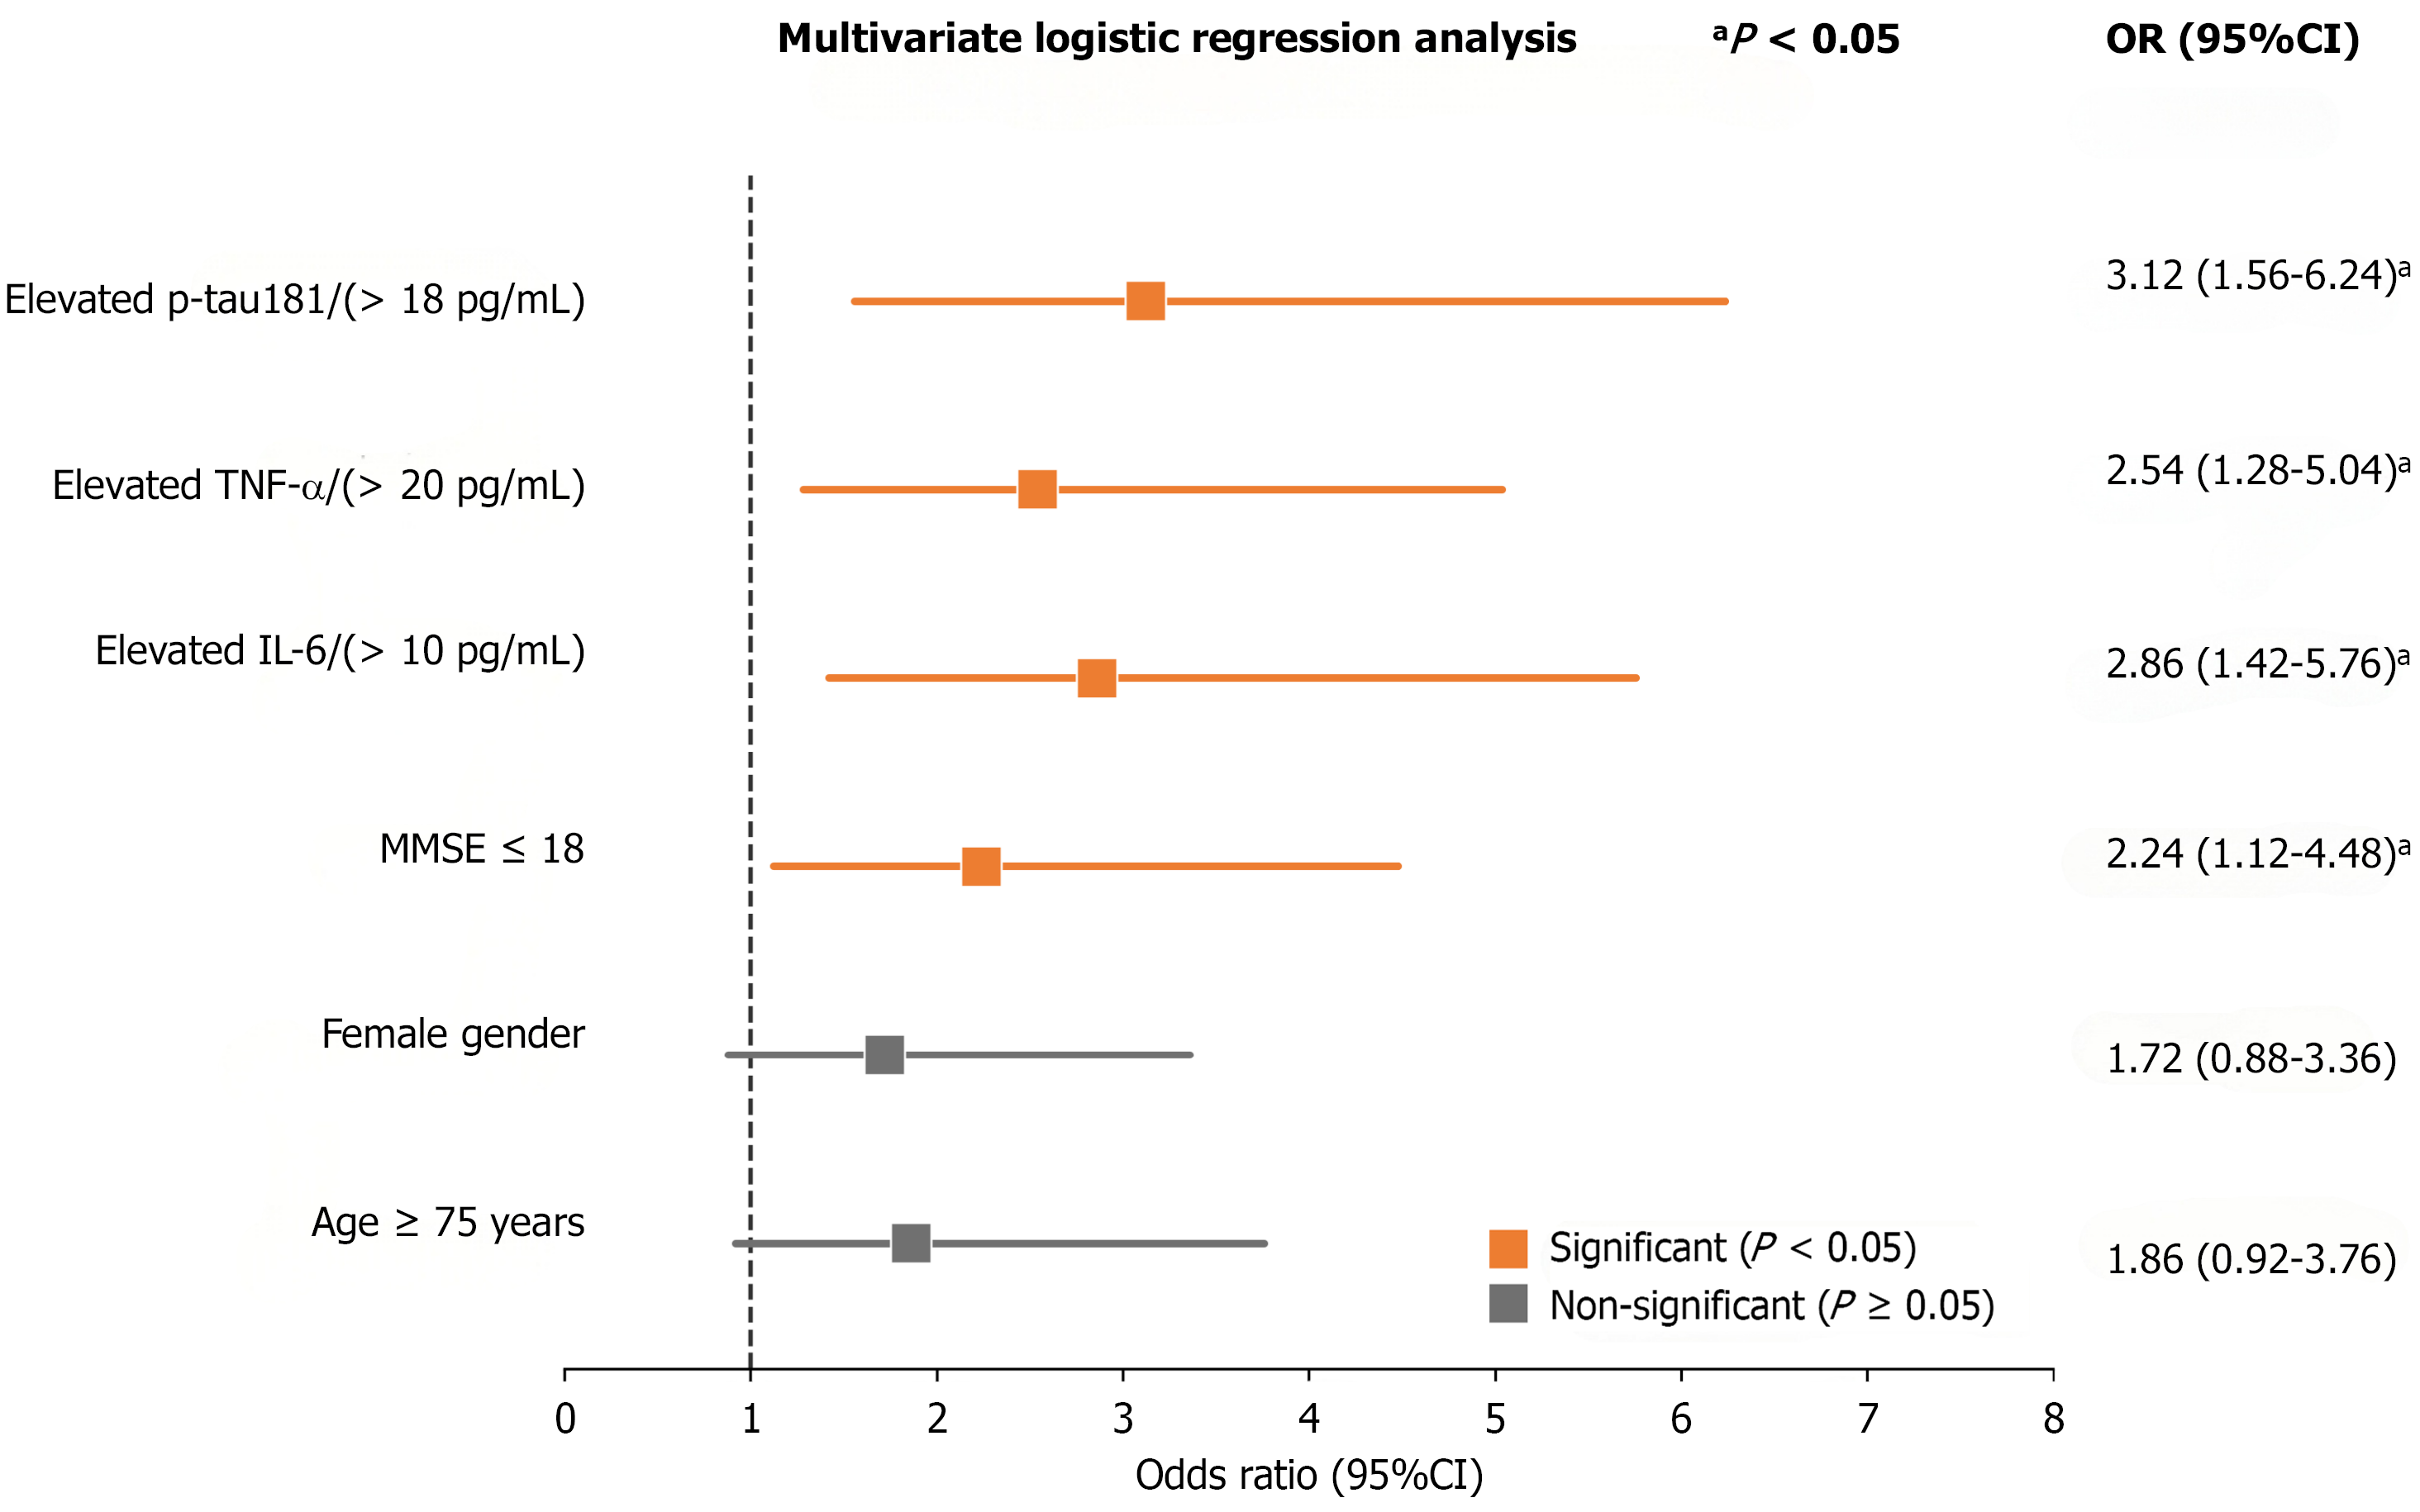
Figure 2 Forest plot of multivariate logistic regression analysis.
Orange squares indicate significant associations; gray squares indicate non-significant associations. aP < 0.05. IL-6: Interleukin-6; TNF-α: Tumor necrosis factor-alpha; p-tau181: Phosphorylated tau-181; MMSE: Mini-Mental State Examination; OR: Odds ratio; CI: Confidence interval.
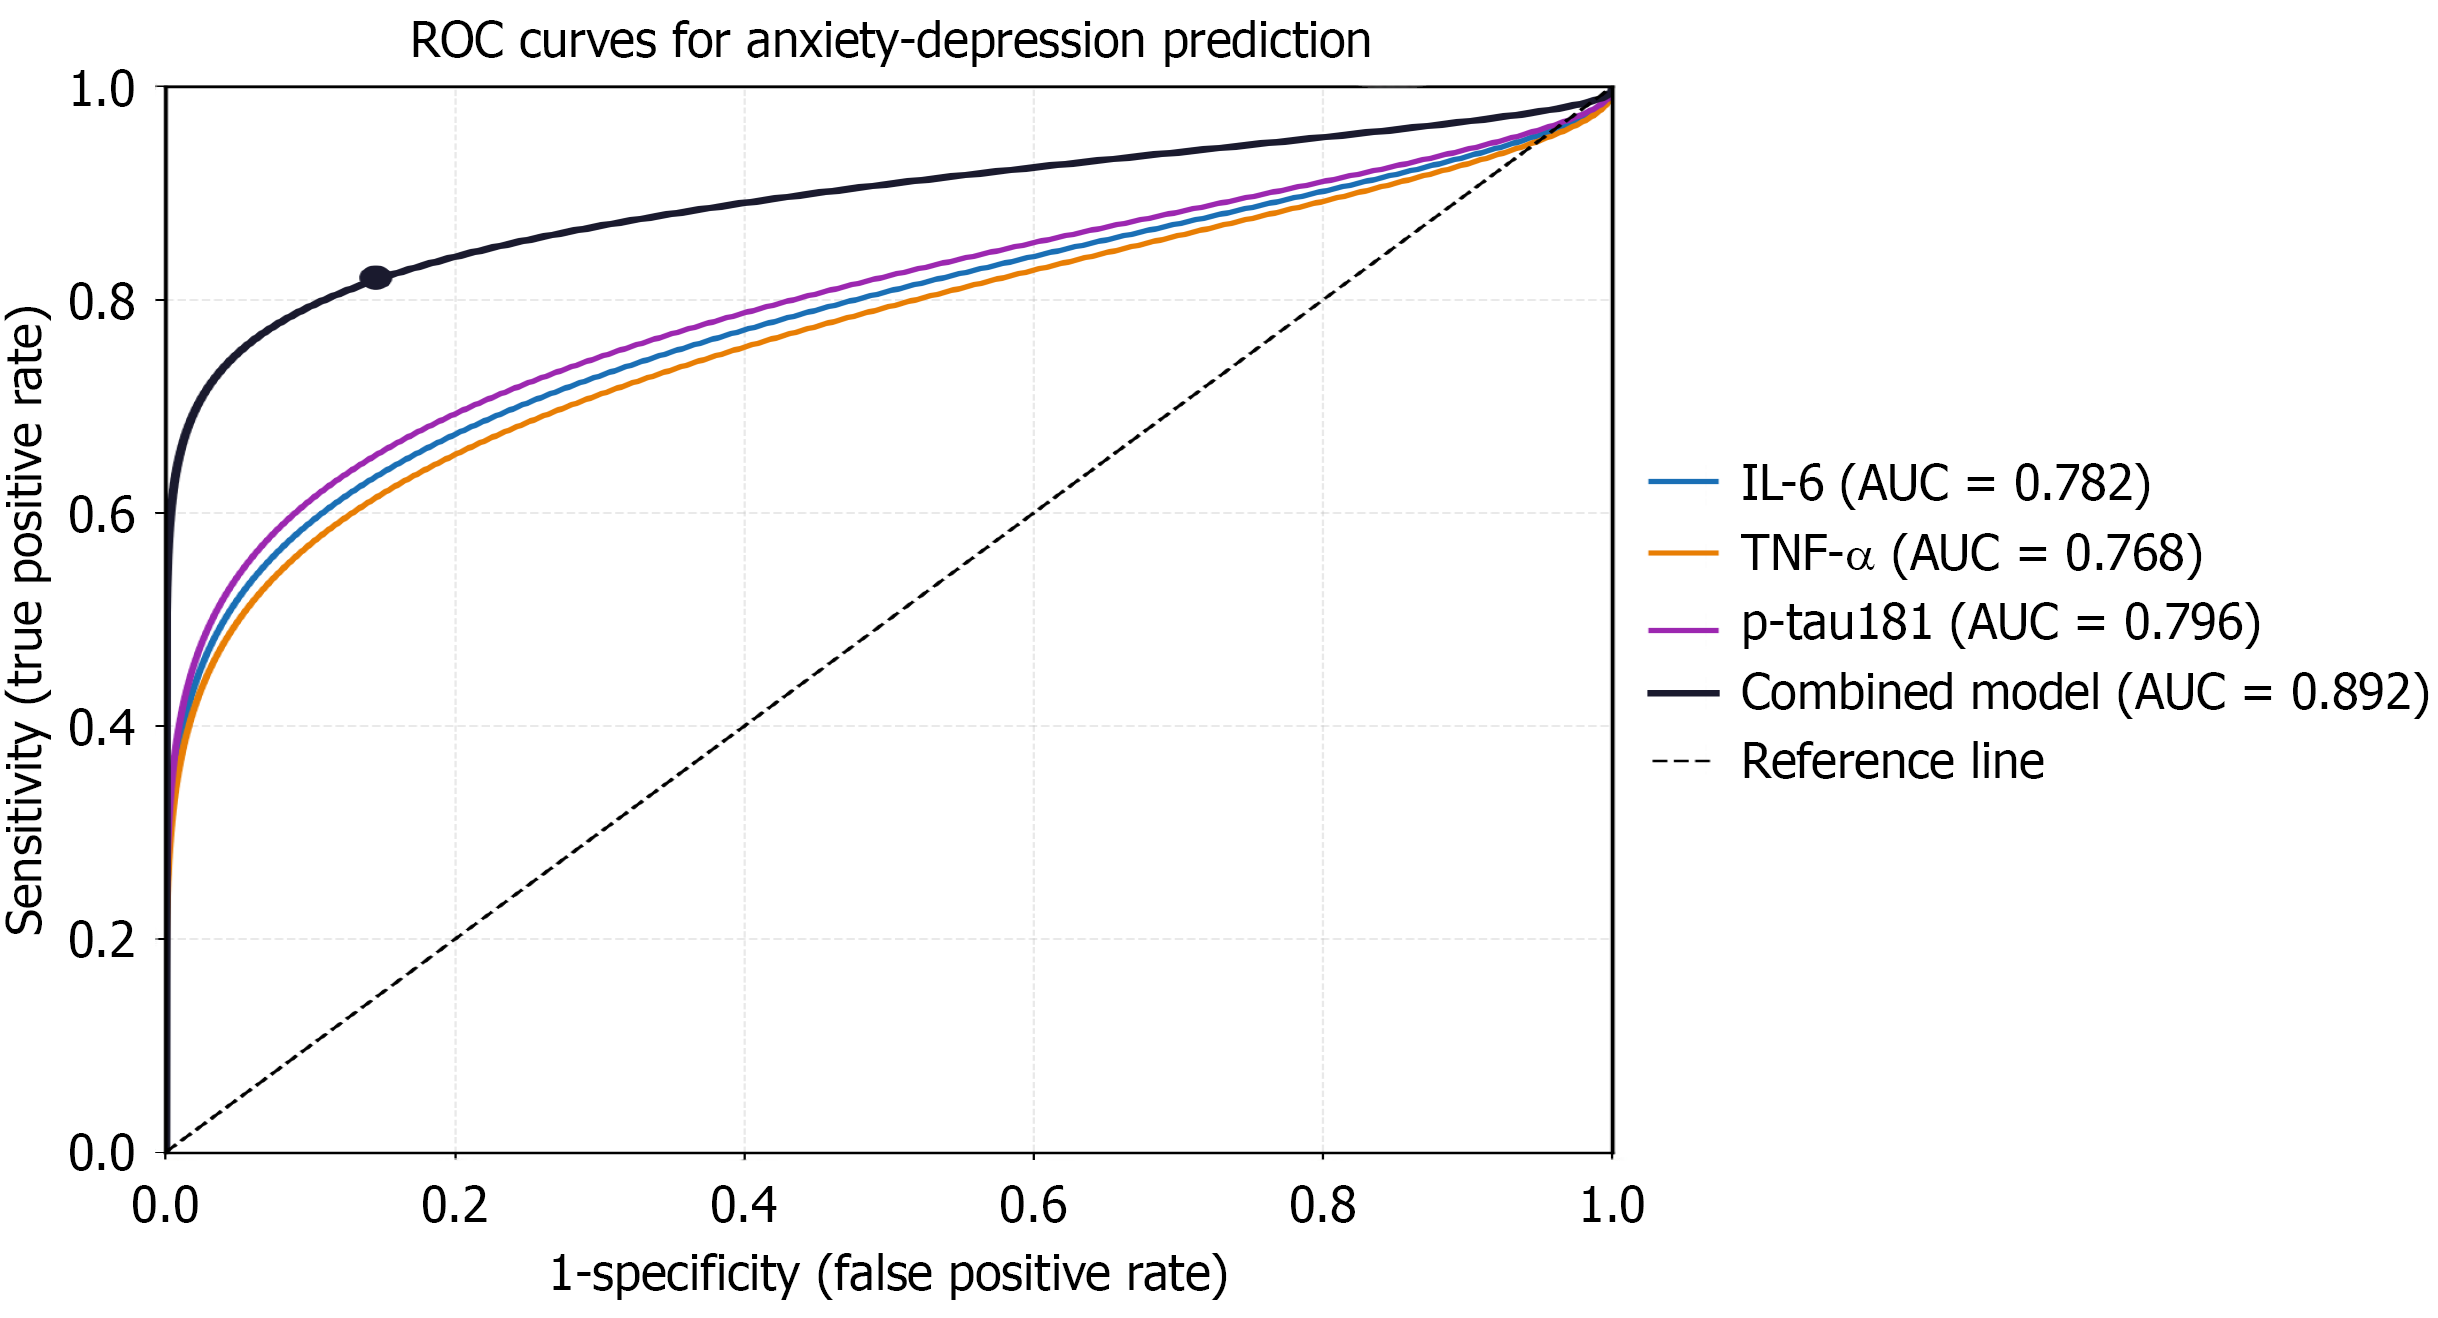
Figure 3 Receiver operating characteristic curve analysis for predictive value of biomarkers.
The combined model achieved the highest area under curve (0.892). ROC: Receiver operating characteristic; IL-6: Interleukin-6; TNF-α: Tumor necrosis factor-alpha; p-tau181: Phosphorylated tau-181; AUC: Area under curve.
- Citation: Hu X, Tao J, Jiang YL, Liu K. Predictive value of serum inflammatory factors combined with p-tau181 for anxiety and depression in Alzheimer’s disease patients. World J Psychiatry 2026; 16(8): 122295
- URL: https://www.wjgnet.com/2220-3206/full/v16/i8/122295.htm
- DOI: https://dx.doi.org/10.5498/wjp.122295