
















Copyright: ©Author(s) 2026.
World J Psychiatry. Aug 19, 2026; 16(8): 117931
Published online Aug 19, 2026. doi: 10.5498/wjp.117931
Published online Aug 19, 2026. doi: 10.5498/wjp.117931
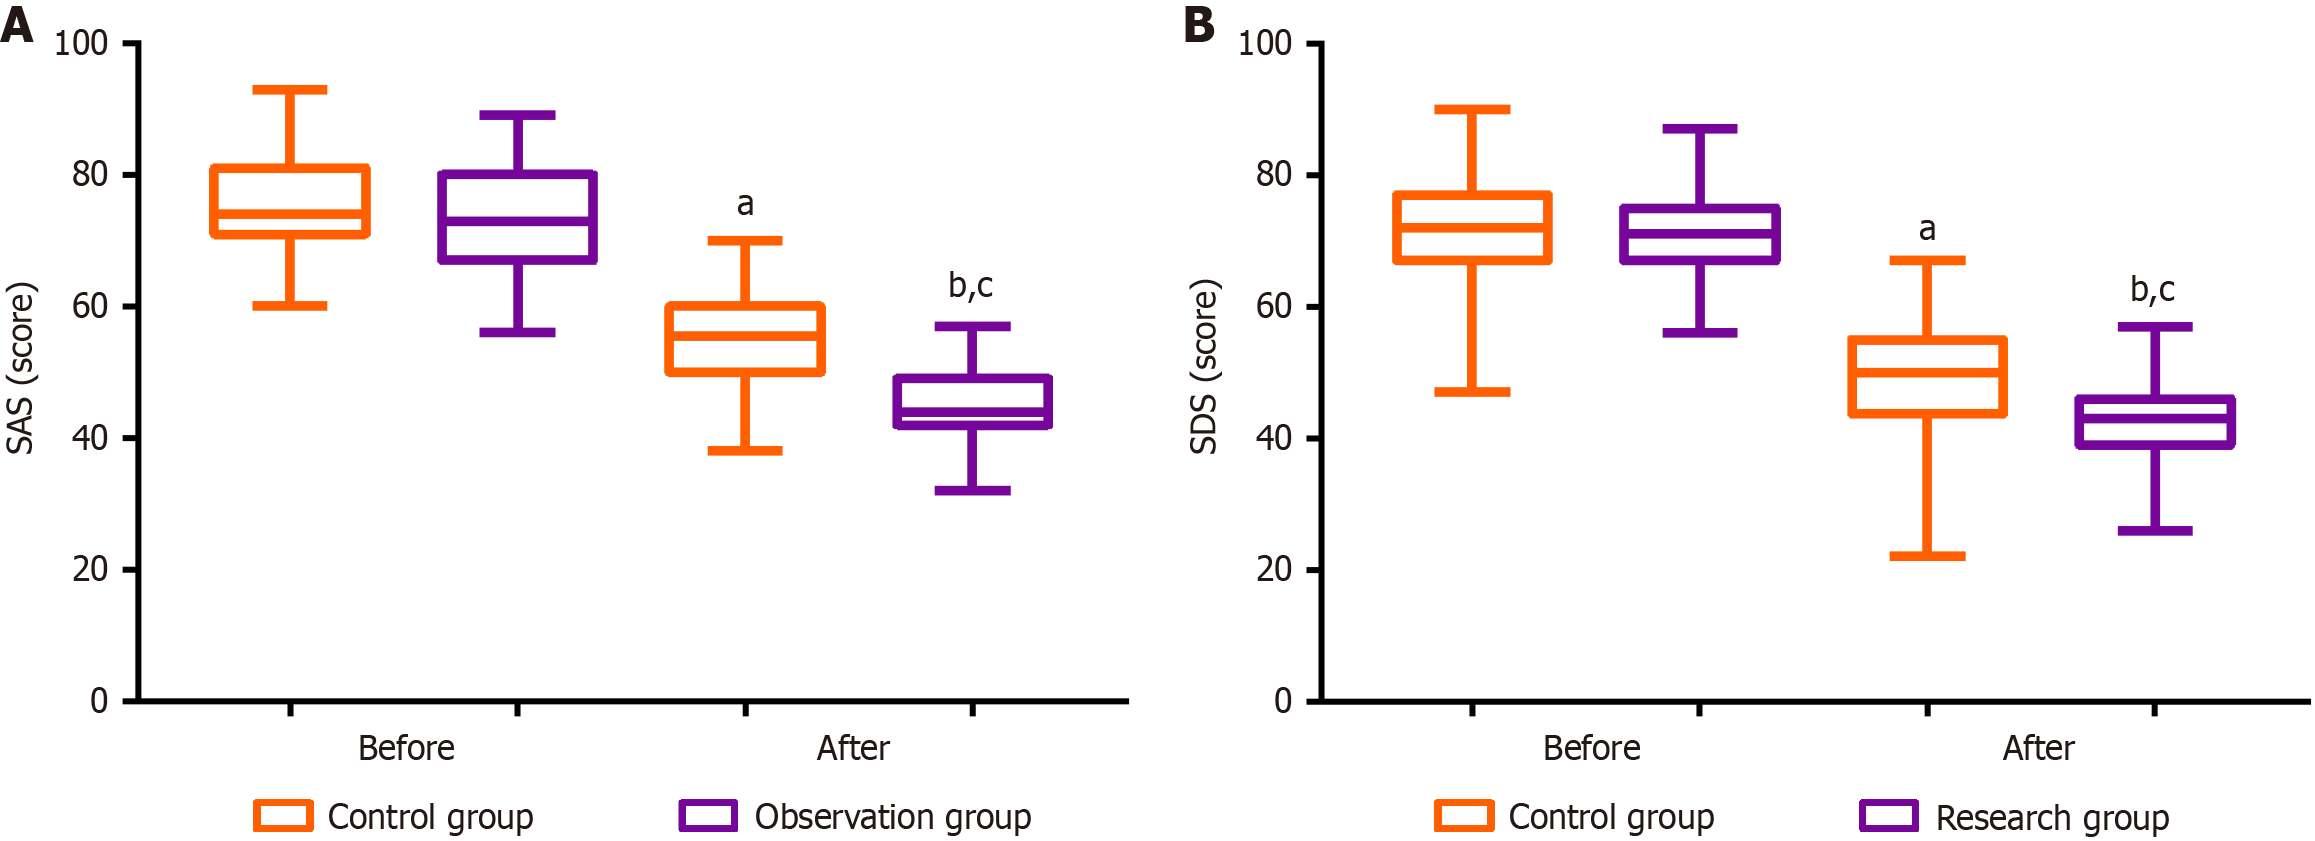
Figure 1 Adverse mood analysis.
A: Pre- and post-interventional Self-Rating Anxiety Scale scores; B: Pre- and post-interventional Self-Rating Depression Scale scores. aP < 0.05 and bP < 0.01 vs the pre-interventional level; cP < 0.05 vs control at the same time point. SAS: Self-Rating Anxiety Scale; SDS: Self-Rating Depression Scale.
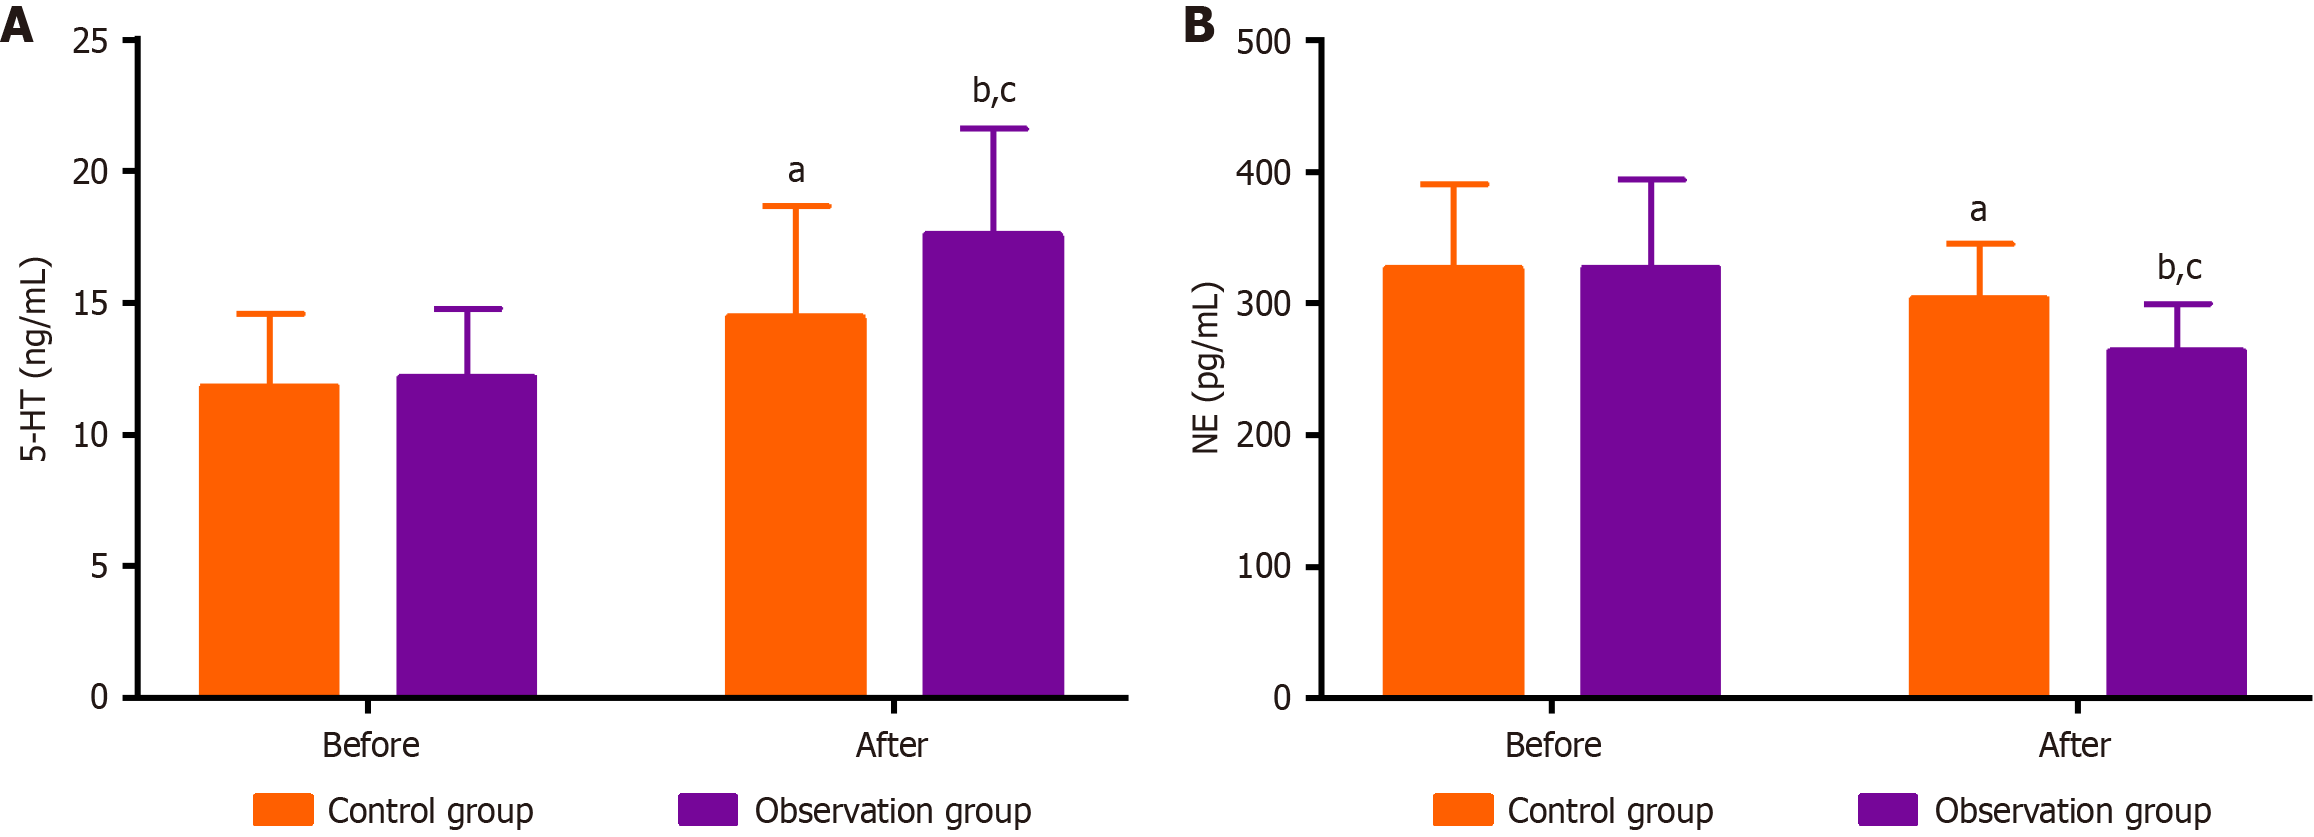
Figure 2 Serum neurotransmitter measurements.
A: Pre- and post-interventional 5-hydroxytryptamine; B: Pre- and post-interventional norepinephrine. aP < 0.05 and bP < 0.01 vs the pre-interventional level; cP < 0.05 vs control at the same time point. 5-HT: 5-hydroxytryptamine; NE: Norepinephrine.
- Citation: Zhu XX, Zhao S, Xu Q, Tang R, Xu LX, Zhou YJ, Zhang DY. Fluoxetine plus psychological intervention for chemotherapy-managed colon cancer patients: Impact on mood and influencing factors. World J Psychiatry 2026; 16(8): 117931
- URL: https://www.wjgnet.com/2220-3206/full/v16/i8/117931.htm
- DOI: https://dx.doi.org/10.5498/wjp.117931