
















Copyright: ©Author(s) 2026.
World J Psychiatry. Jul 19, 2026; 16(7): 119221
Published online Jul 19, 2026. doi: 10.5498/wjp.119221
Published online Jul 19, 2026. doi: 10.5498/wjp.119221
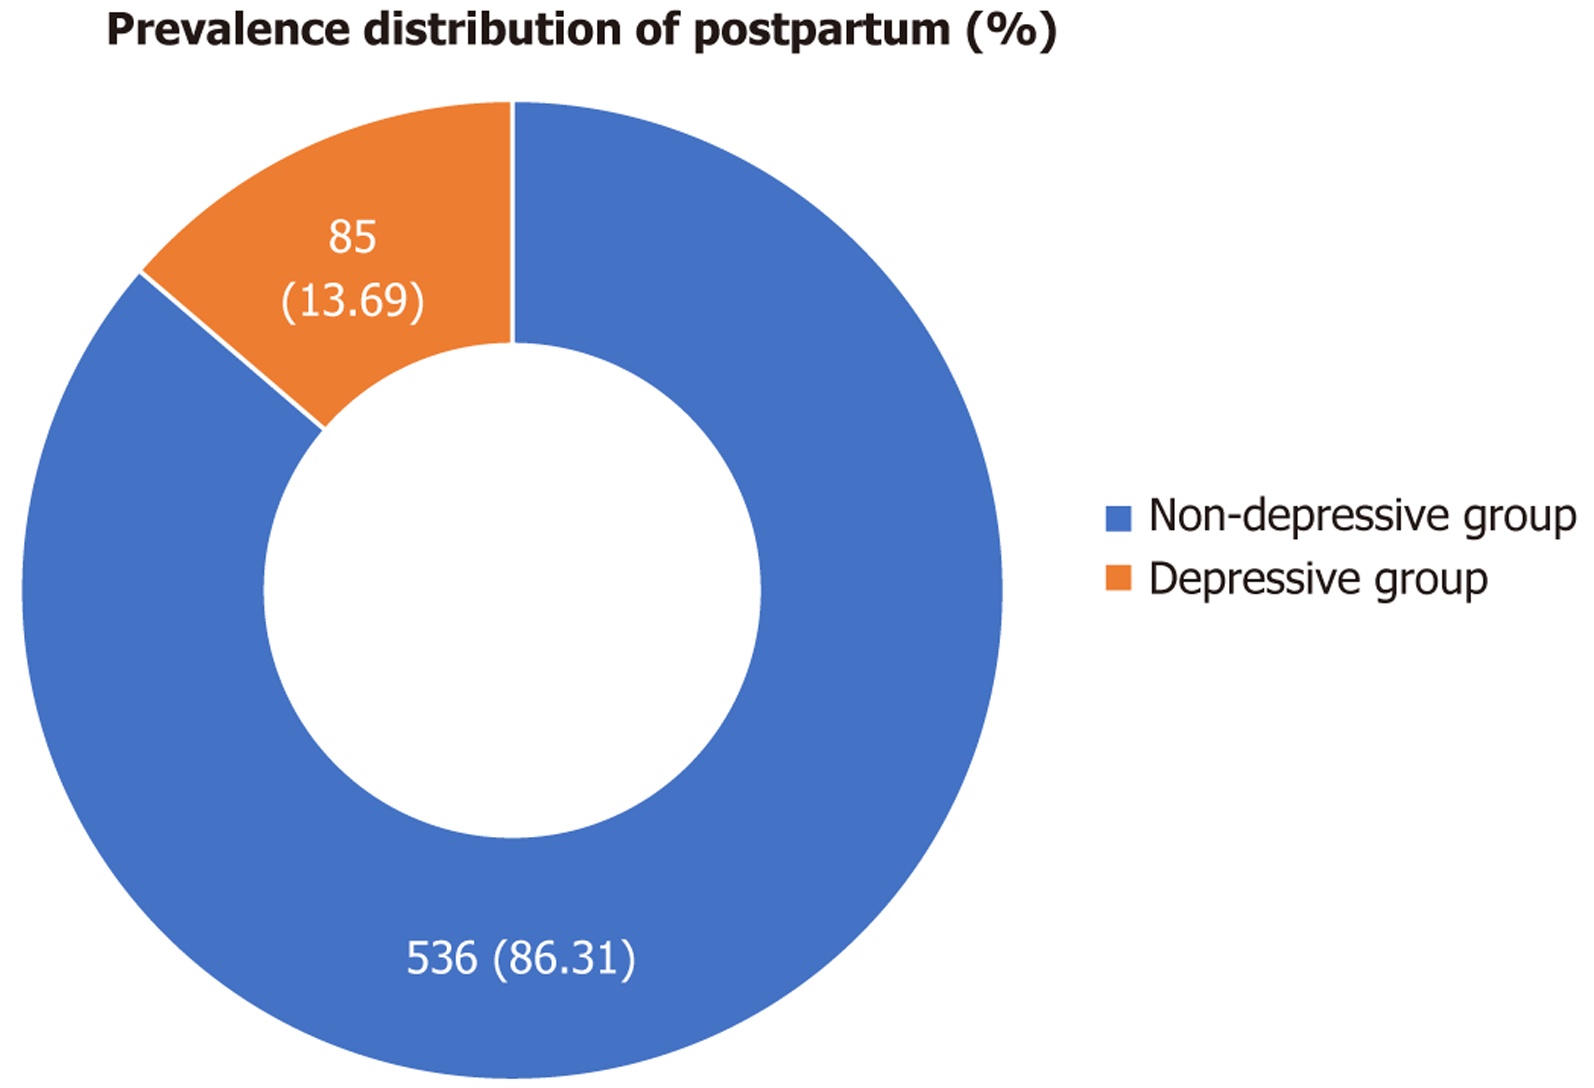
Figure 1 Prevalence of paternal postpartum depression in Suzhou.
Donut chart showing the distribution of paternal postpartum depression among 621 participants in Suzhou (China). The depressive group (n = 85) accounted for 1369% of the total sample, while the non-depressive group (n = 536) accounted for 8631%. Postpartum depression was assessed using the Edinburgh Postnatal Depression Scale.
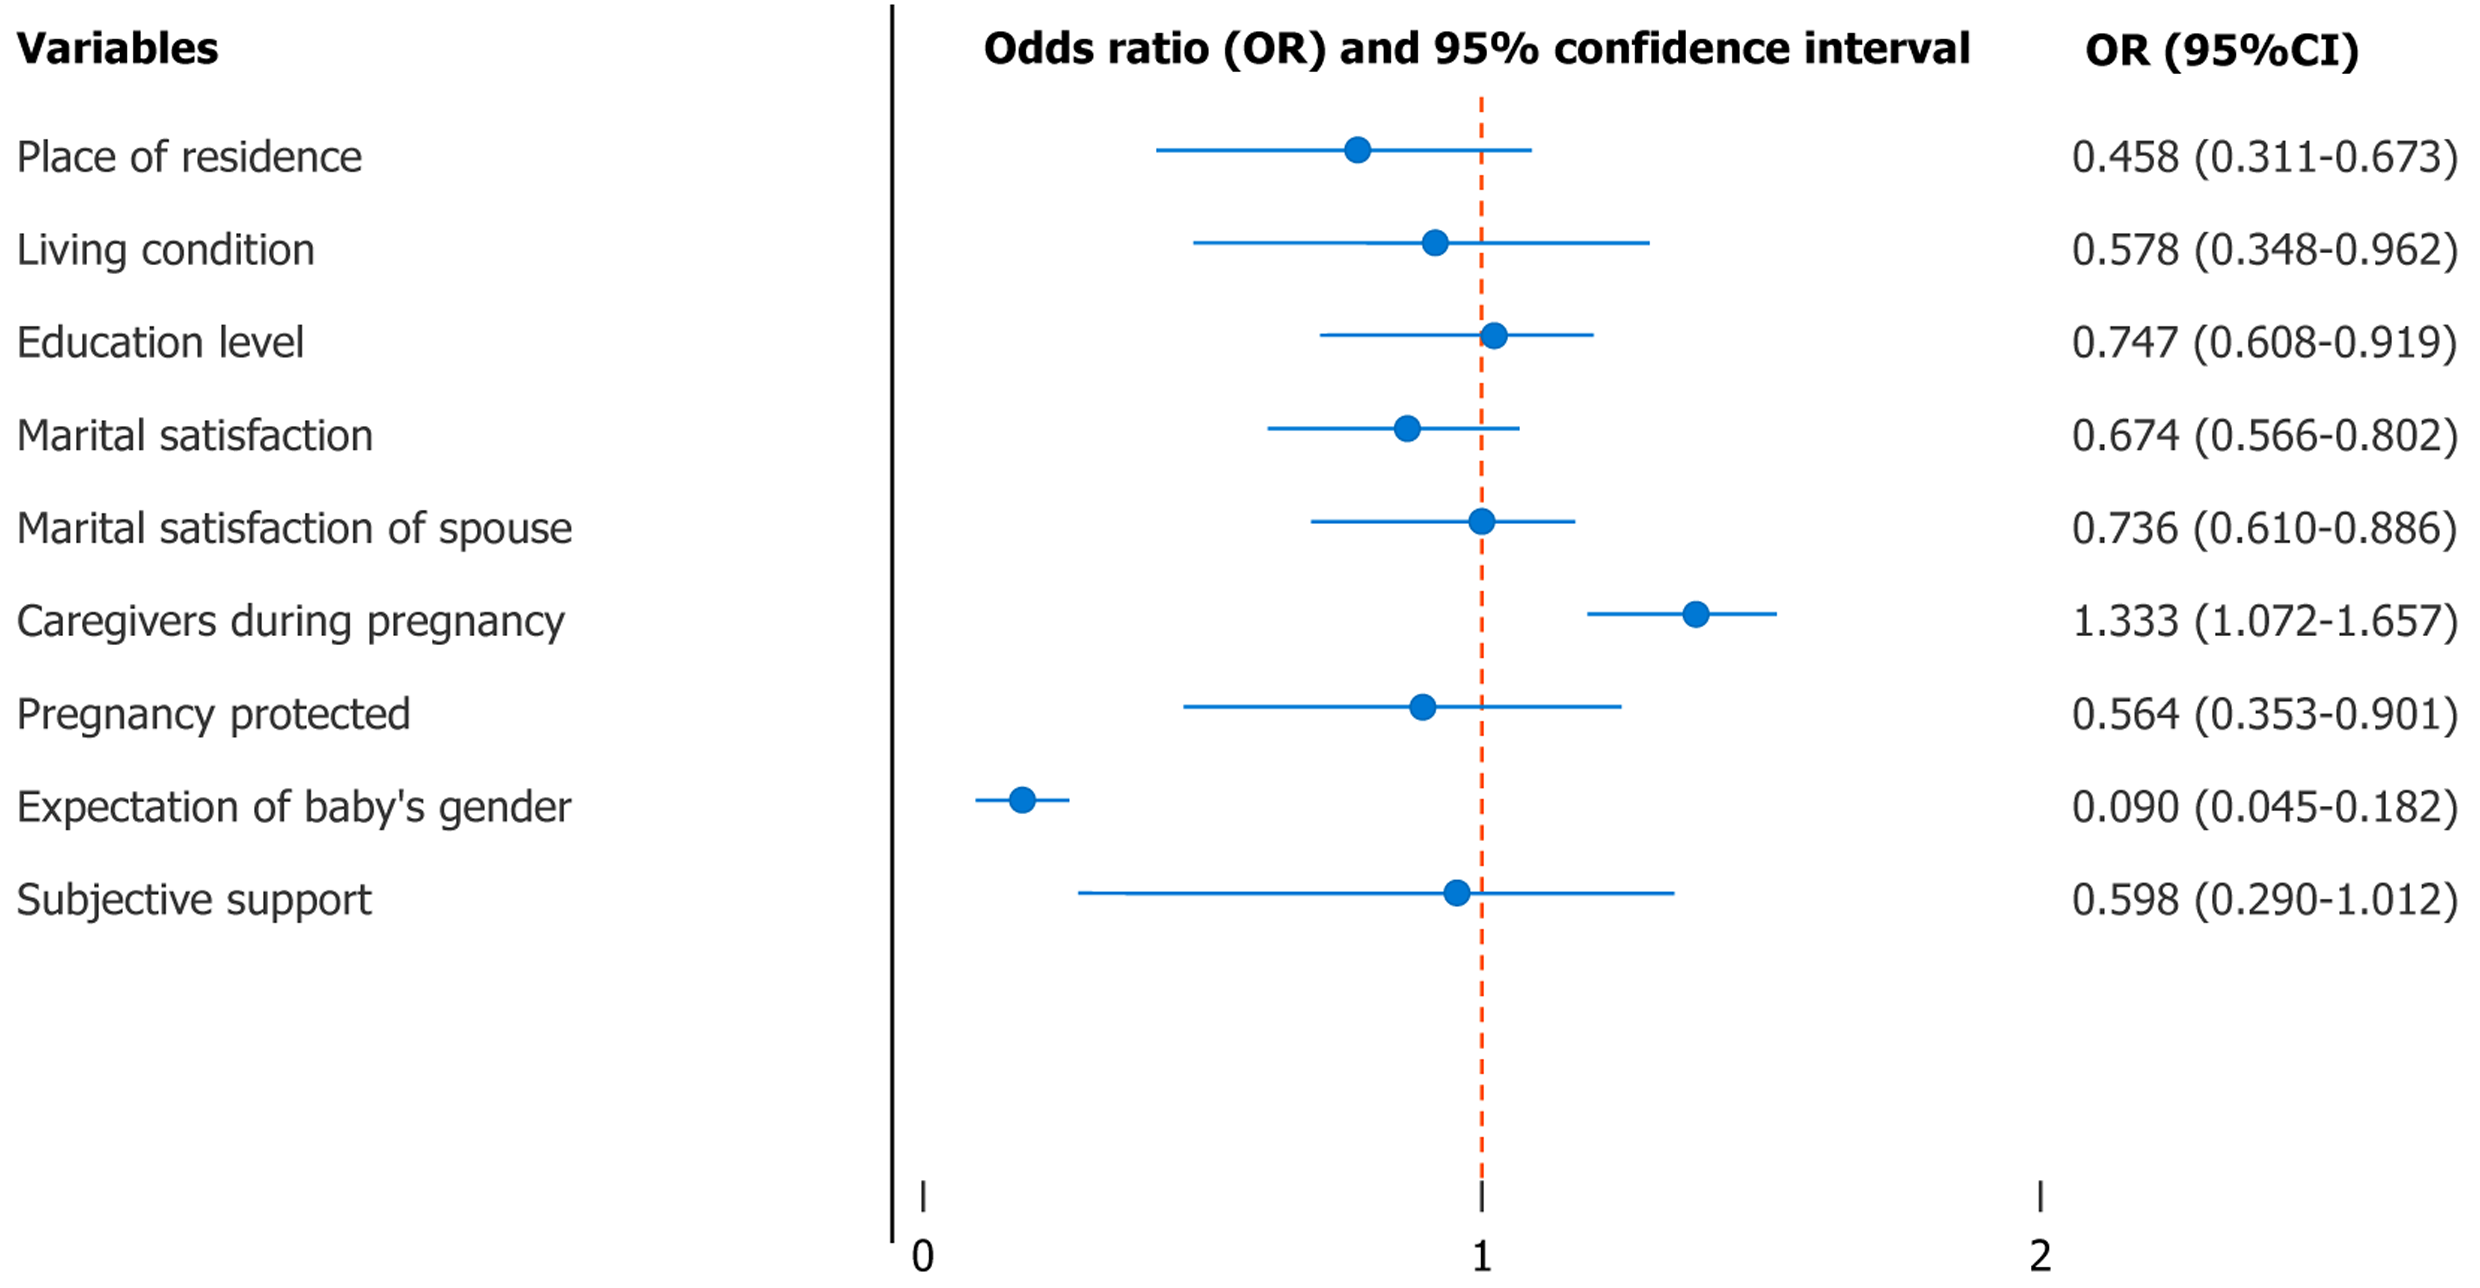
Figure 2 Forest plot of binary logistic regression analysis for paternal postpartum depression.
Odds ratios and 95% confidence intervals for significant predictors of paternal postpartum depression in the multivariate binary logistic regression model. Significant protective factors include place of residence, living conditions, education level, and marital satisfaction, while caregivers during pregnancy was a significant risk factor. OR: Odds ratio; CI: Confidence interval.
- Citation: Wang XX, Chao LH, Ji CF, Li HJ. Paternal postpartum depression in Suzhou: An analysis of prevalence and risk factors. World J Psychiatry 2026; 16(7): 119221
- URL: https://www.wjgnet.com/2220-3206/full/v16/i7/119221.htm
- DOI: https://dx.doi.org/10.5498/wjp.119221