
















Copyright: ©Author(s) 2026.
World J Psychiatry. Jul 19, 2026; 16(7): 118260
Published online Jul 19, 2026. doi: 10.5498/wjp.118260
Published online Jul 19, 2026. doi: 10.5498/wjp.118260
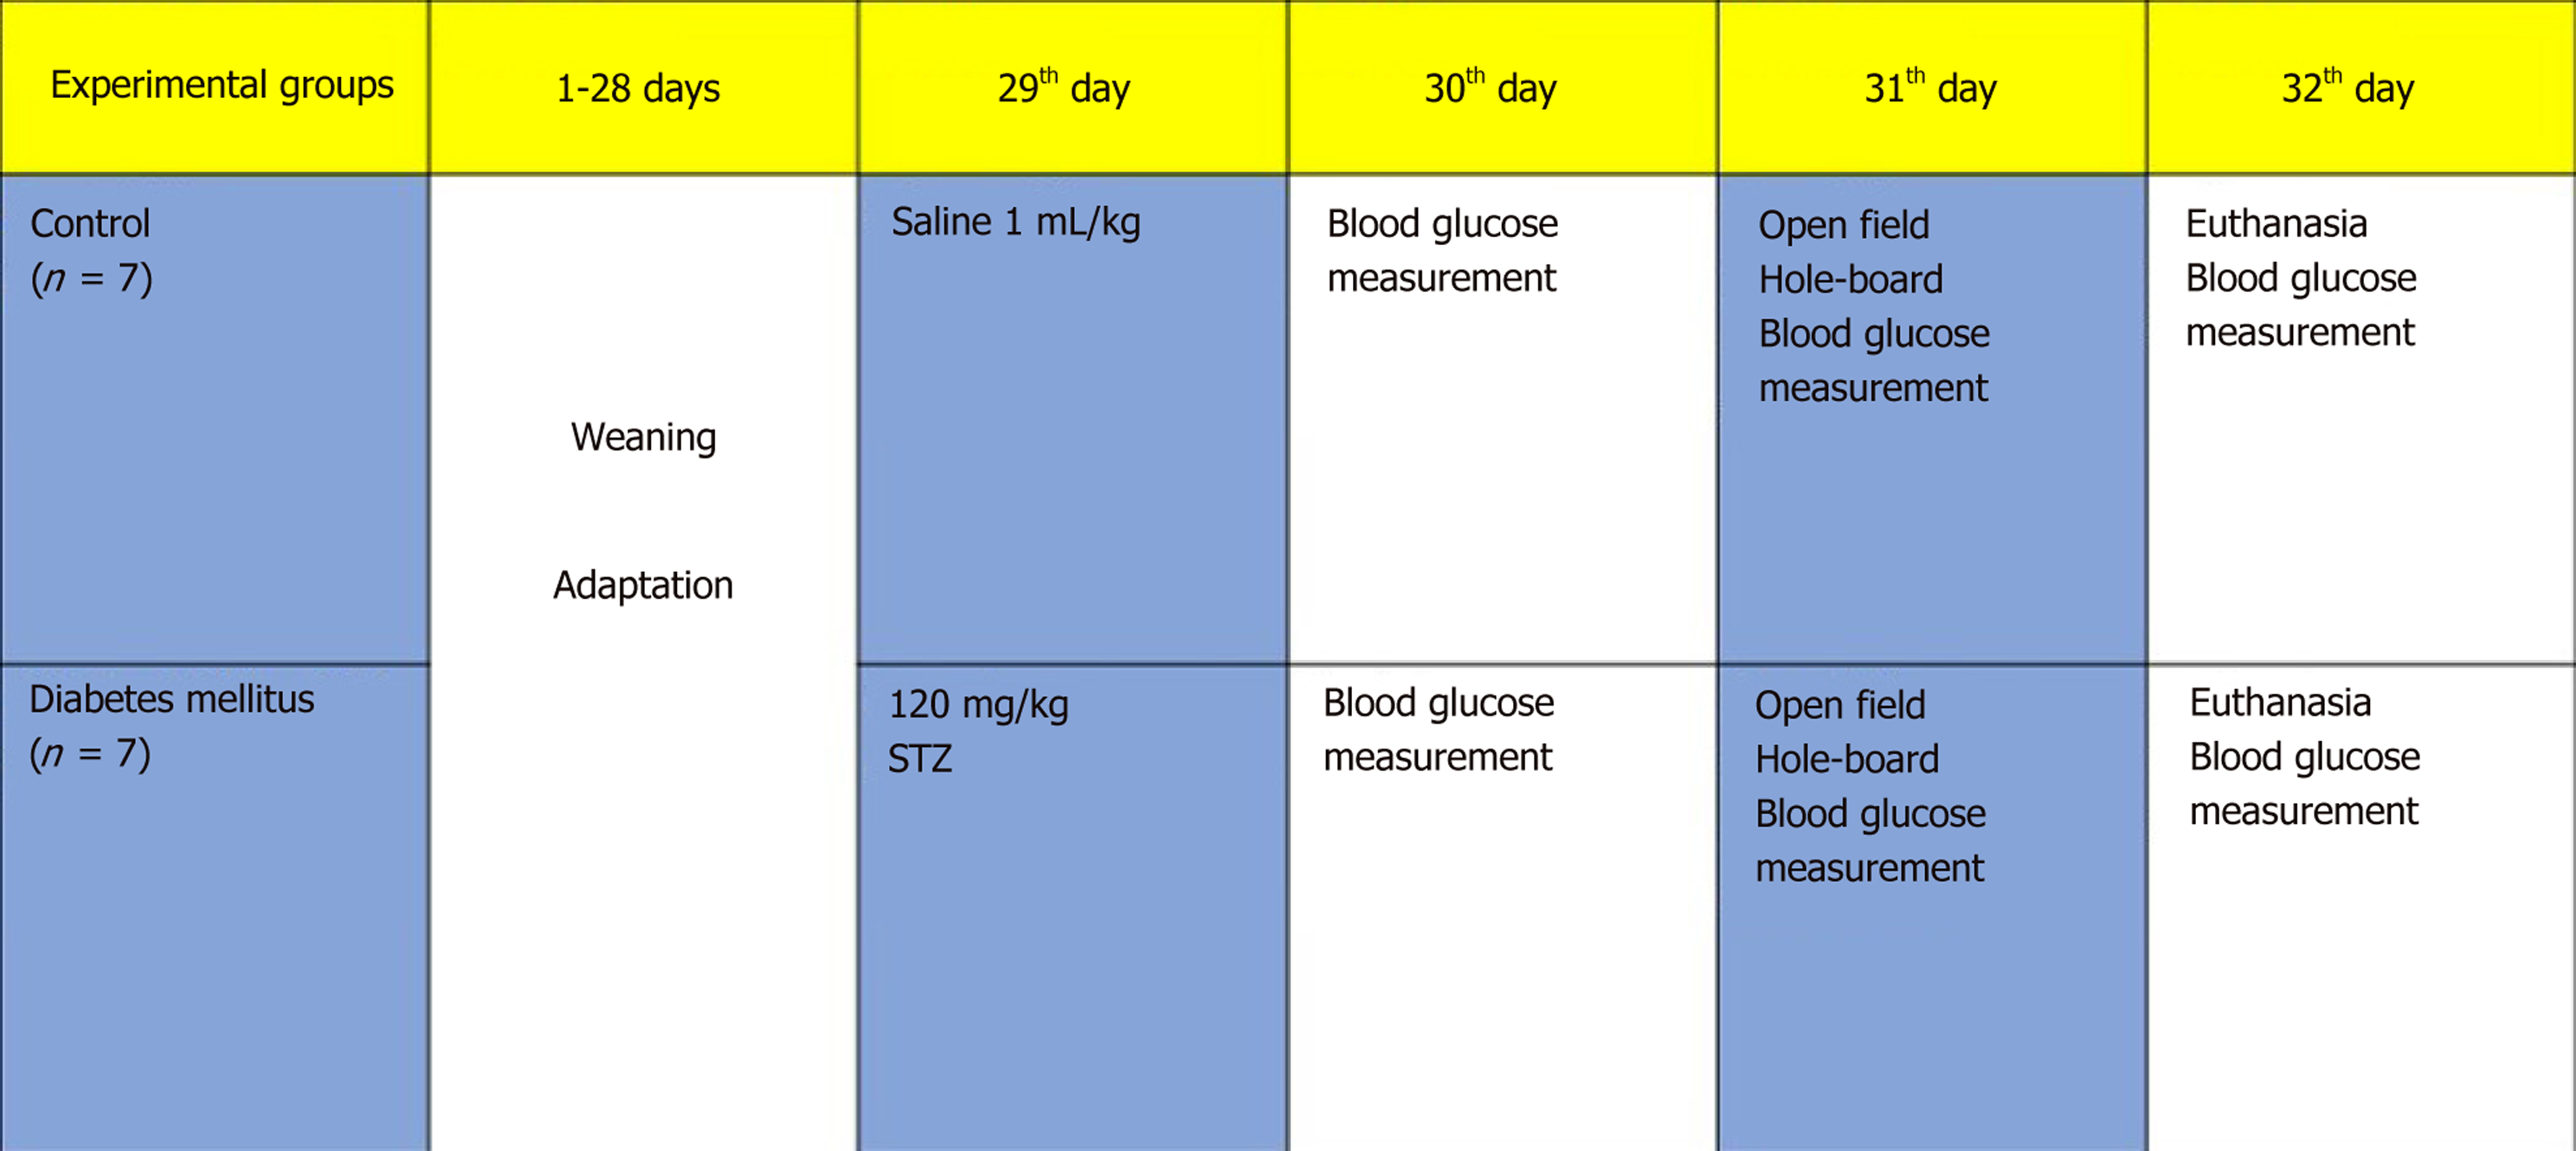
Figure 1 Experimental timeline.
STZ: Streptozotocin.
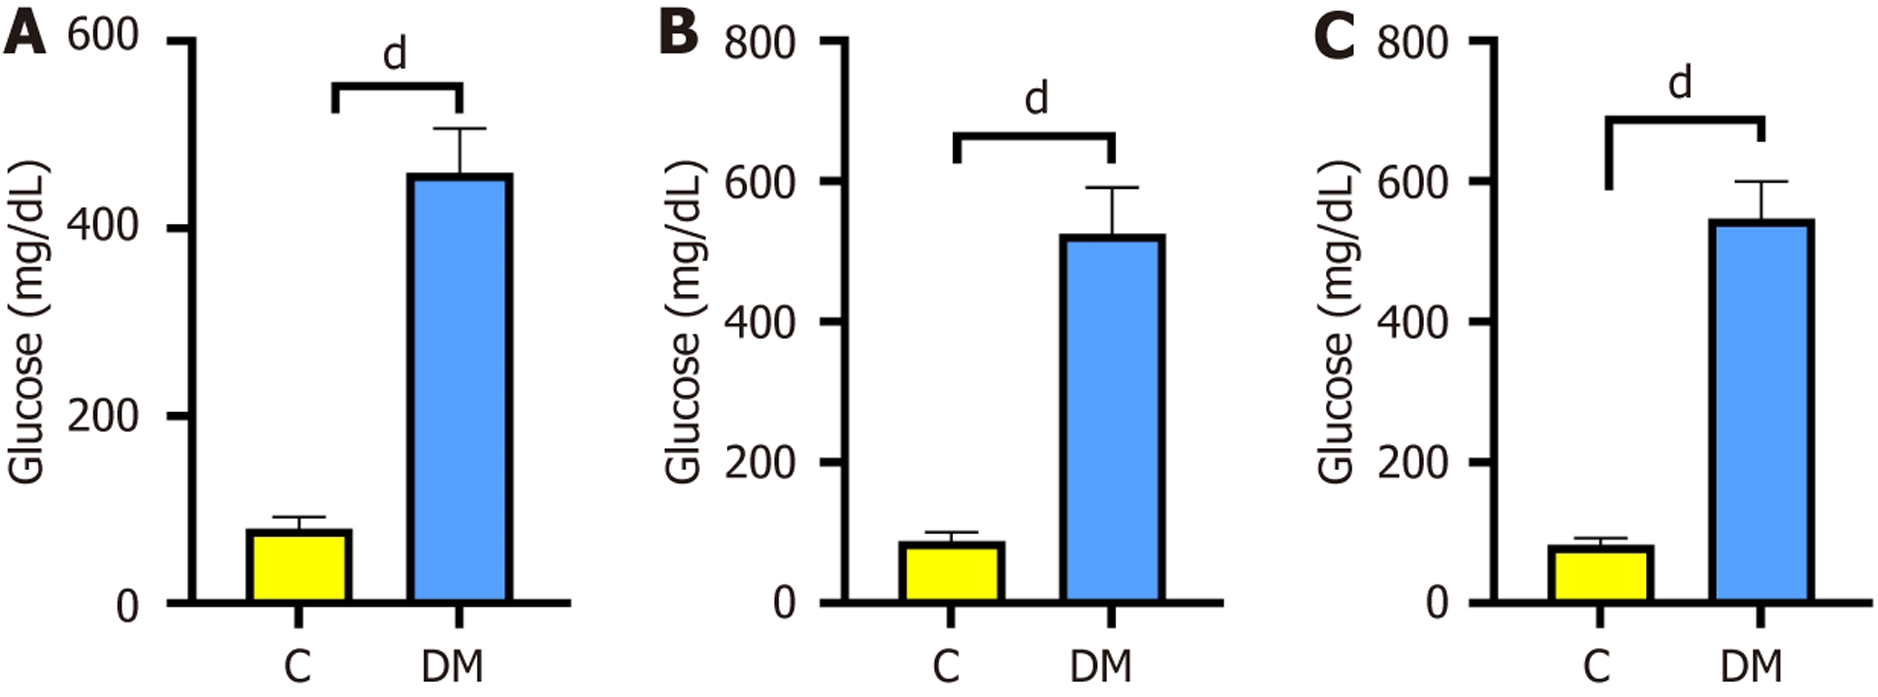
Figure 2 Effect of streptozotocin on glucose level.
dP < 0.0001 vs control group. A: First measurement; B: Blood glucose level on the day of the behavioral experiments; C: Blood glucose during the terminal stage was analyzed. C: Control; DM: Diabetes mellitus.
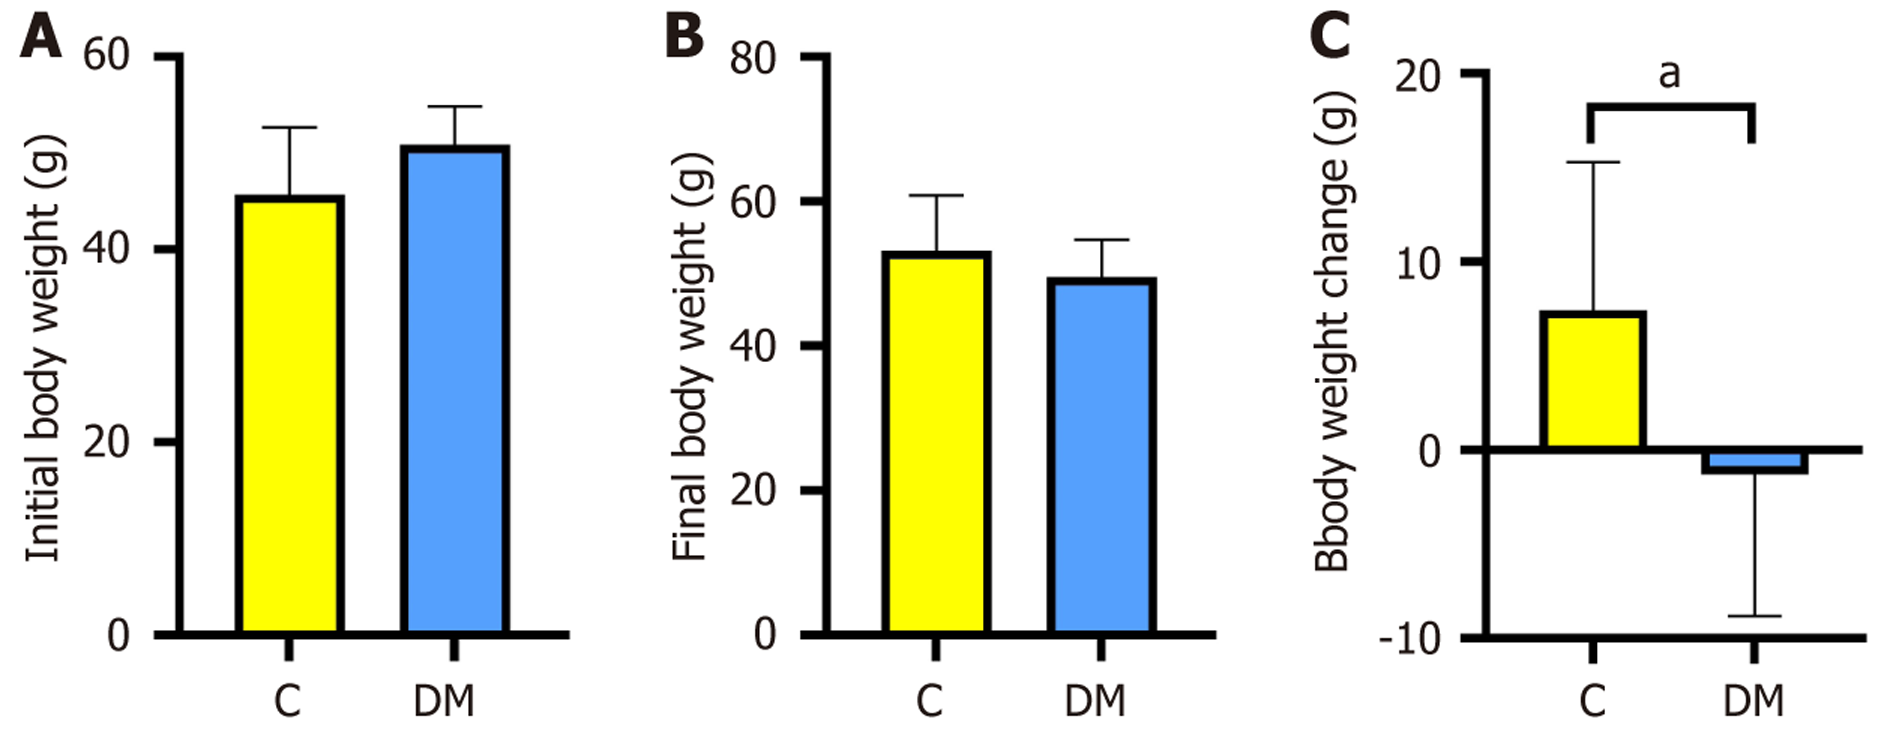
Figure 3 Effect of streptozotocin on body weight.
aP < 0.05 vs control group. A: Initial body weight B: Final body weight; C: Body weight change. C: Control; DM: Diabetes mellitus.
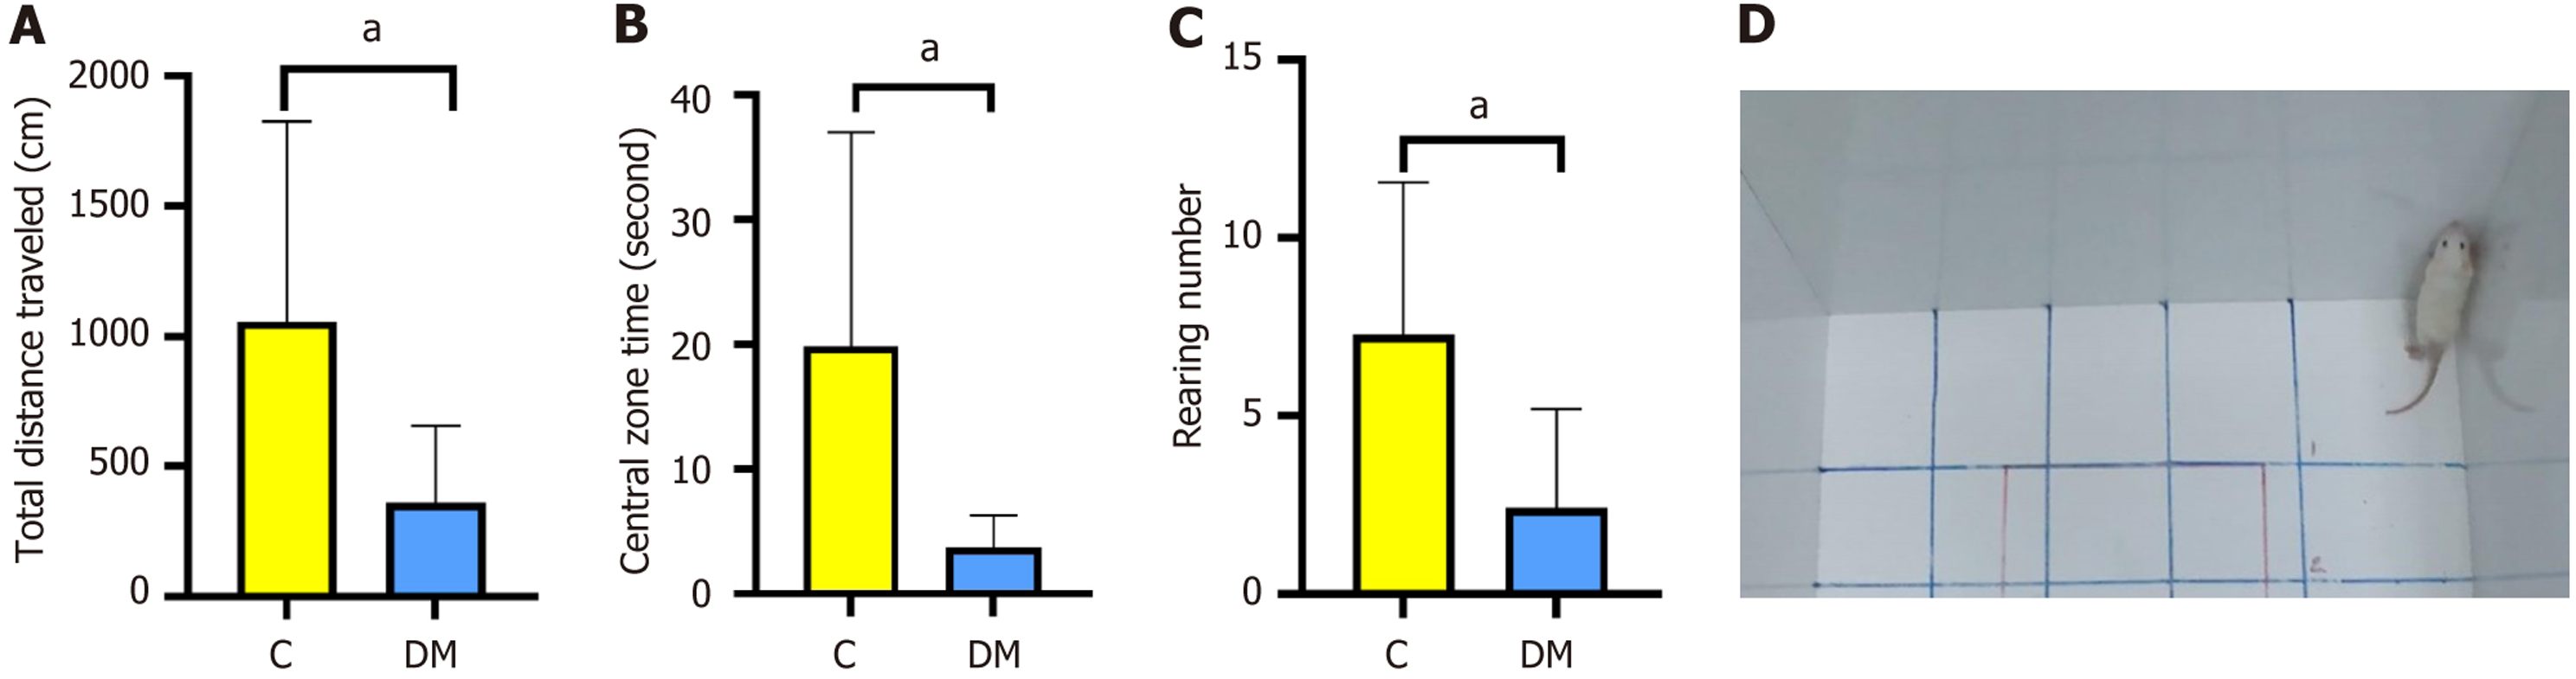
Figure 4 Behaviors in the open-field test.
aP < 0.05 vs control group. A: Total distance traveled; B: Central zone time C: Rearing number; D: Open field test. C: Control; DM: Diabetes mellitus.
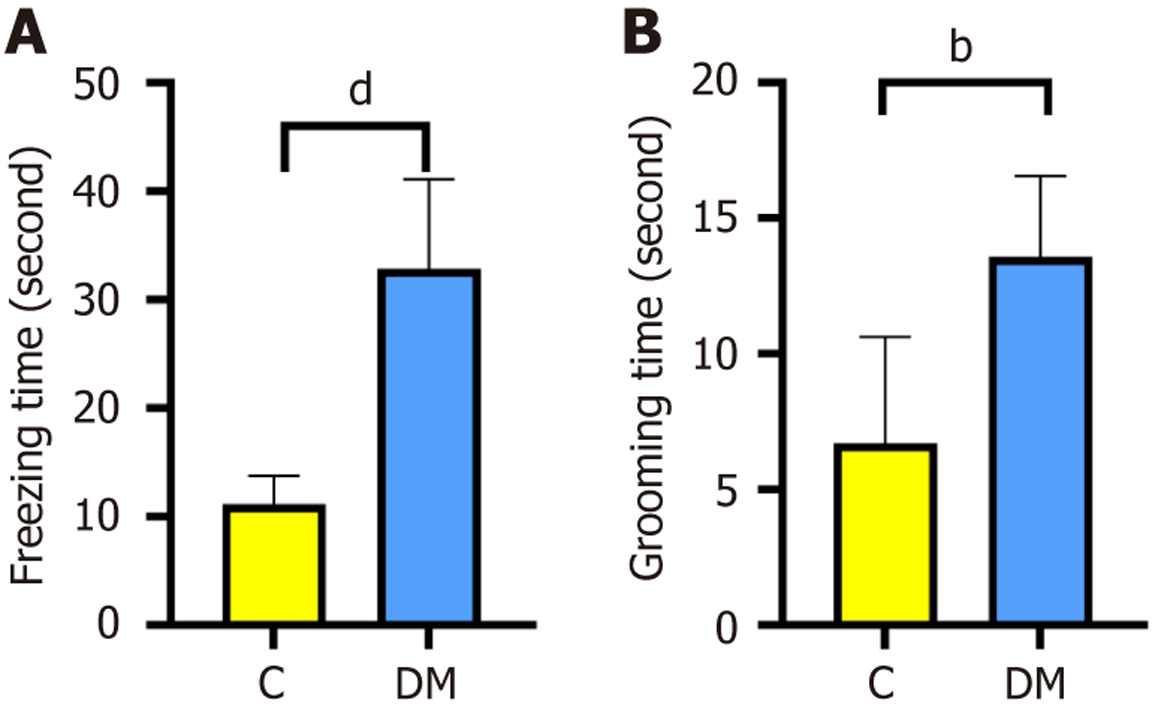
Figure 5 Freezing and grooming behaviors in the open-field test.
bP < 0.01 vs control group; dP < 0.0001 vs control group. A: Freezing time; B: Grooming time. C: Control; DM: Diabetes mellitus.
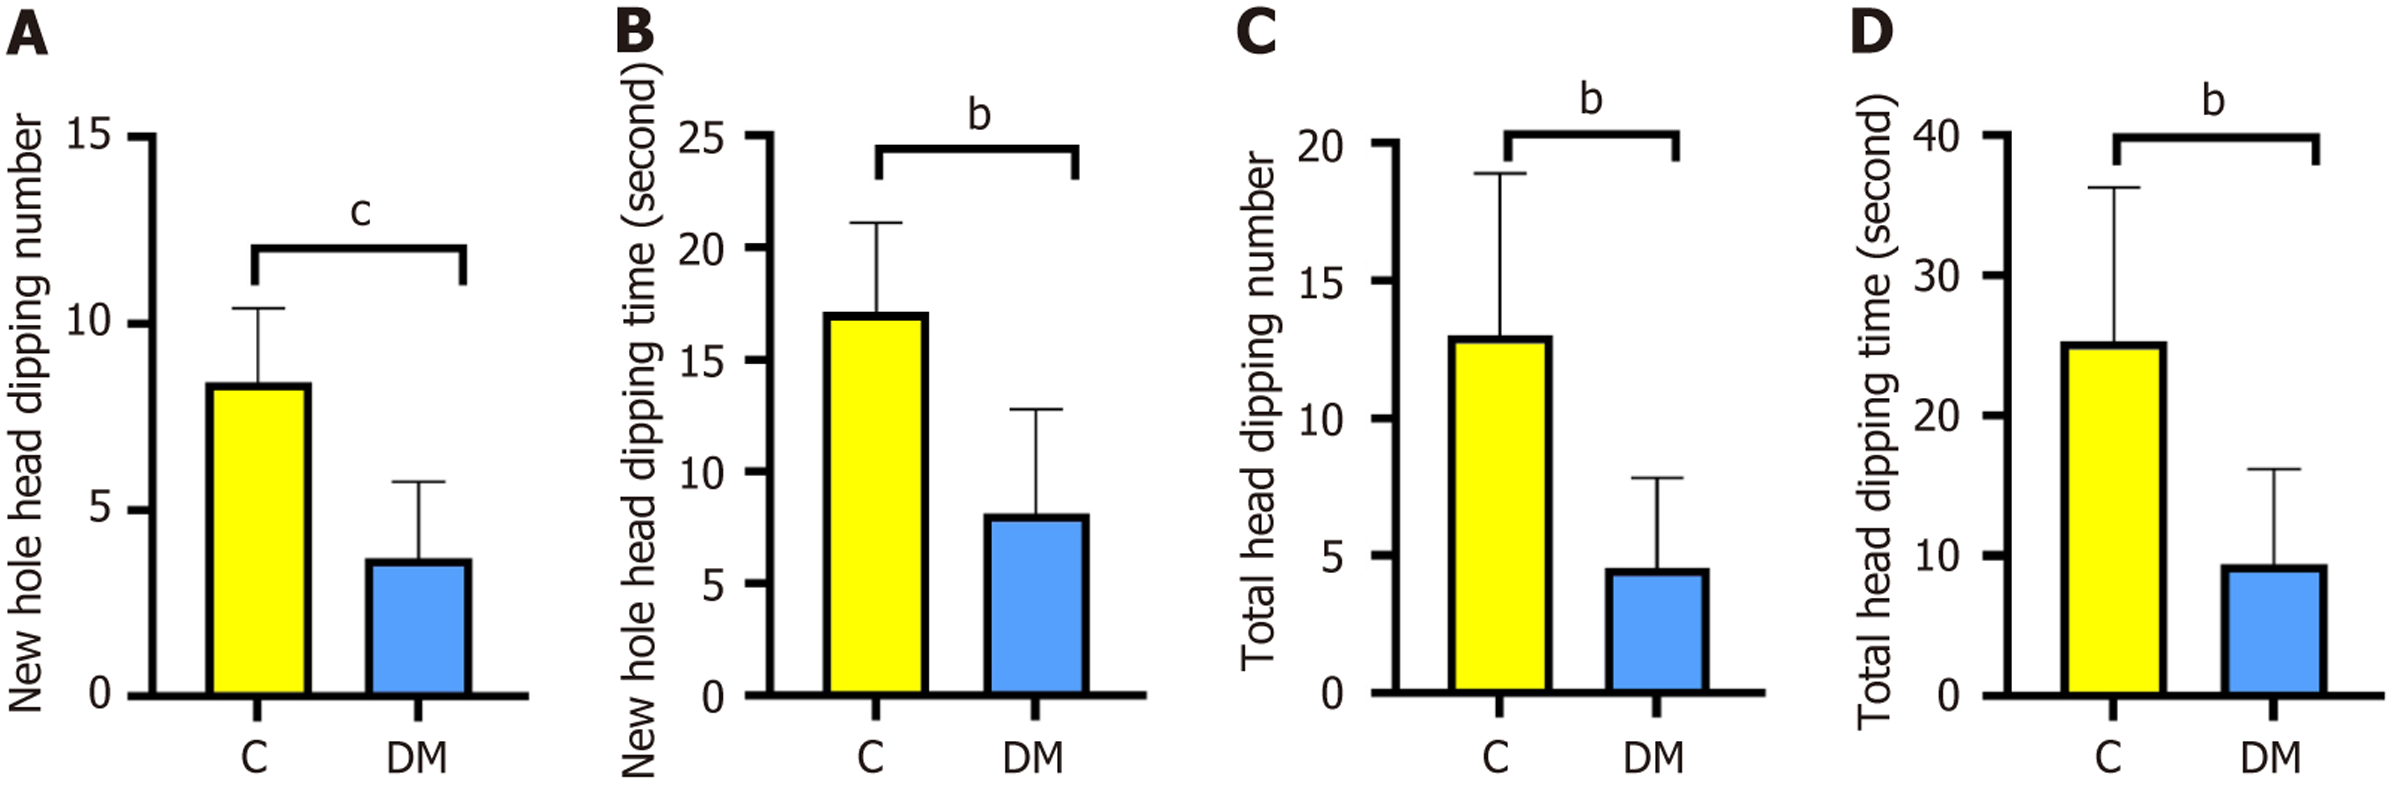
Figure 6 Behaviors in the hole board test.
bP < 0.01 vs control group; cP < 0.001 vs control group. A: New hole head dipping number; B: New hole head dipping time; C: Total Head dipping number; D: Total head dipping time. C: Control; DM: Diabetes mellitus.
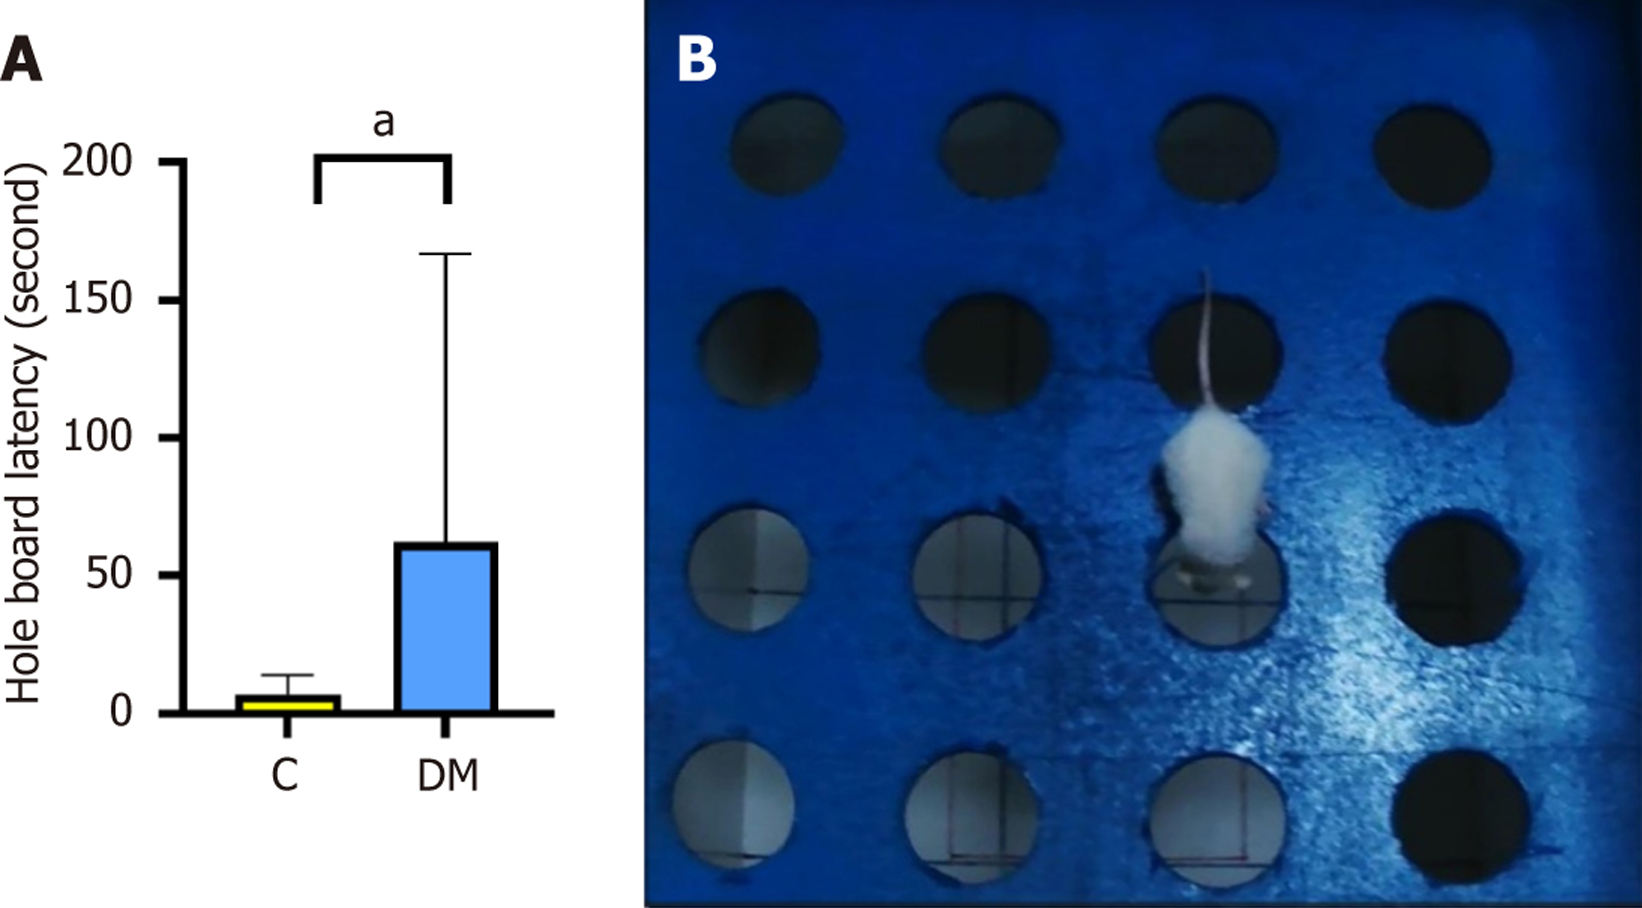
Figure 7 Hole board latency and head dipping behavior in the hole board test.
aP < 0.05 vs control group. A: Hole board latency; B: Head dipping behavior. C: Control; DM: Diabetes mellitus.
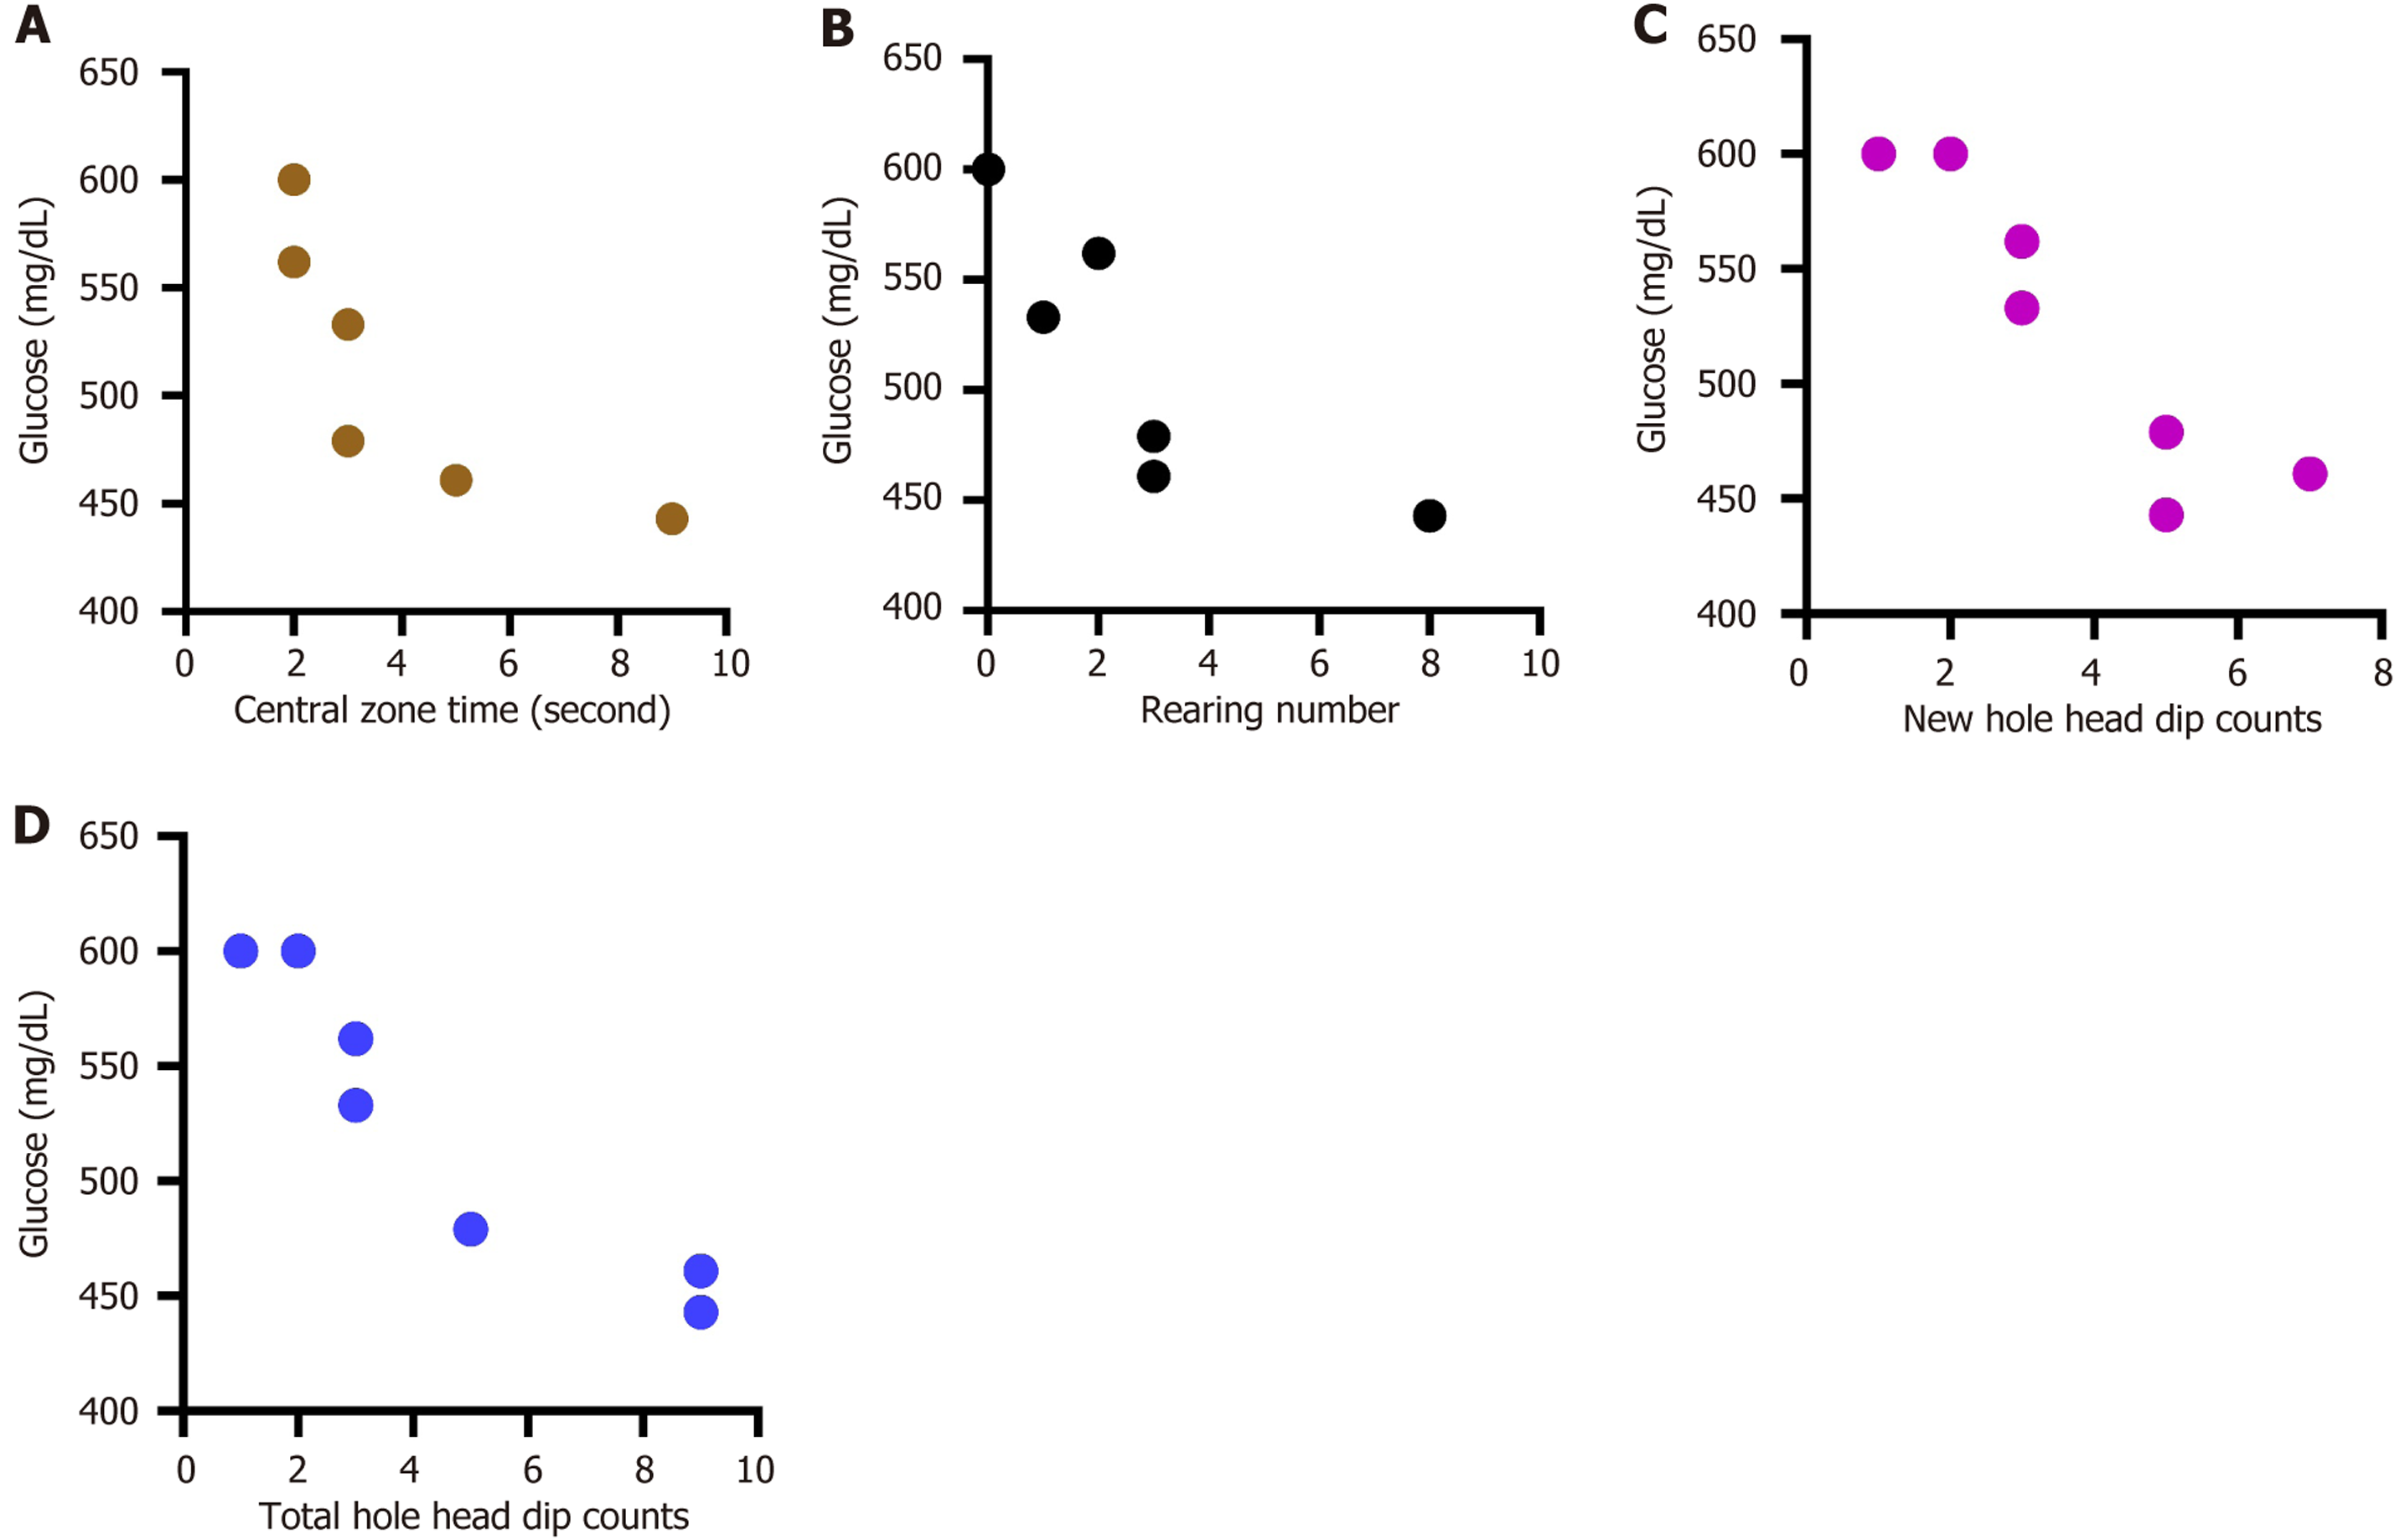
Figure 8 The correlation results.
A: The correlation between central zone time and glucose (r = -0.80, P = 0.0289); B: The correlation between rearing and glucose (r = -0.84, P = 0.0174); C: The correlation between new hole head dipping number and glucose (r = -0.91, P = 0.0038); D: The correlation between total hole head dip counts and glucose) (r = -0.93, P = 0.0018).
- Citation: Özcanlı Çay Ö, Çalışkan H. Anxiety-like behaviors increased in juvenile rats in the streptozotocin-induced diabetes model during the early stage. World J Psychiatry 2026; 16(7): 118260
- URL: https://www.wjgnet.com/2220-3206/full/v16/i7/118260.htm
- DOI: https://dx.doi.org/10.5498/wjp.118260