Copyright
©The Author(s) 2025.
World J Psychiatry. Sep 19, 2025; 15(9): 109611
Published online Sep 19, 2025. doi: 10.5498/wjp.v15.i9.109611
Published online Sep 19, 2025. doi: 10.5498/wjp.v15.i9.109611
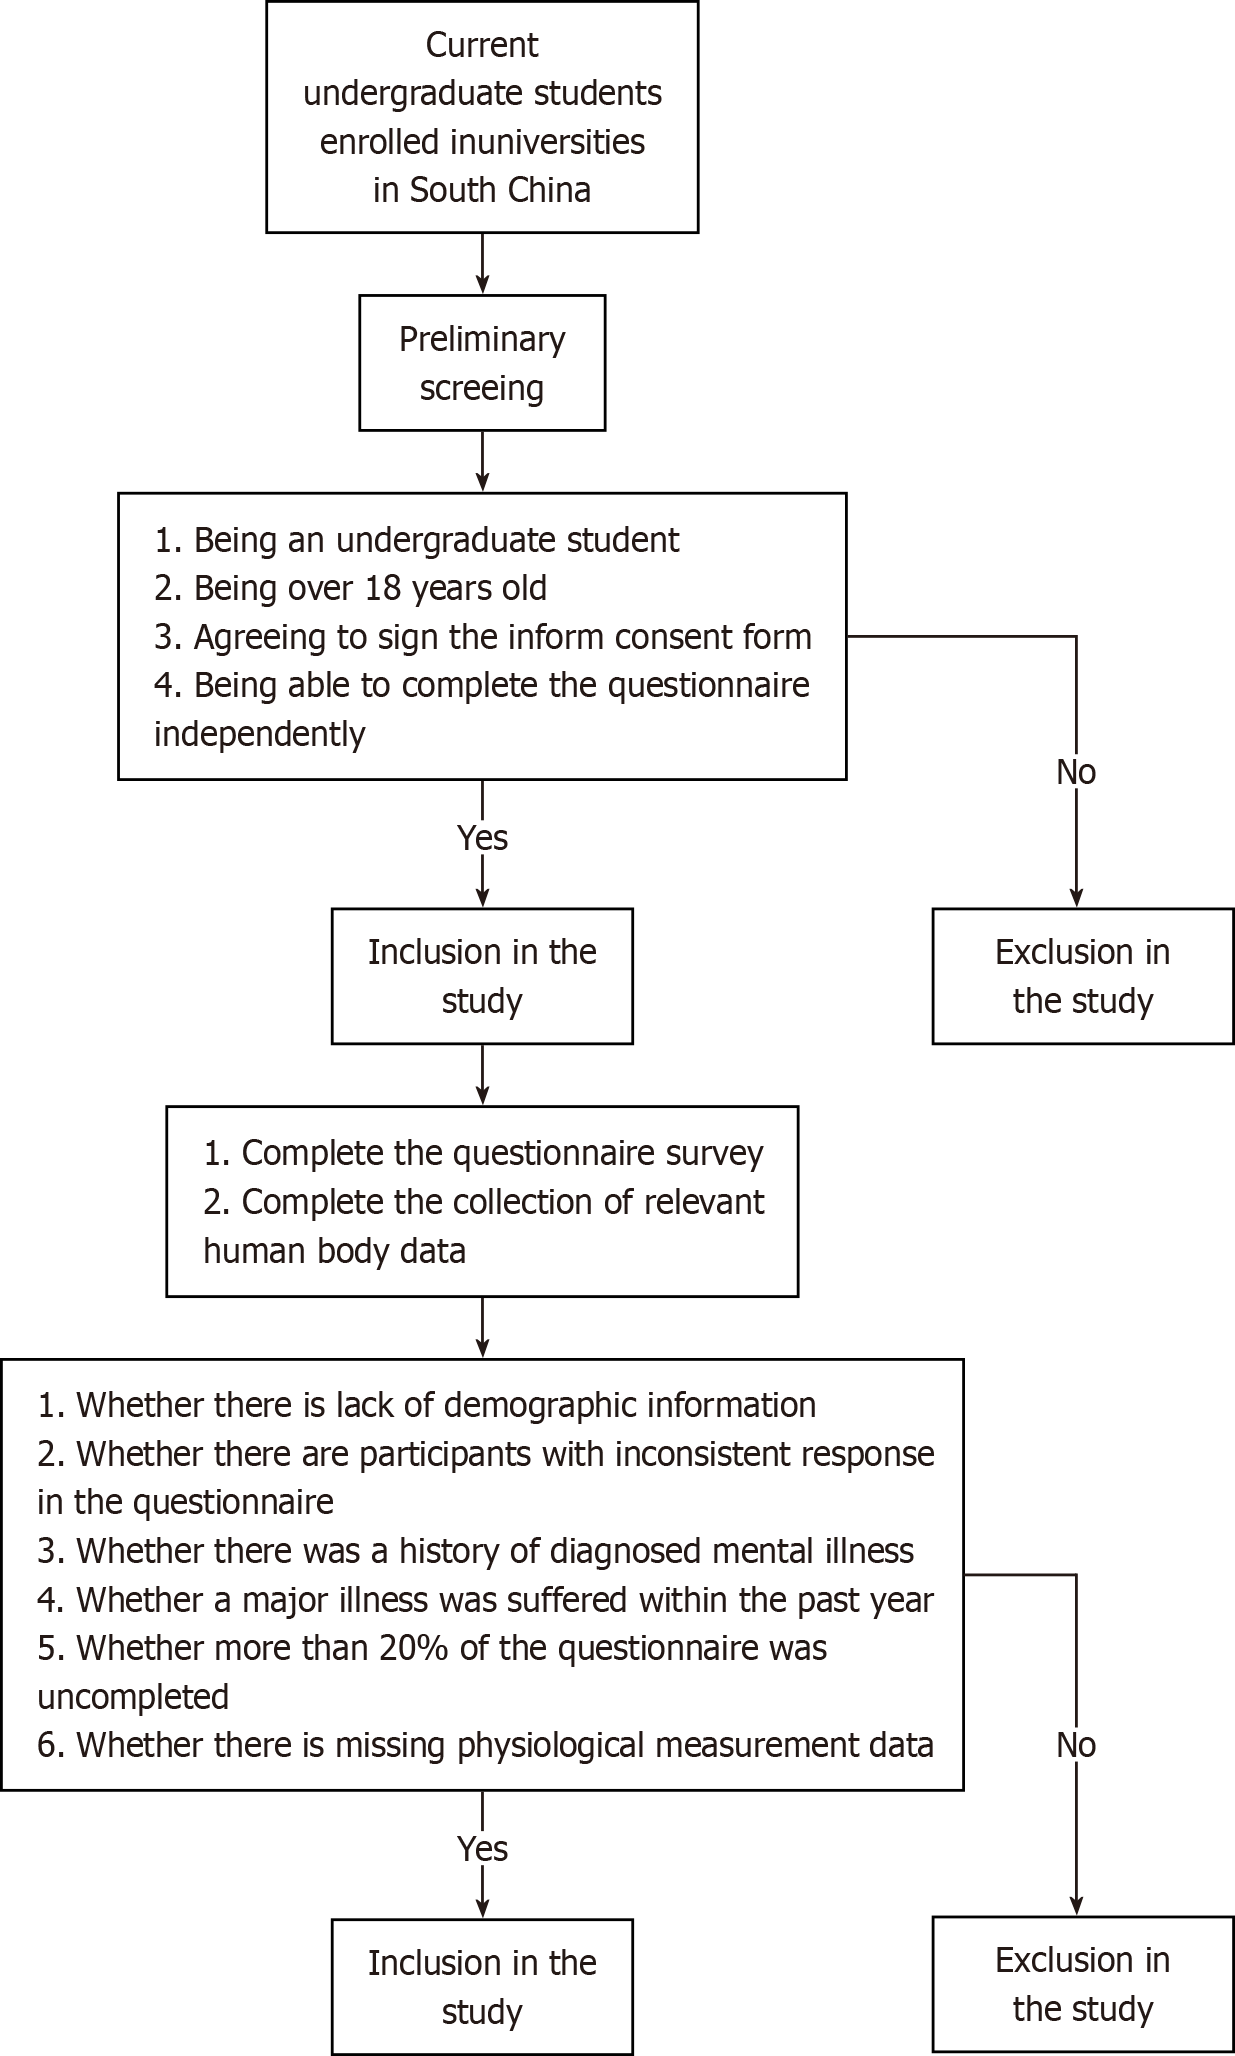
Figure 1 Participant enrollment and exclusion flowchart.
Flowchart depicting the participant selection process, including inclusion criteria (South China undergraduates, ≥ 18 years, informed consent) and exclusion criteria (missing data, severe medical/mental conditions). A total of 1286 valid participants were included.
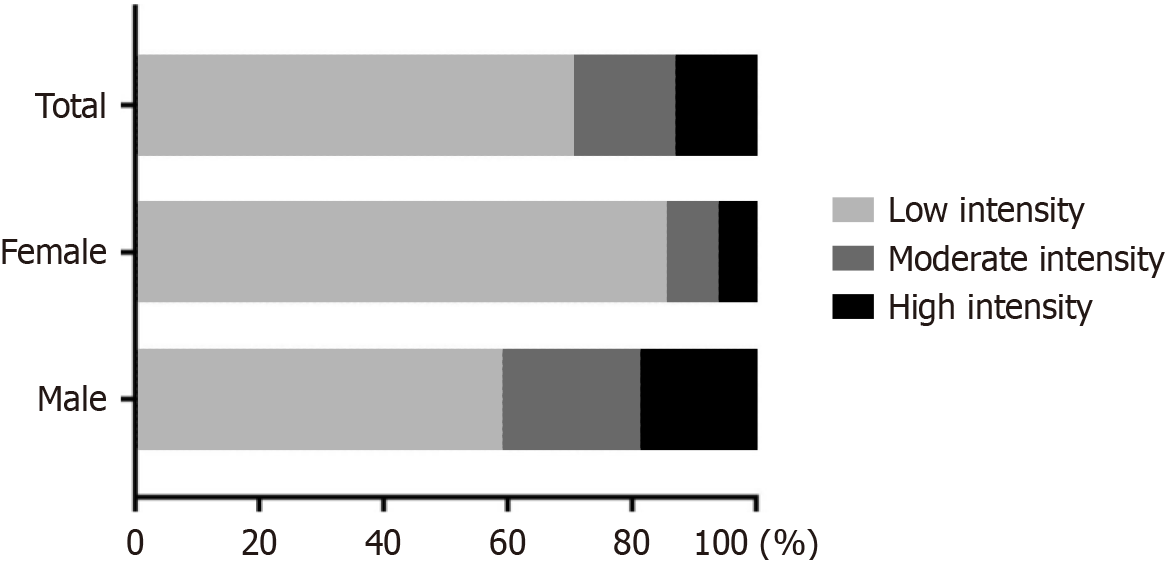
Figure 2 Percentage of Chinese college students by physical activity level.
Distribution of low-intensity, moderate-intensity, and high-intensity physical activity levels among participants, stratified by gender. Data from the Physical Activity Scale-3 show 71.2% of students engaged in low-intensity activity, with a higher proportion of females in this category.
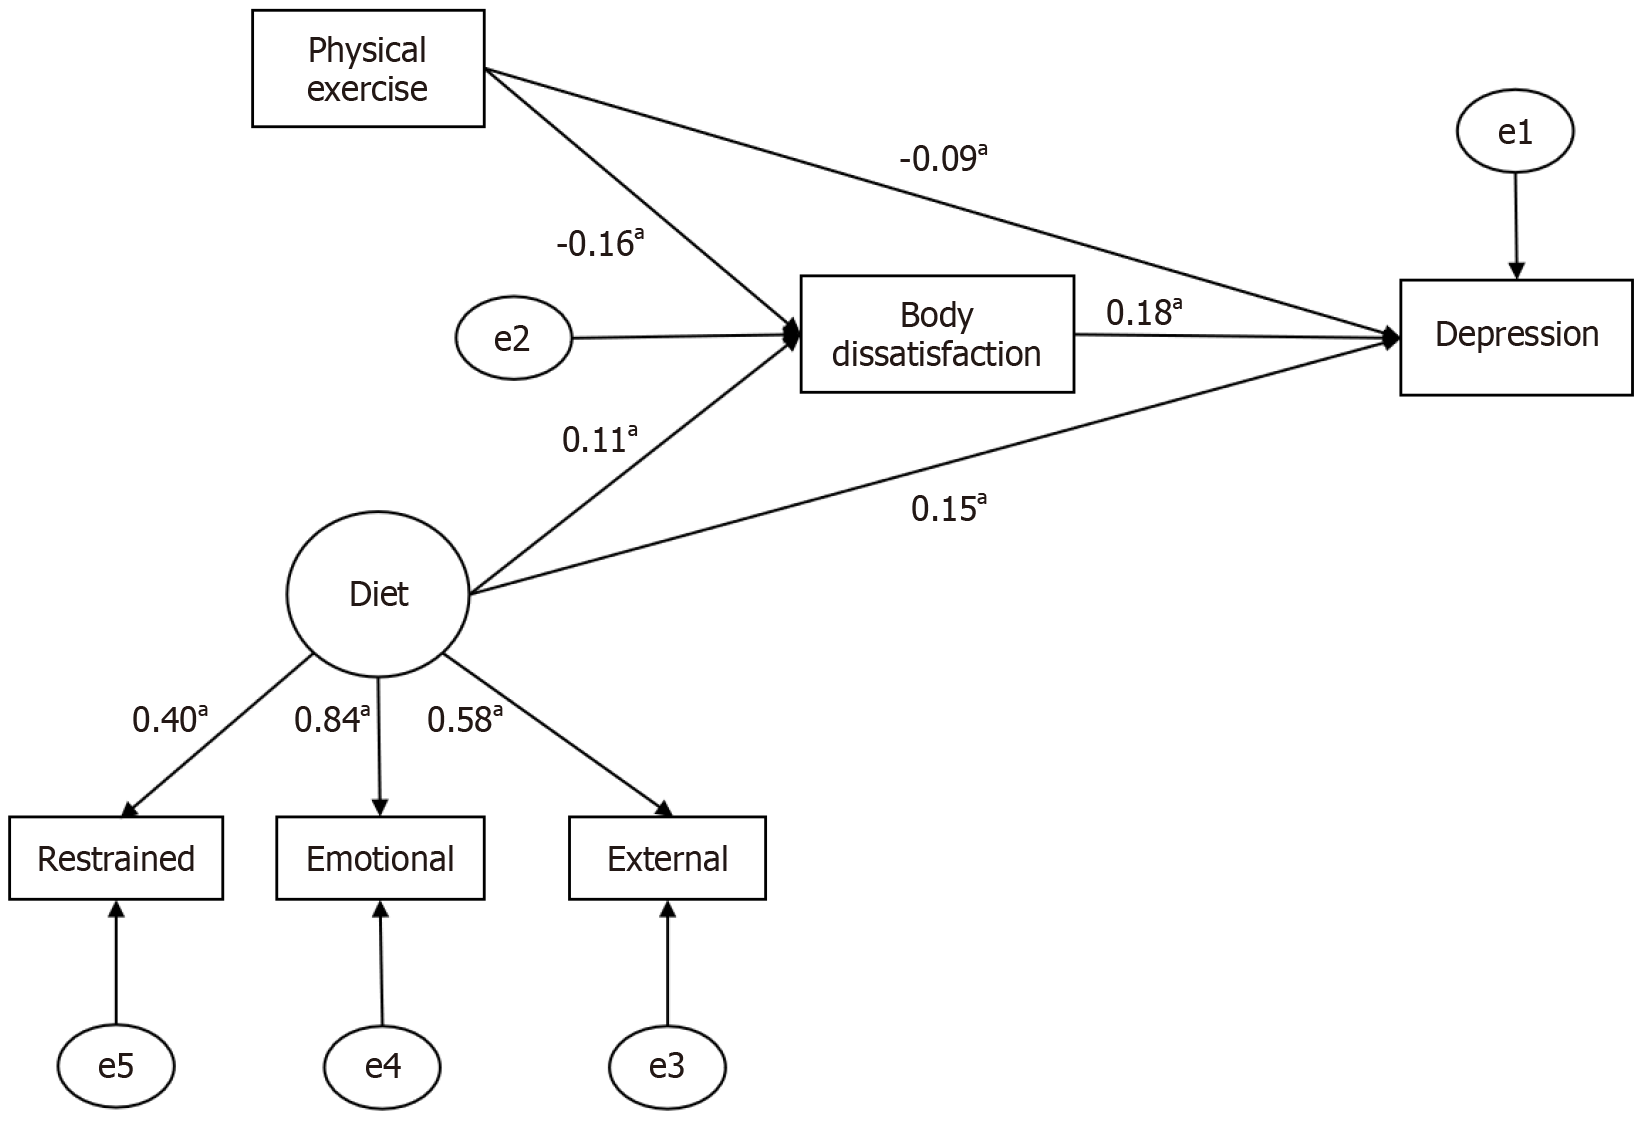
Figure 3 Hypothetical path model for relationships between study variables.
Standardized path coefficients from structural equation modeling. Circles represent latent variables (e.g., depression, body dissatisfaction), and rectangles denote observed variables (e.g., physical activity, diet). Arrows indicate standardized β coefficients and significance (aP < 0.001), illustrating direct/indirect effects of physical activity and diet on depression via body dissatisfaction.
Figure 4 Mediation model.
A: Mediation model of diet, body dissatisfaction, and depression. Path diagram of direct and indirect effects of dietary behavior on depression. Standardized coefficients show diet influences depression through body dissatisfaction (indirect effect β = 0.0137) and a direct pathway (β = 0.0492), with mediation accounting for 218% of the total effect (bP < 0.01); B: Mediation model of physical activity, body dissatisfaction, and depression. Path diagram of direct and indirect effects of physical activity on depression. Standardized coefficients show physical activity influences depression through body dissatisfaction (indirect effect β = -0.0164) and a direct pathway (β = -0.0517), with mediation accounting for 241% of the total effect (cP < 0.01).
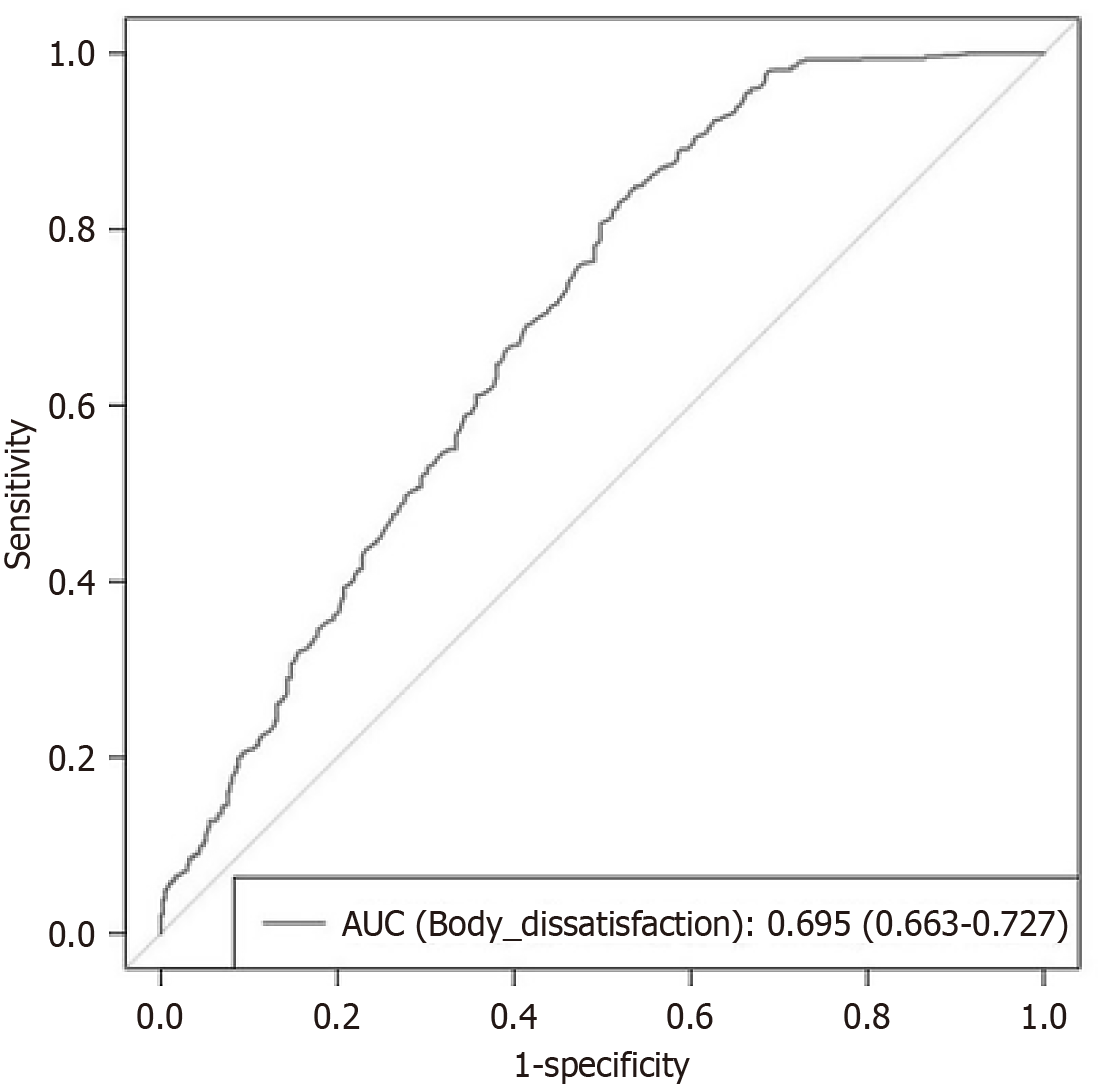
Figure 5 Receiver operating characteristic curve for body mass index difference predicting depression.
Receiver operating characteristic curve evaluating body dissatisfaction (body mass index difference) as a predictor of depression. The optimal cutoff value of 1.73 yields an area under the curve of 70.0%, with 84.6% sensitivity and 46.8% specificity (P < 0.001). AUC: Area under the curve.
- Citation: Cheng ZJ, Tao H, Huan HG, Wu CM, Wang Q, Hao M. College students' depression and body image: Unraveling the Link. World J Psychiatry 2025; 15(9): 109611
- URL: https://www.wjgnet.com/2220-3206/full/v15/i9/109611.htm
- DOI: https://dx.doi.org/10.5498/wjp.v15.i9.109611


