©The Author(s) 2025.
World J Psychiatry. May 19, 2025; 15(5): 102552
Published online May 19, 2025. doi: 10.5498/wjp.v15.i5.102552
Published online May 19, 2025. doi: 10.5498/wjp.v15.i5.102552
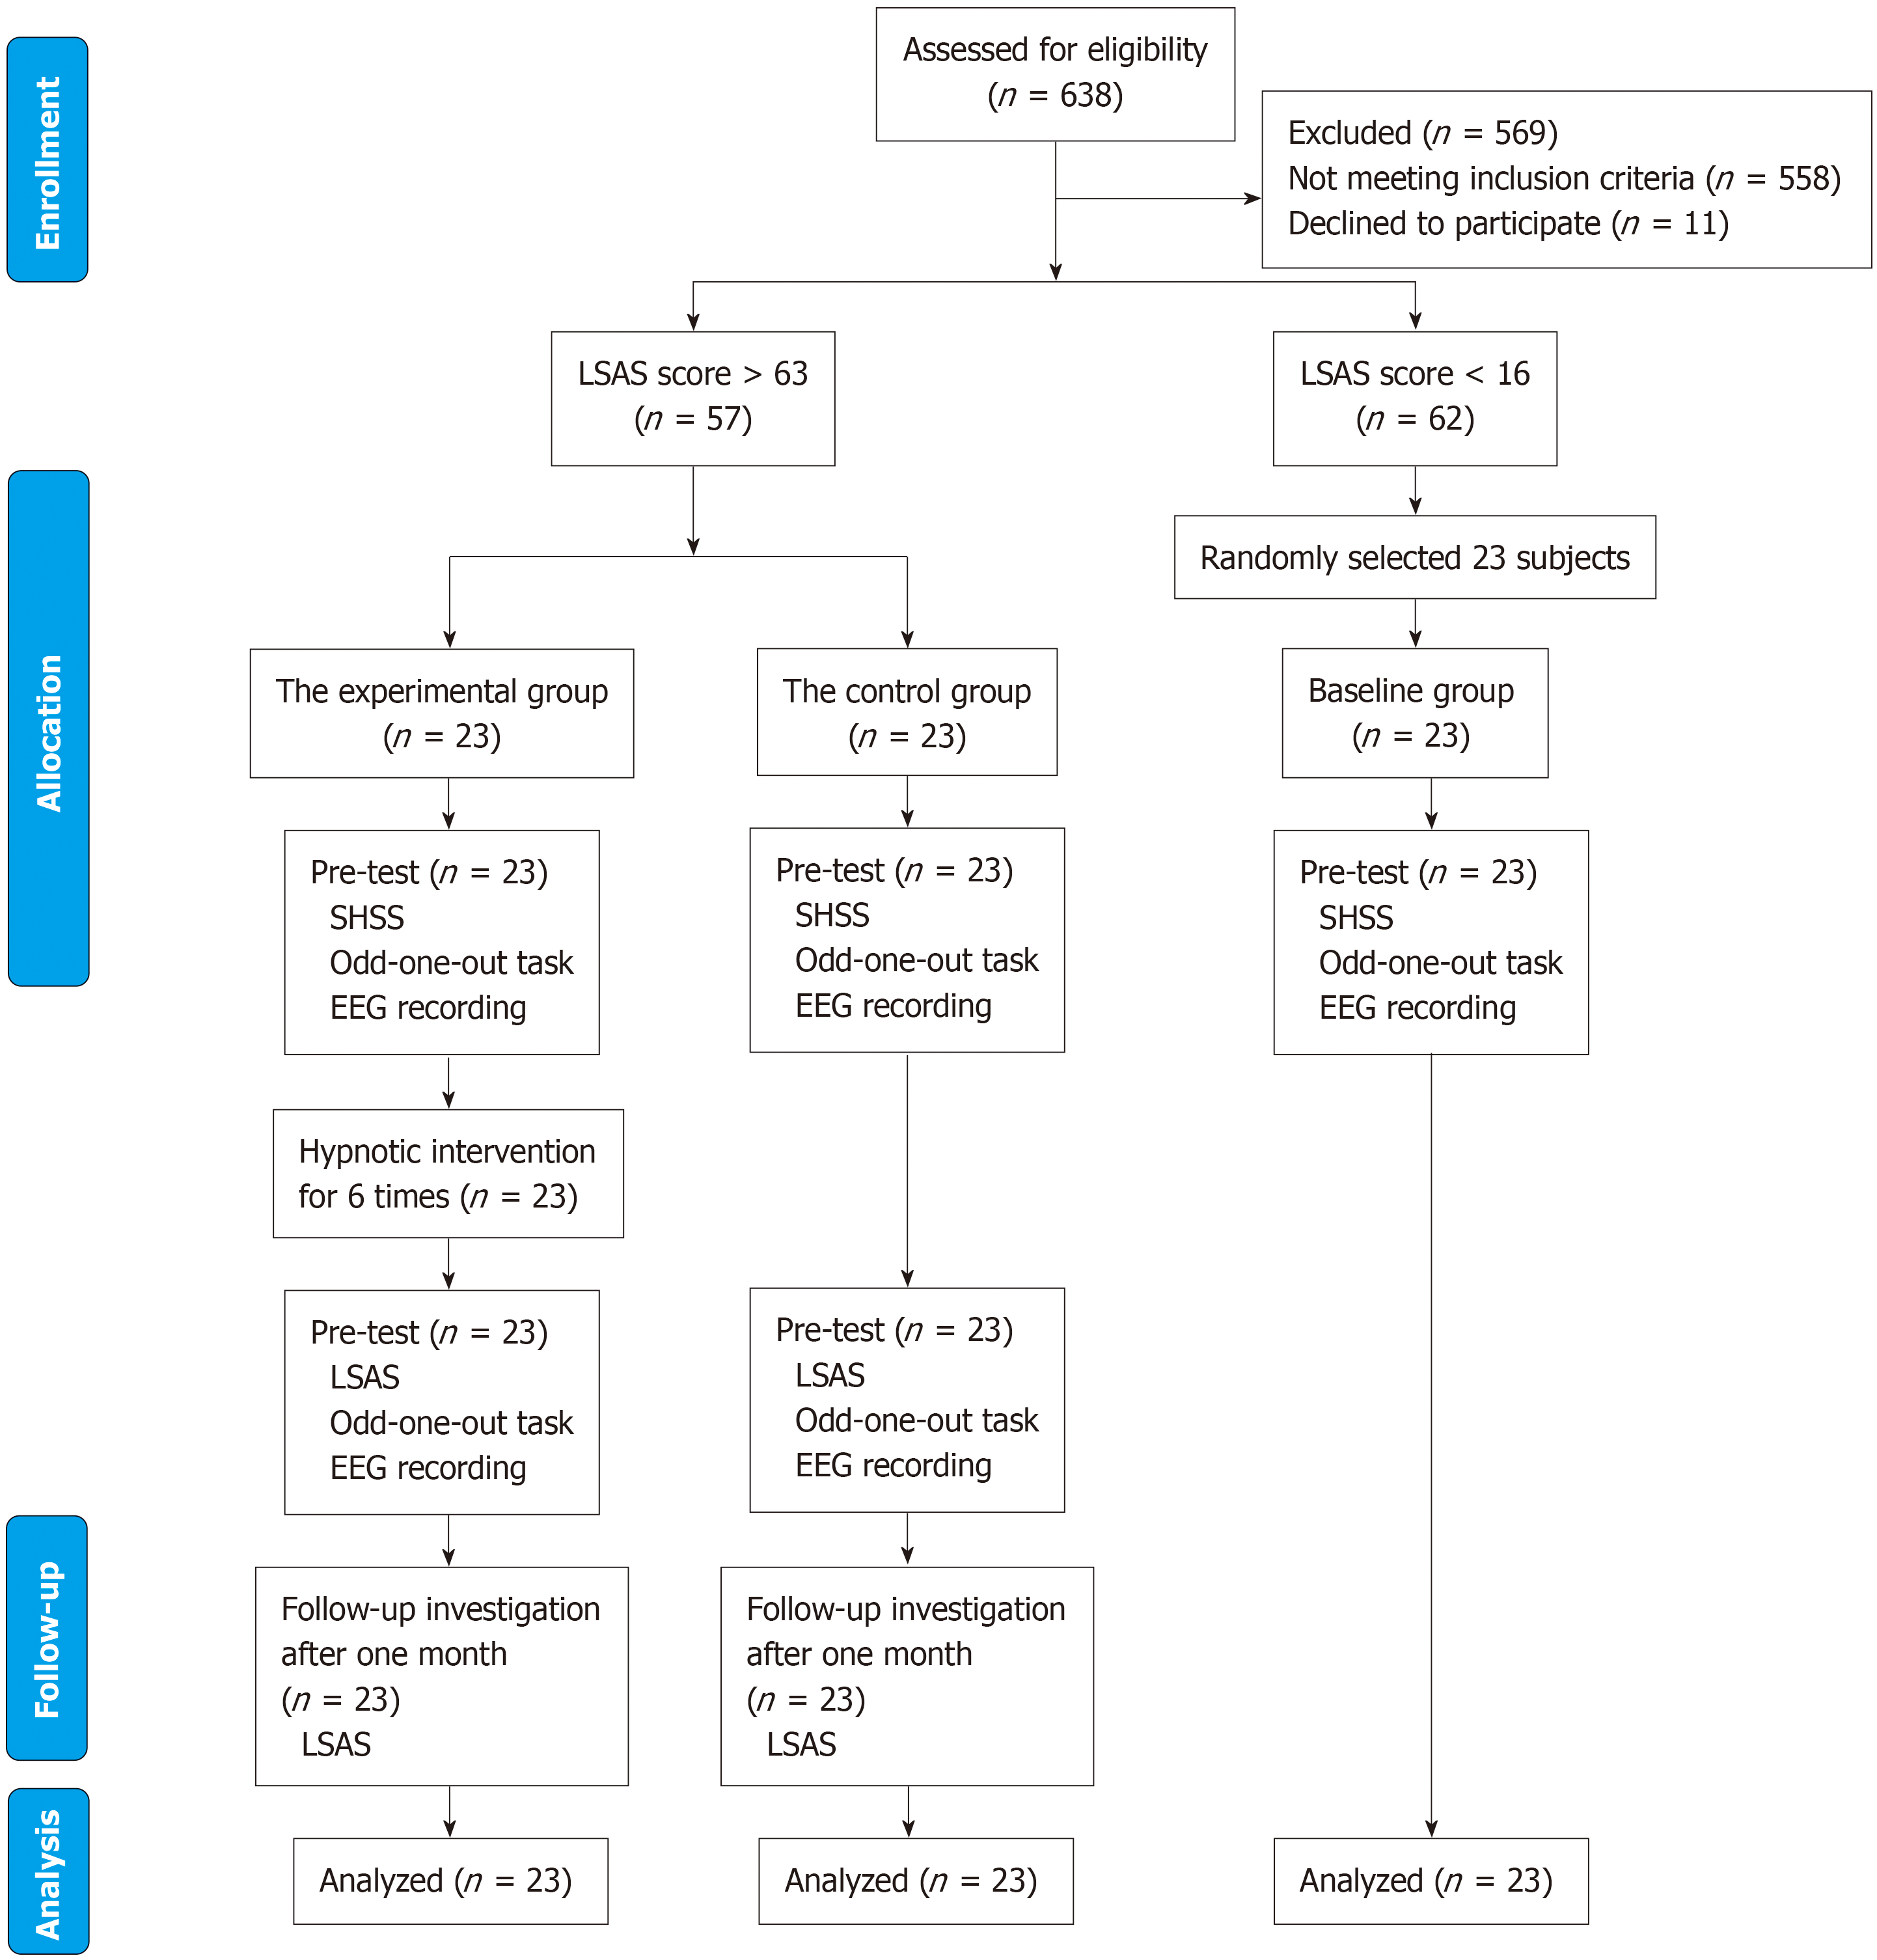
Figure 1 Flow chart of participant enrollment and study process.
LSAS: Liebowitz Social Anxiety Scale; SHSS: Stanford Hypnotic Susceptibility Scale.
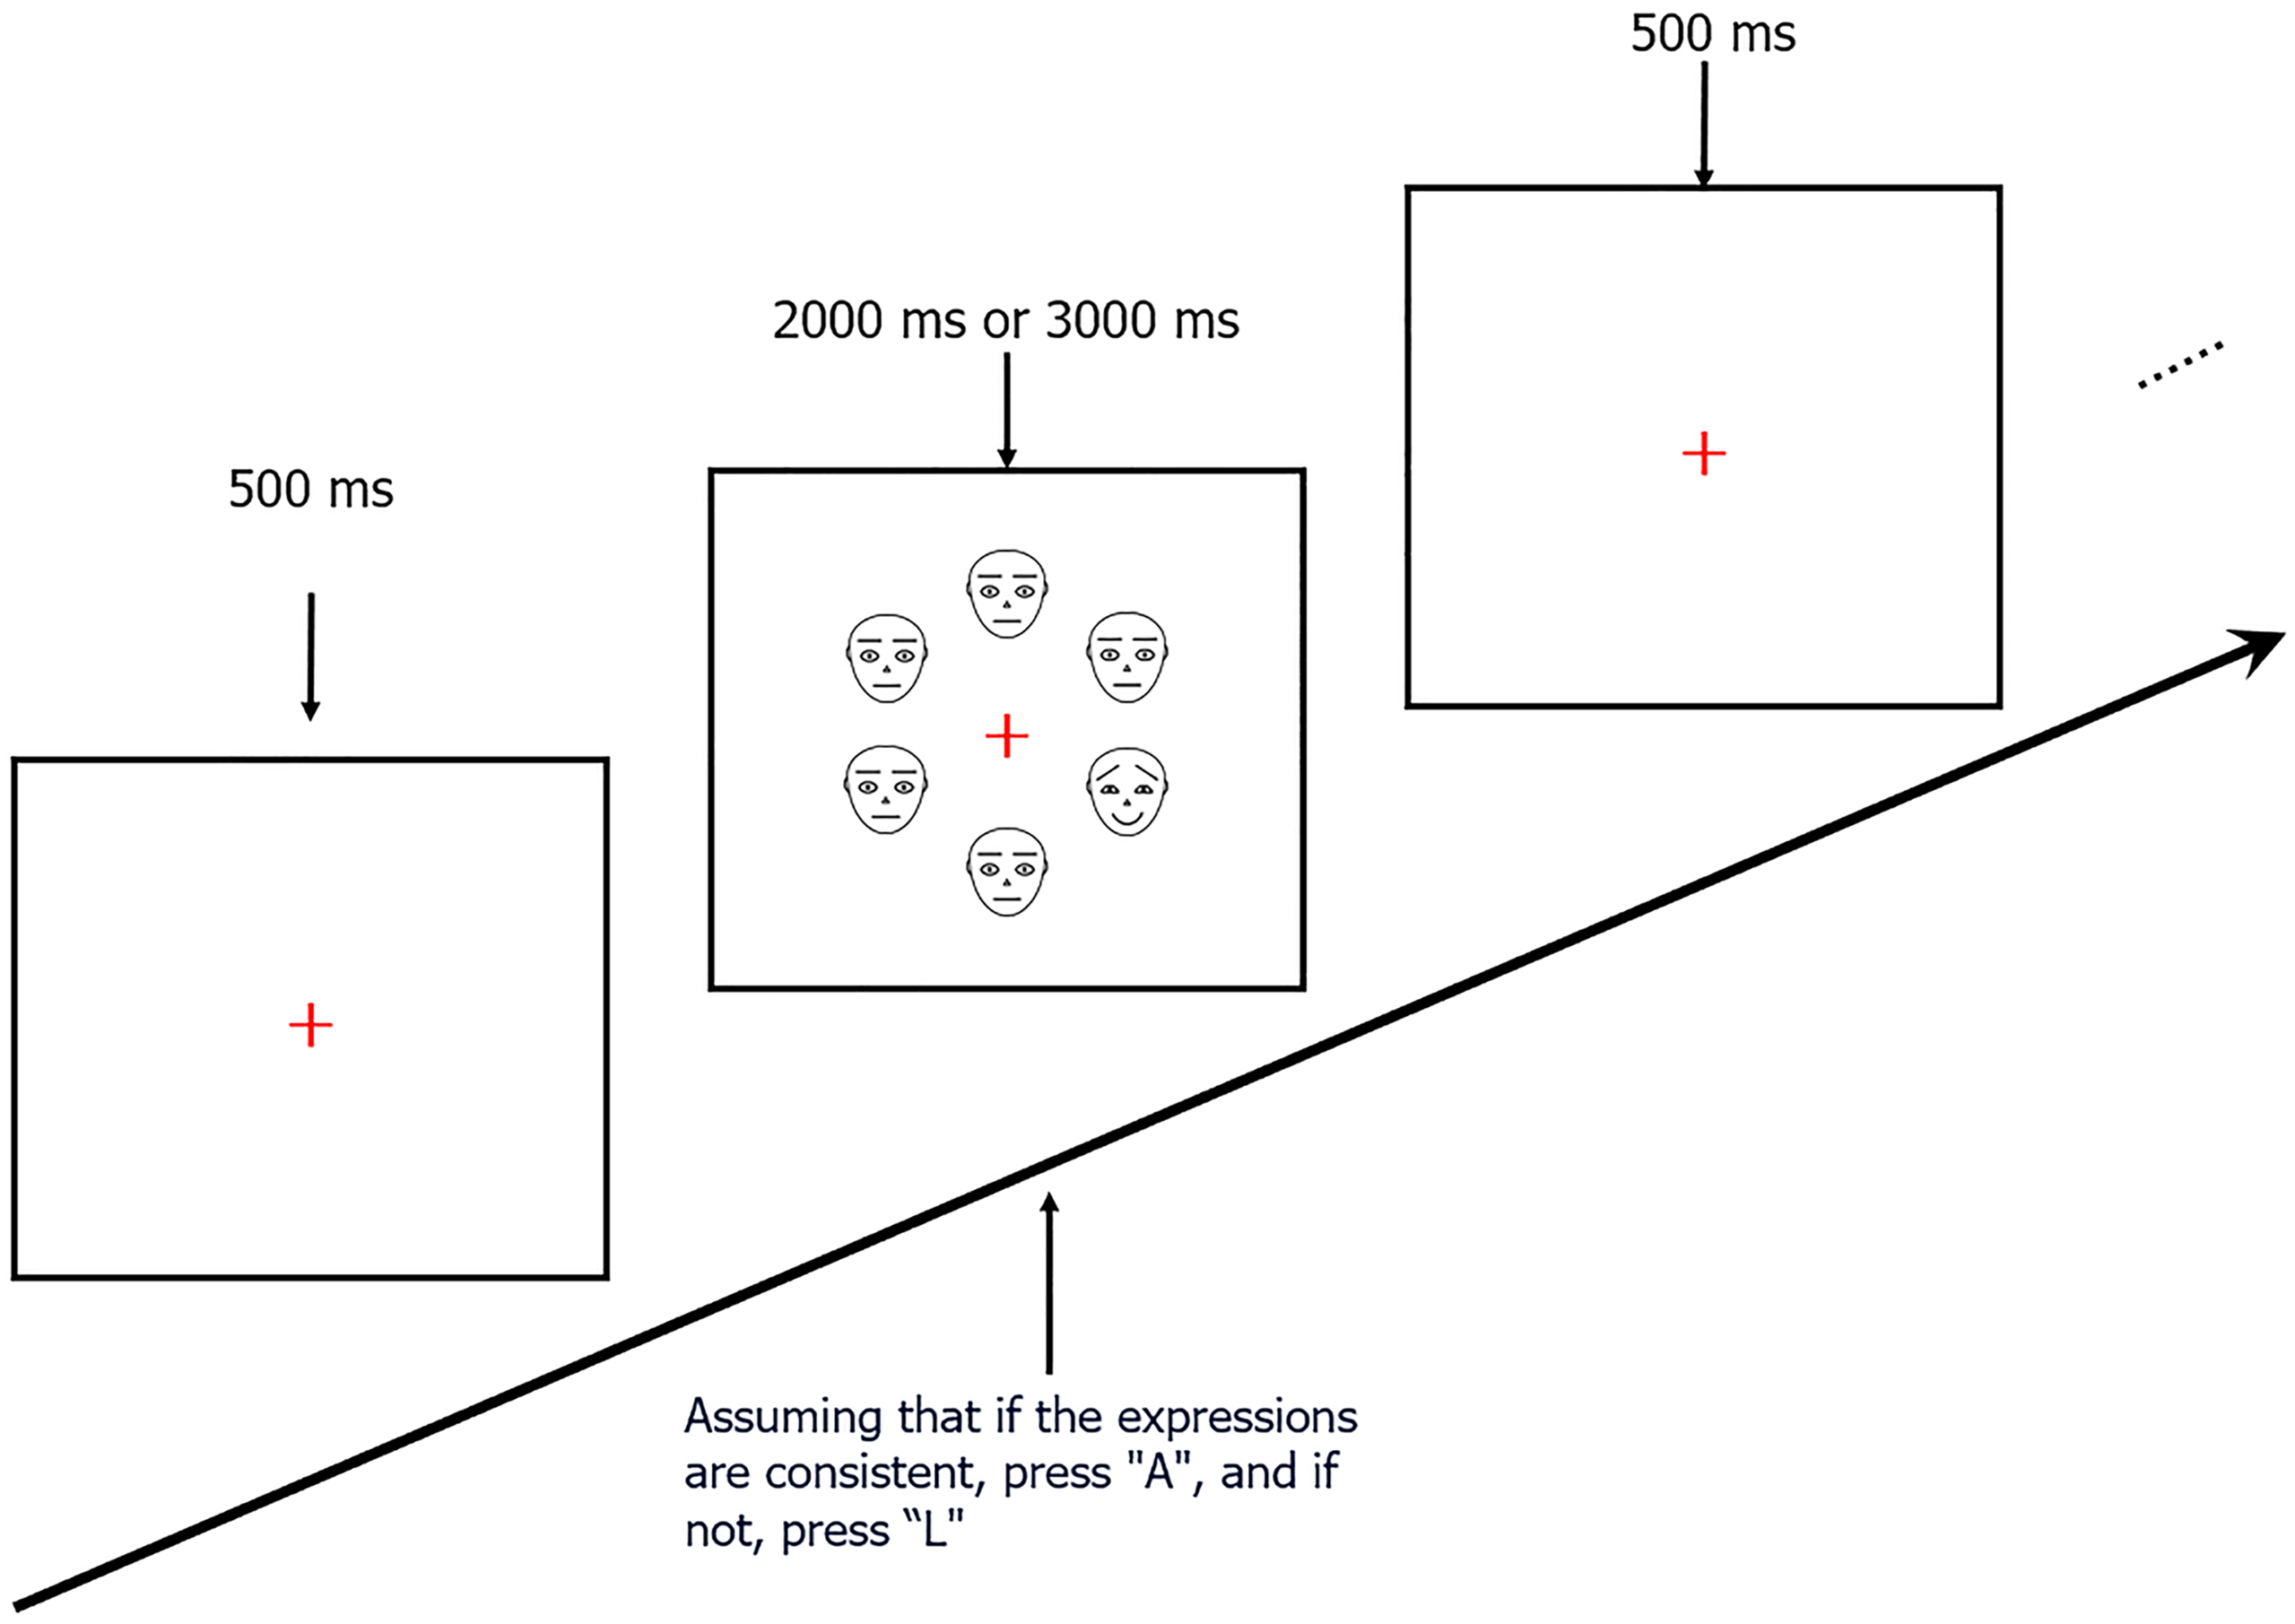
Figure 2 Schematic examples of trials used in each block.
ms: Milliseconds.
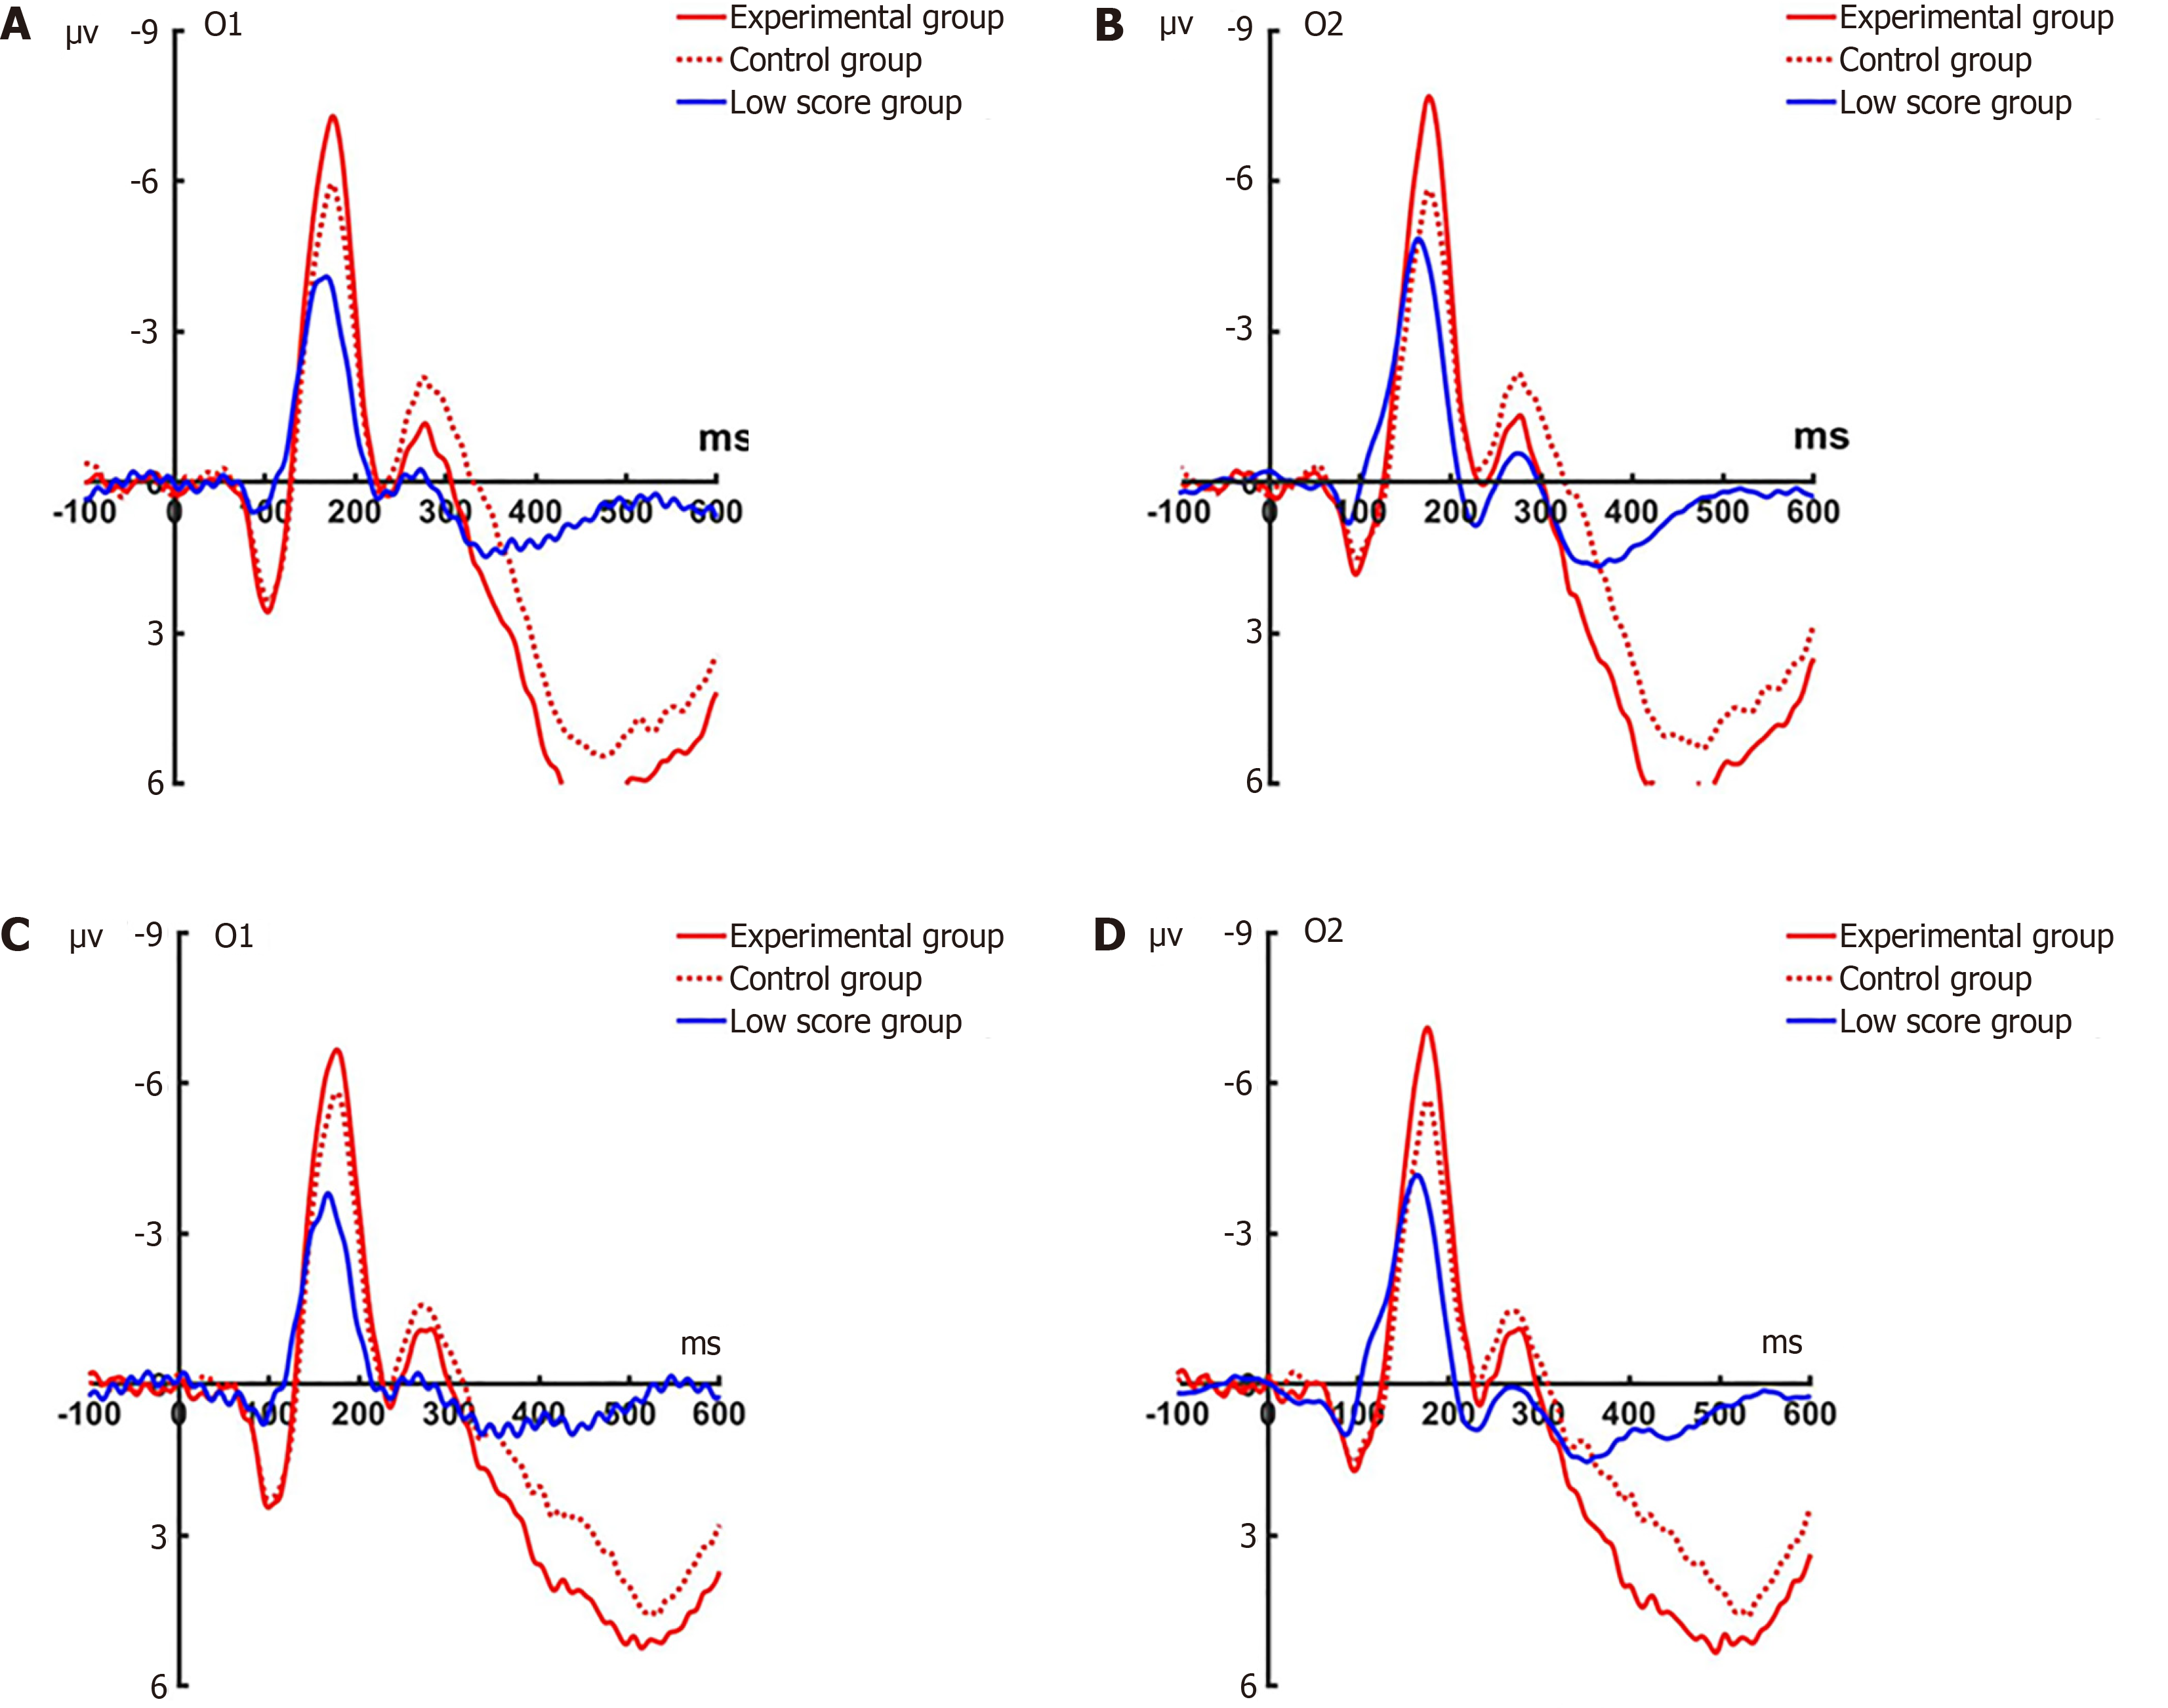
Figure 3 Pre-test P1 analyses conducted on O1 and O2 electrodes for the three groups under attention sensitivity conditions.
A: Grand average waveforms of the three groups at O1 for angry faces; B: Grand average waveforms of the three groups at O2 for angry faces; C: Grand average waveforms of the three groups at O1 for happy faces; D: Grand average waveforms of the three groups at O2 for happy faces. ms: Milliseconds.
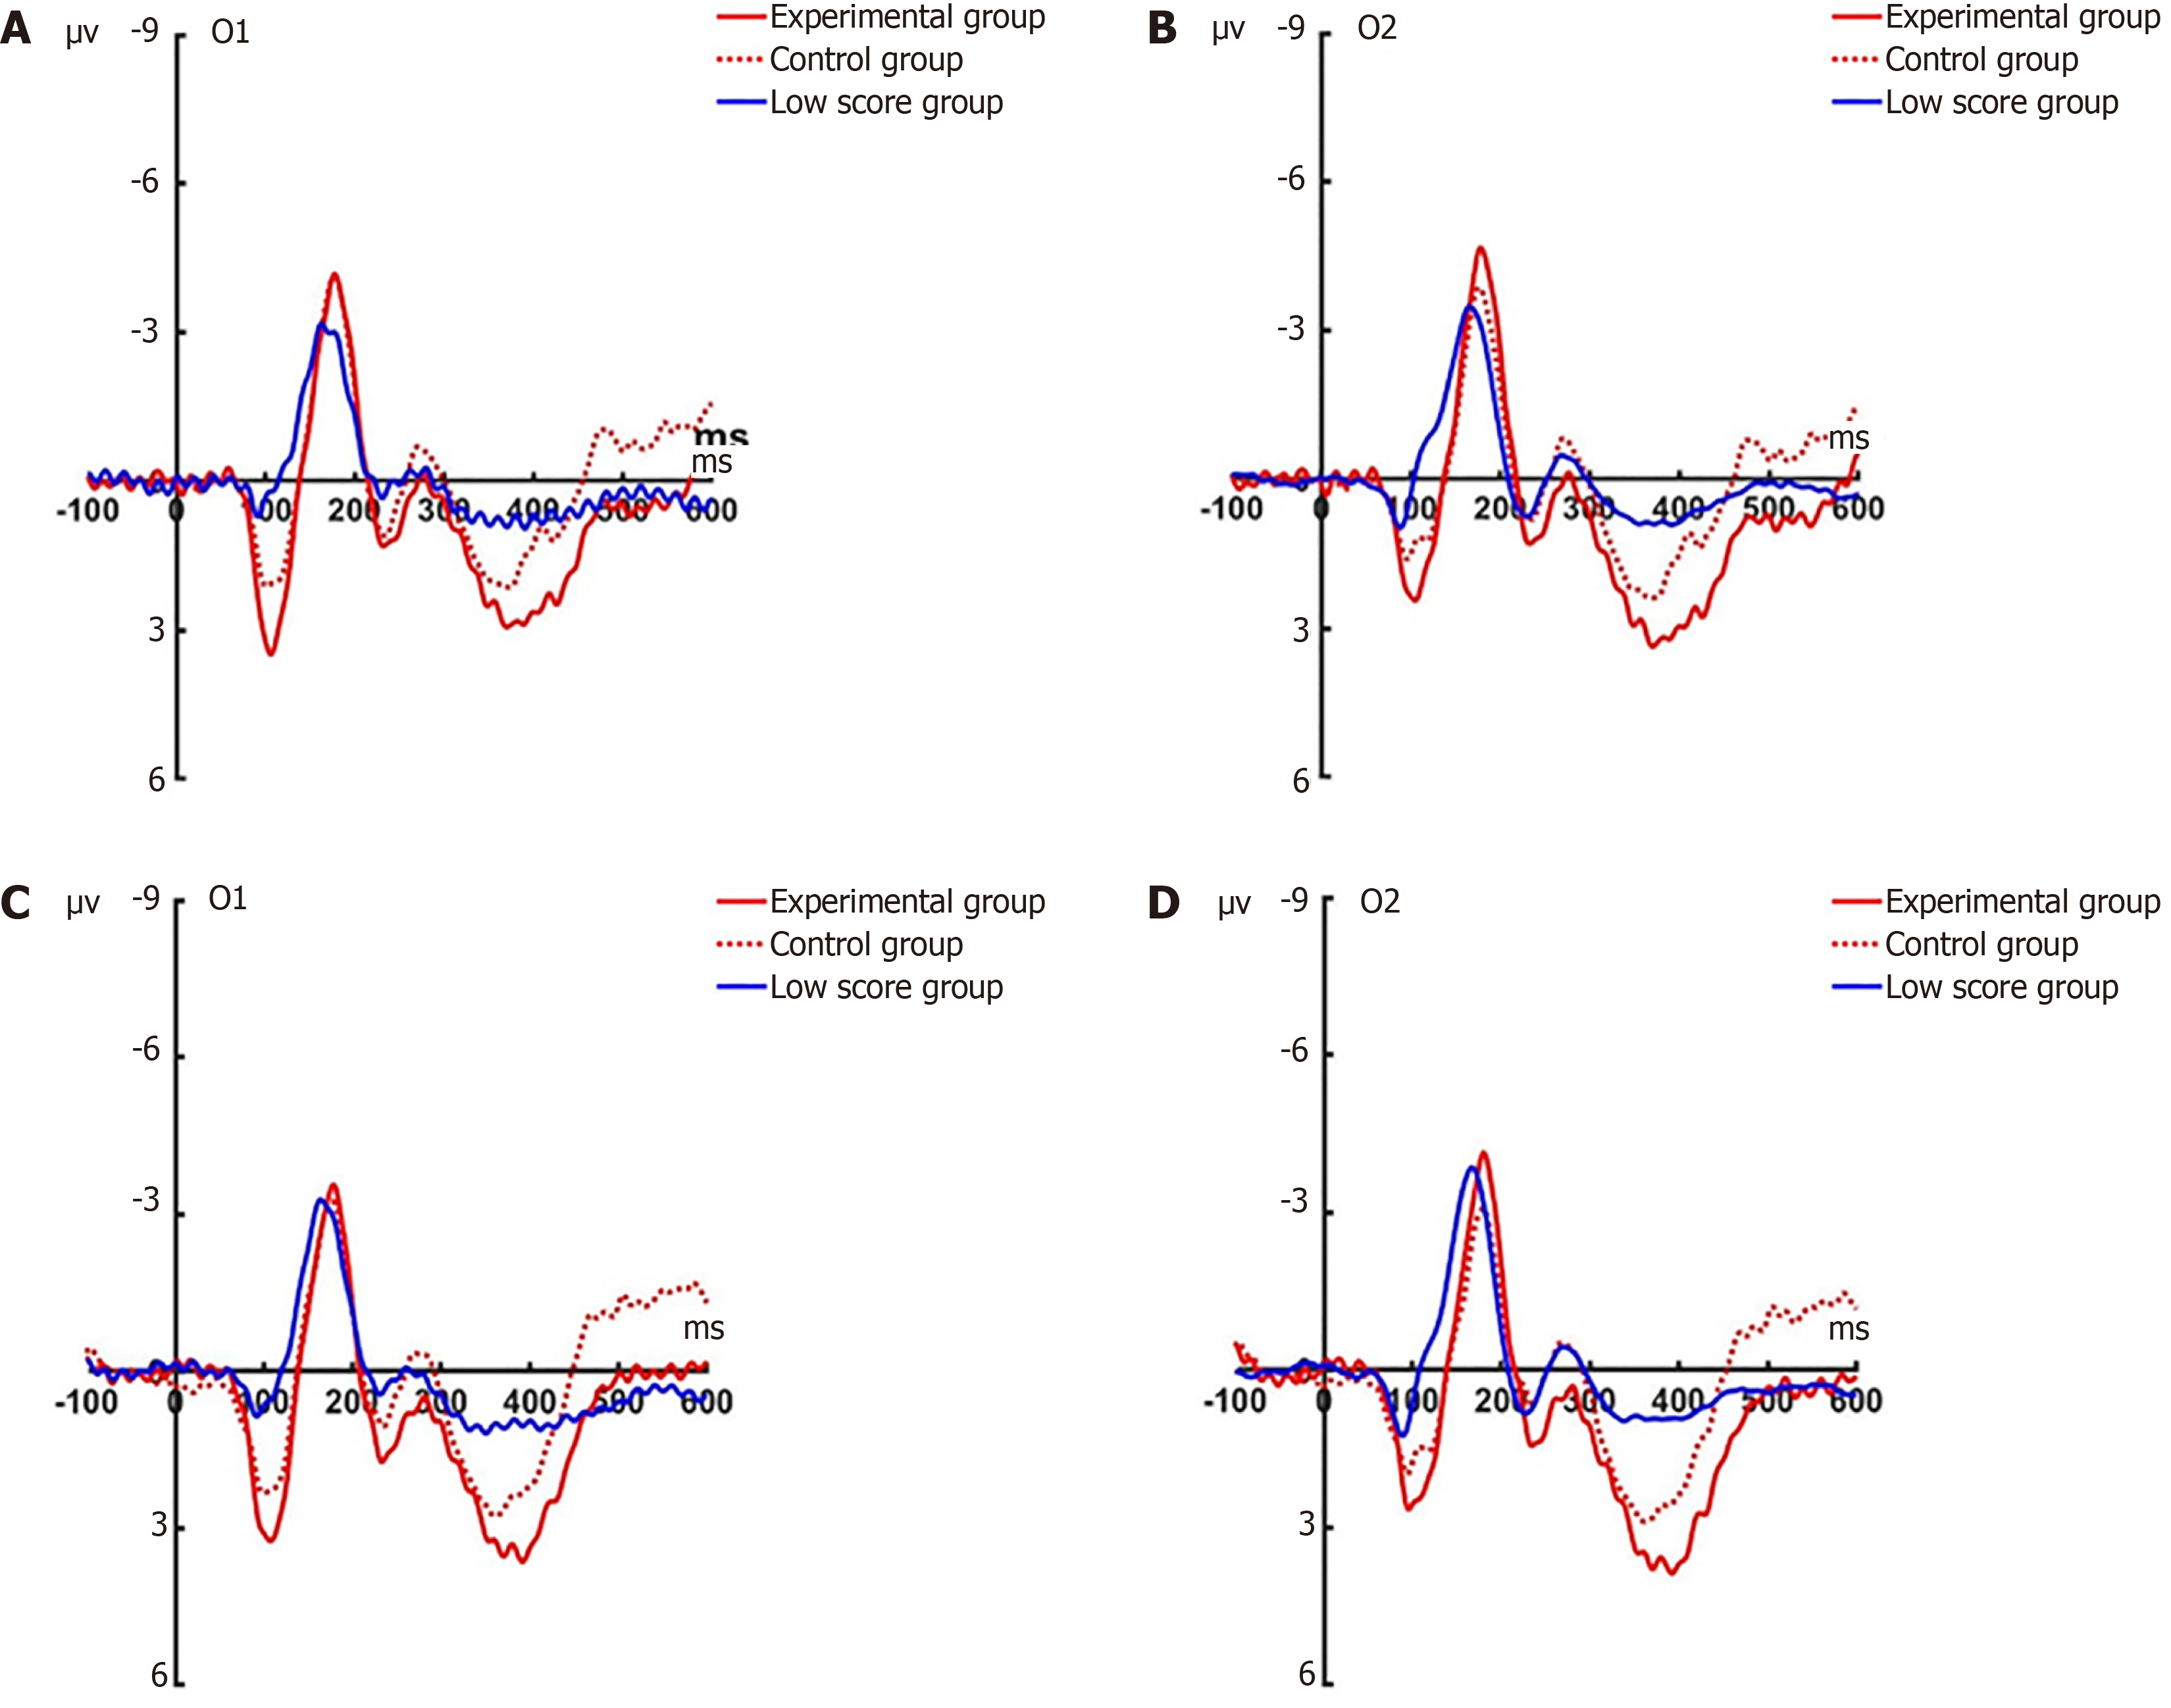
Figure 4 Pre-test P1 analyses conducted on O1 and O2 electrodes for the three groups under attention disengagement conditions.
A: Grand average waveforms of the three groups at O1 for angry faces; B: Grand average waveforms of the three groups at O2 for angry faces; C: Grand average waveforms of the three groups at O1 for happy faces; D: Grand average waveforms of the three groups at O2 for happy faces. ms: Milliseconds.
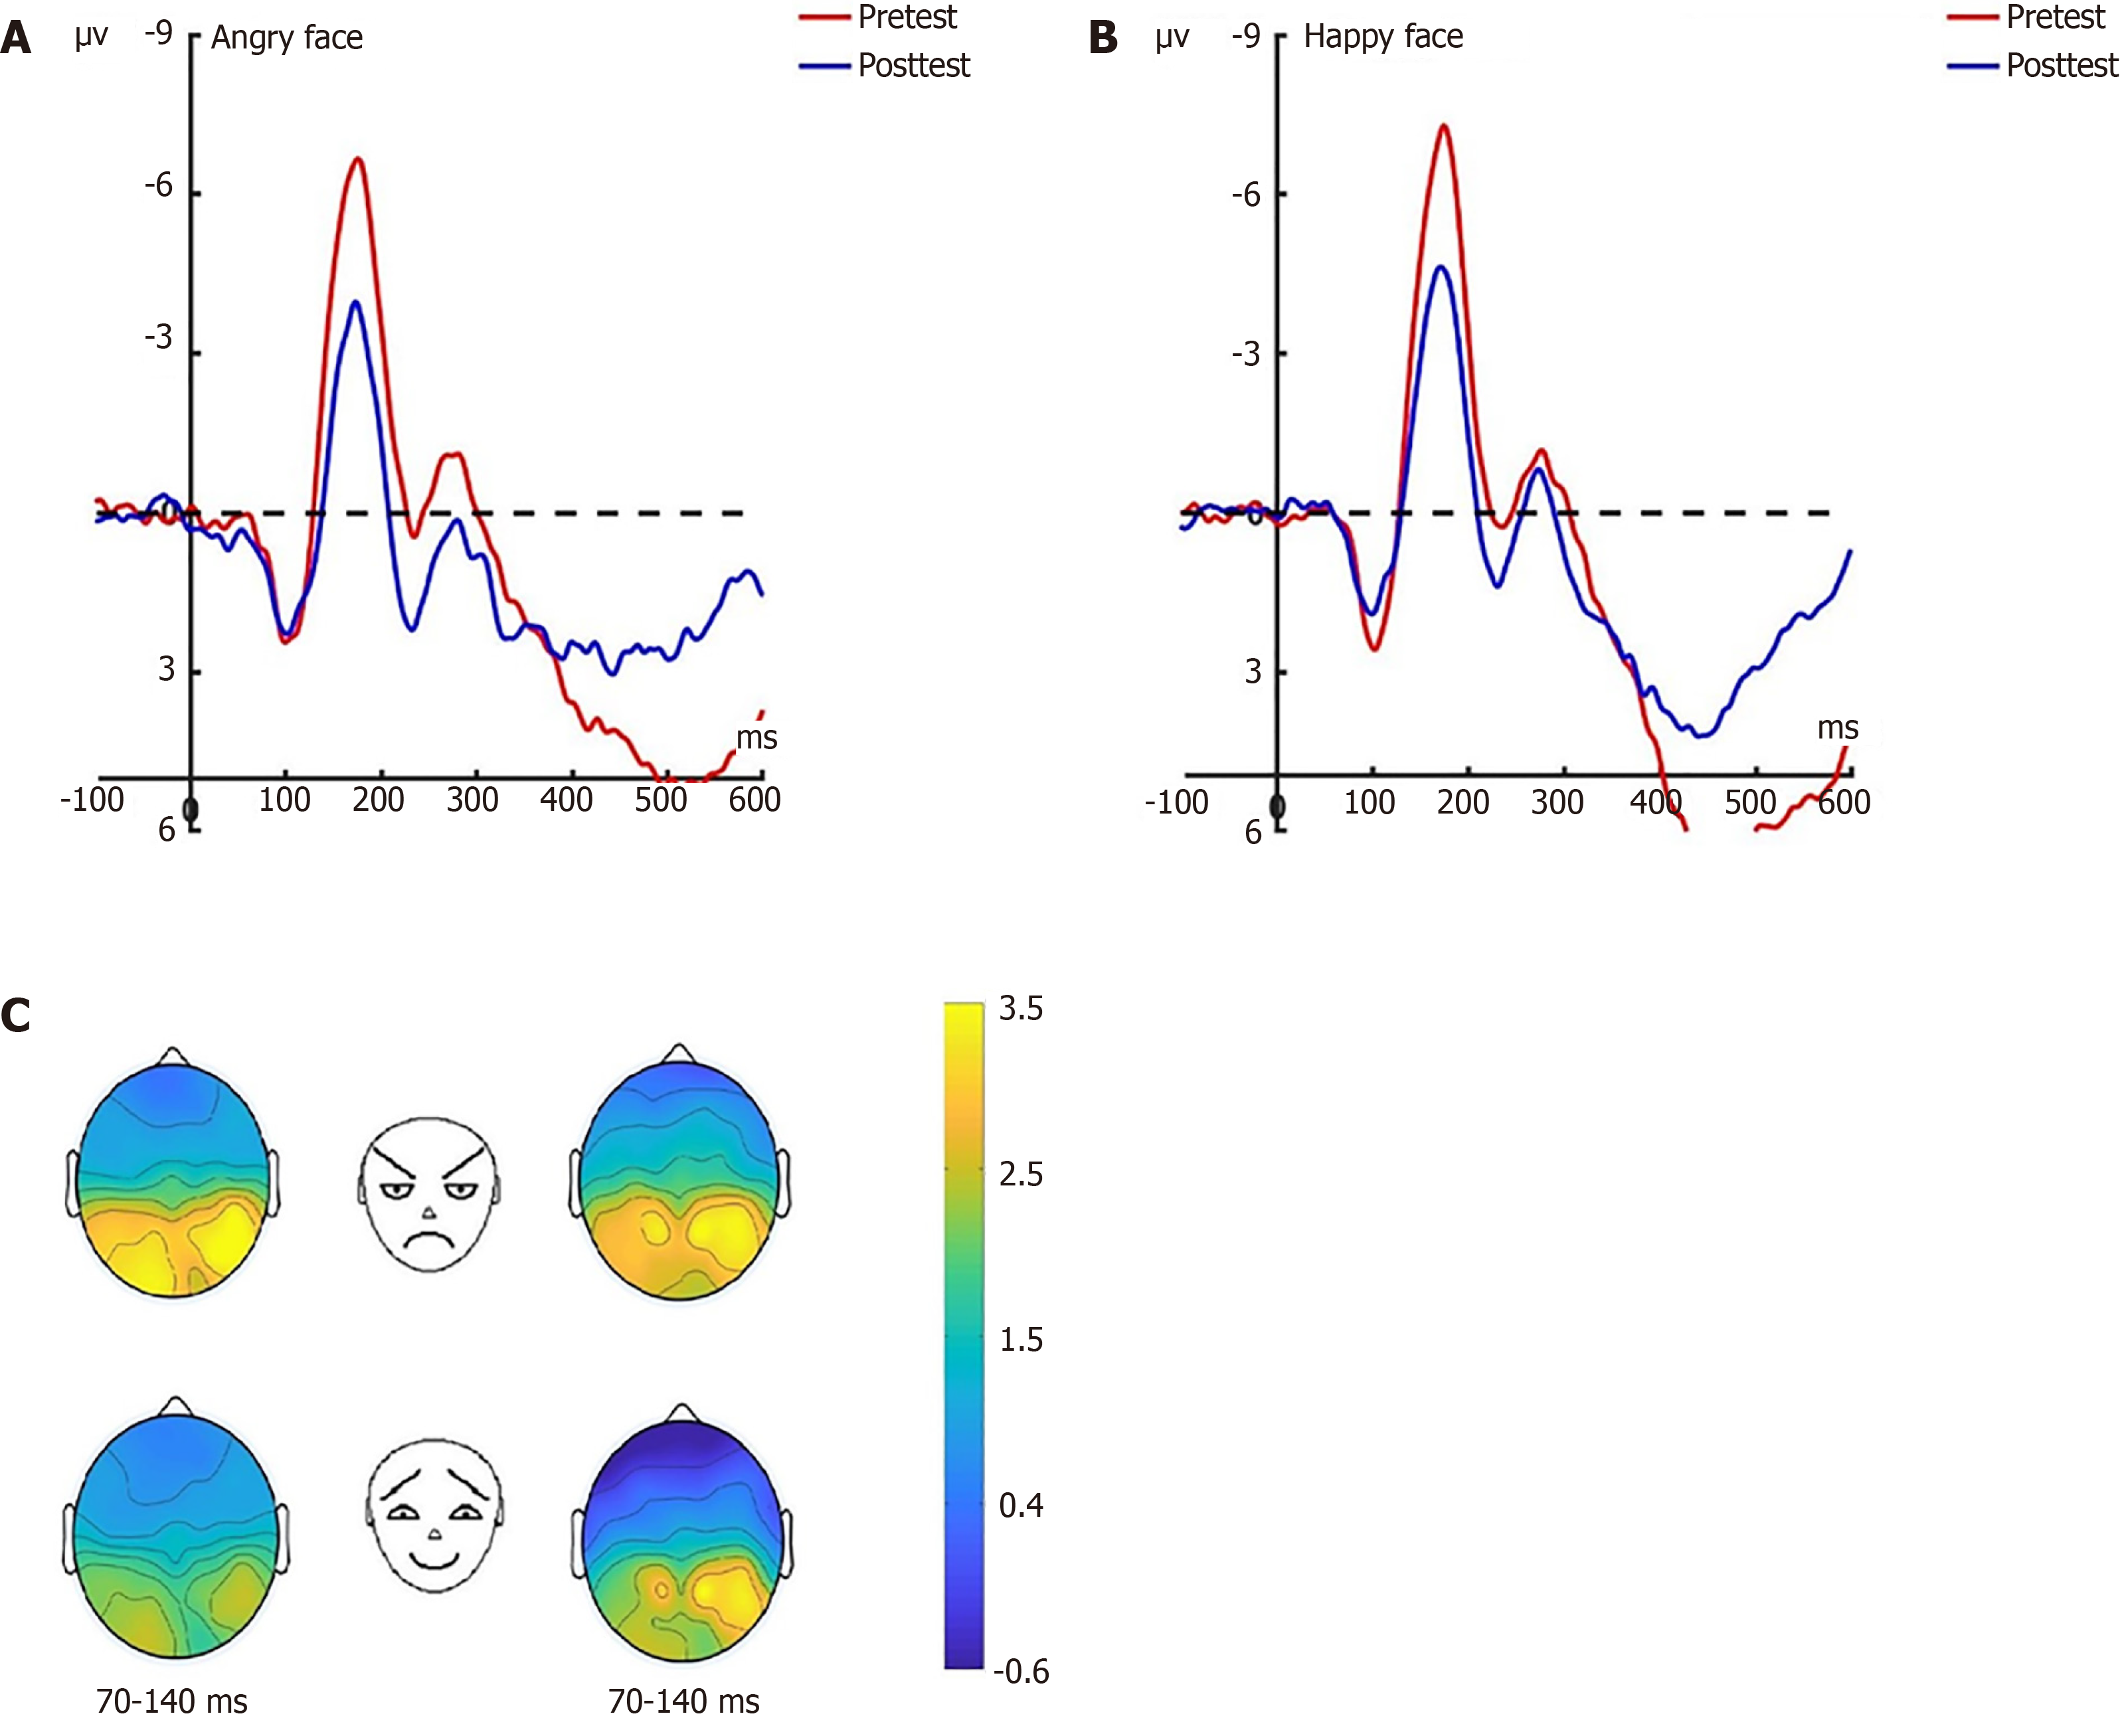
Figure 5 Pre-test and post-test P1 analyses conducted on O1 electrode for experimental group.
A: Grand average waveforms of P1 for angry faces under attention sensitivity conditions; B: Grand average waveforms of P1 for happy faces under attention sensitivity conditions; C: Scalp topographies of P1 component over different faces and times. The left side shows data collected before hypnotherapy, and the right side shows data collected after hypnotherapy. ms: Milliseconds.
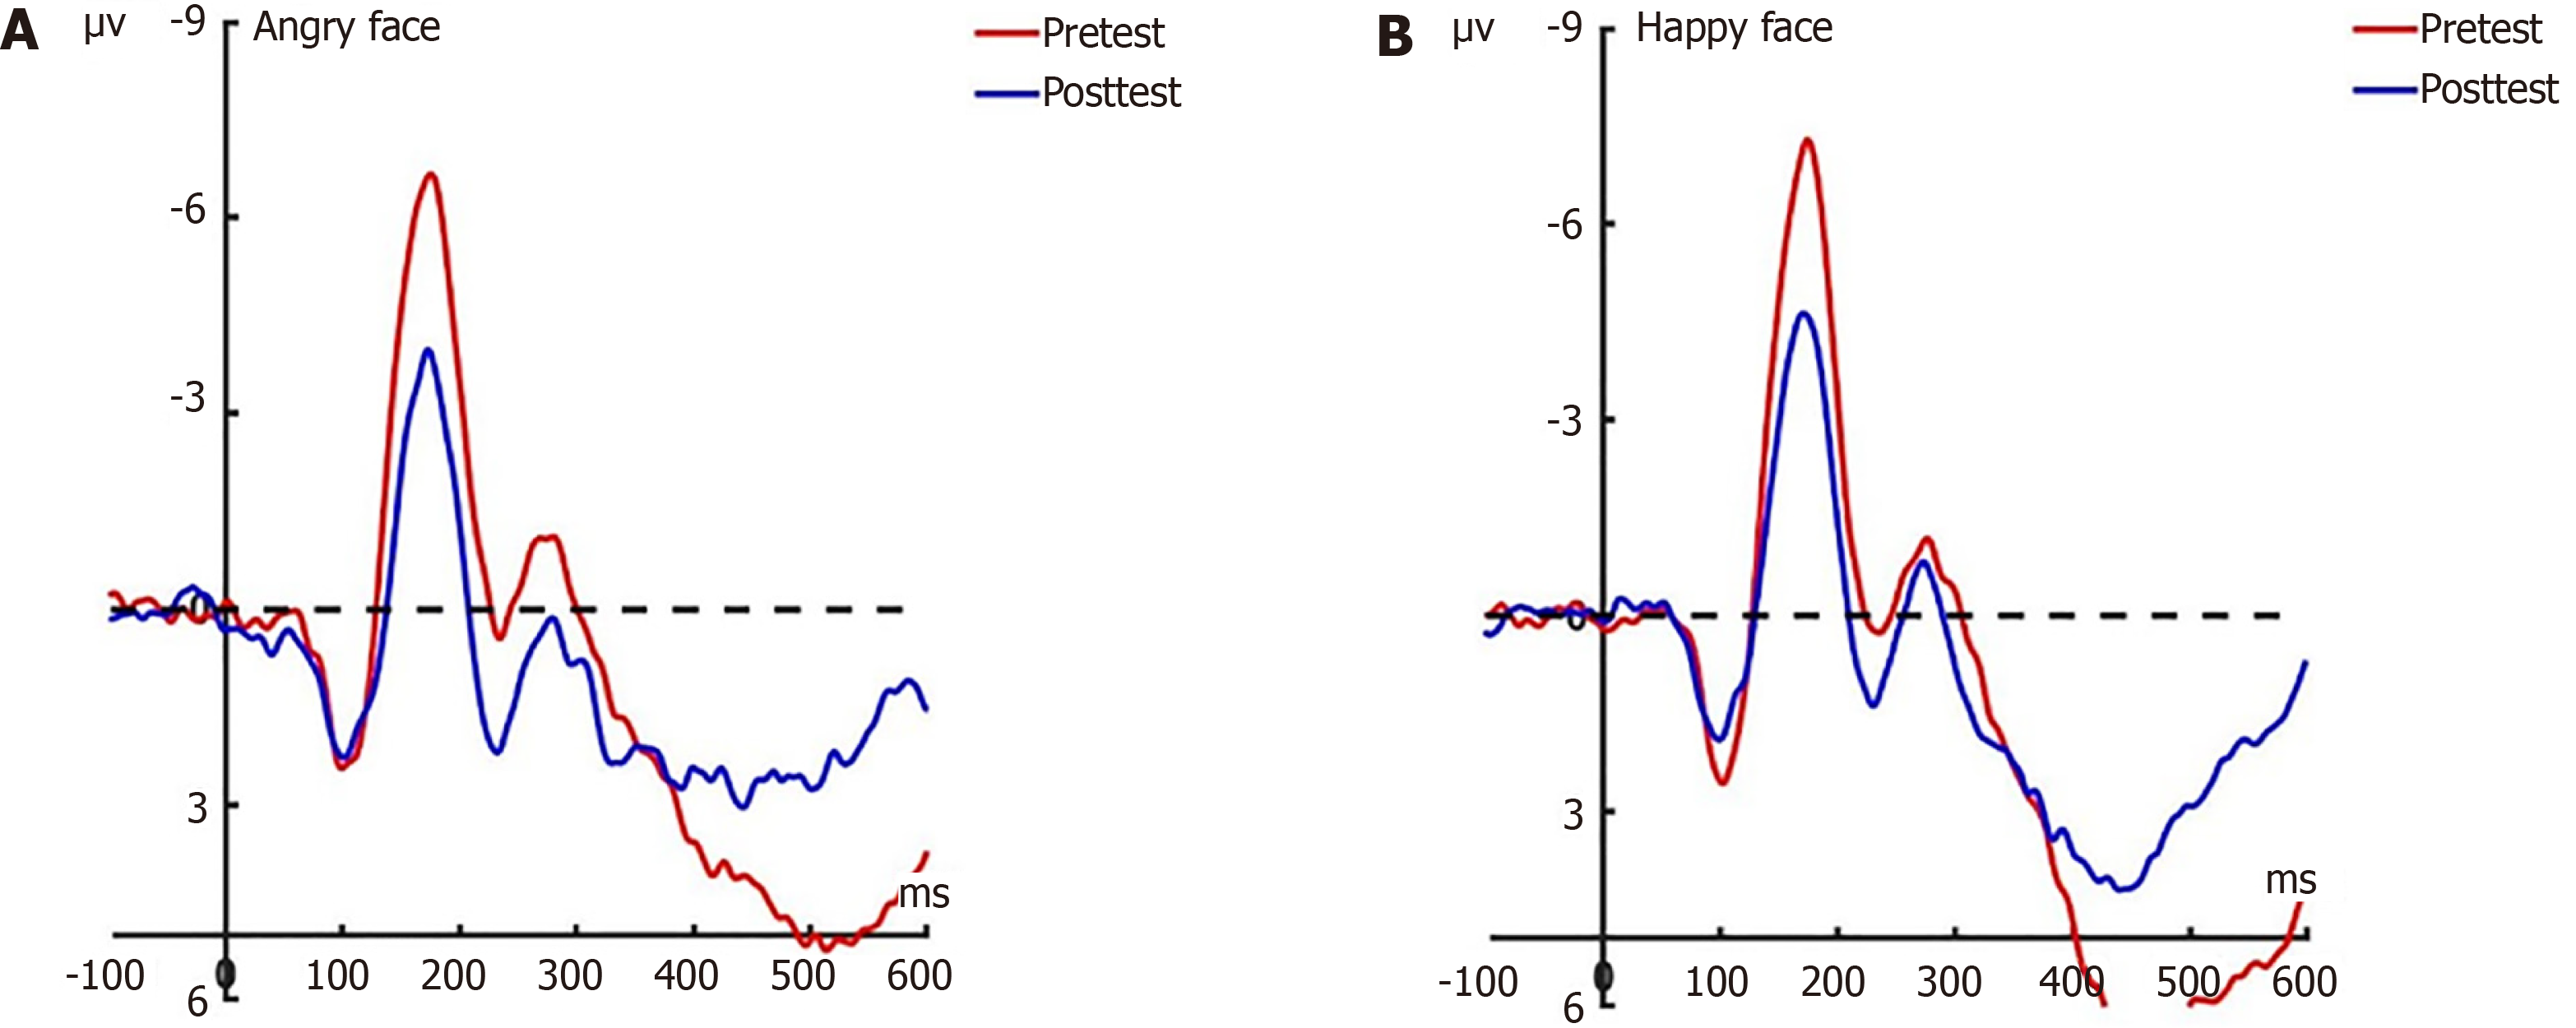
Figure 6 Pre-test and post-test P1 analyses conducted on O2 electrode for experimental group.
A: Grand average waveforms of P1 for angry faces under attention sensitivity conditions; B: Grand average waveforms of P1 for happy faces under attention sensitivity conditions. ms: Milliseconds.
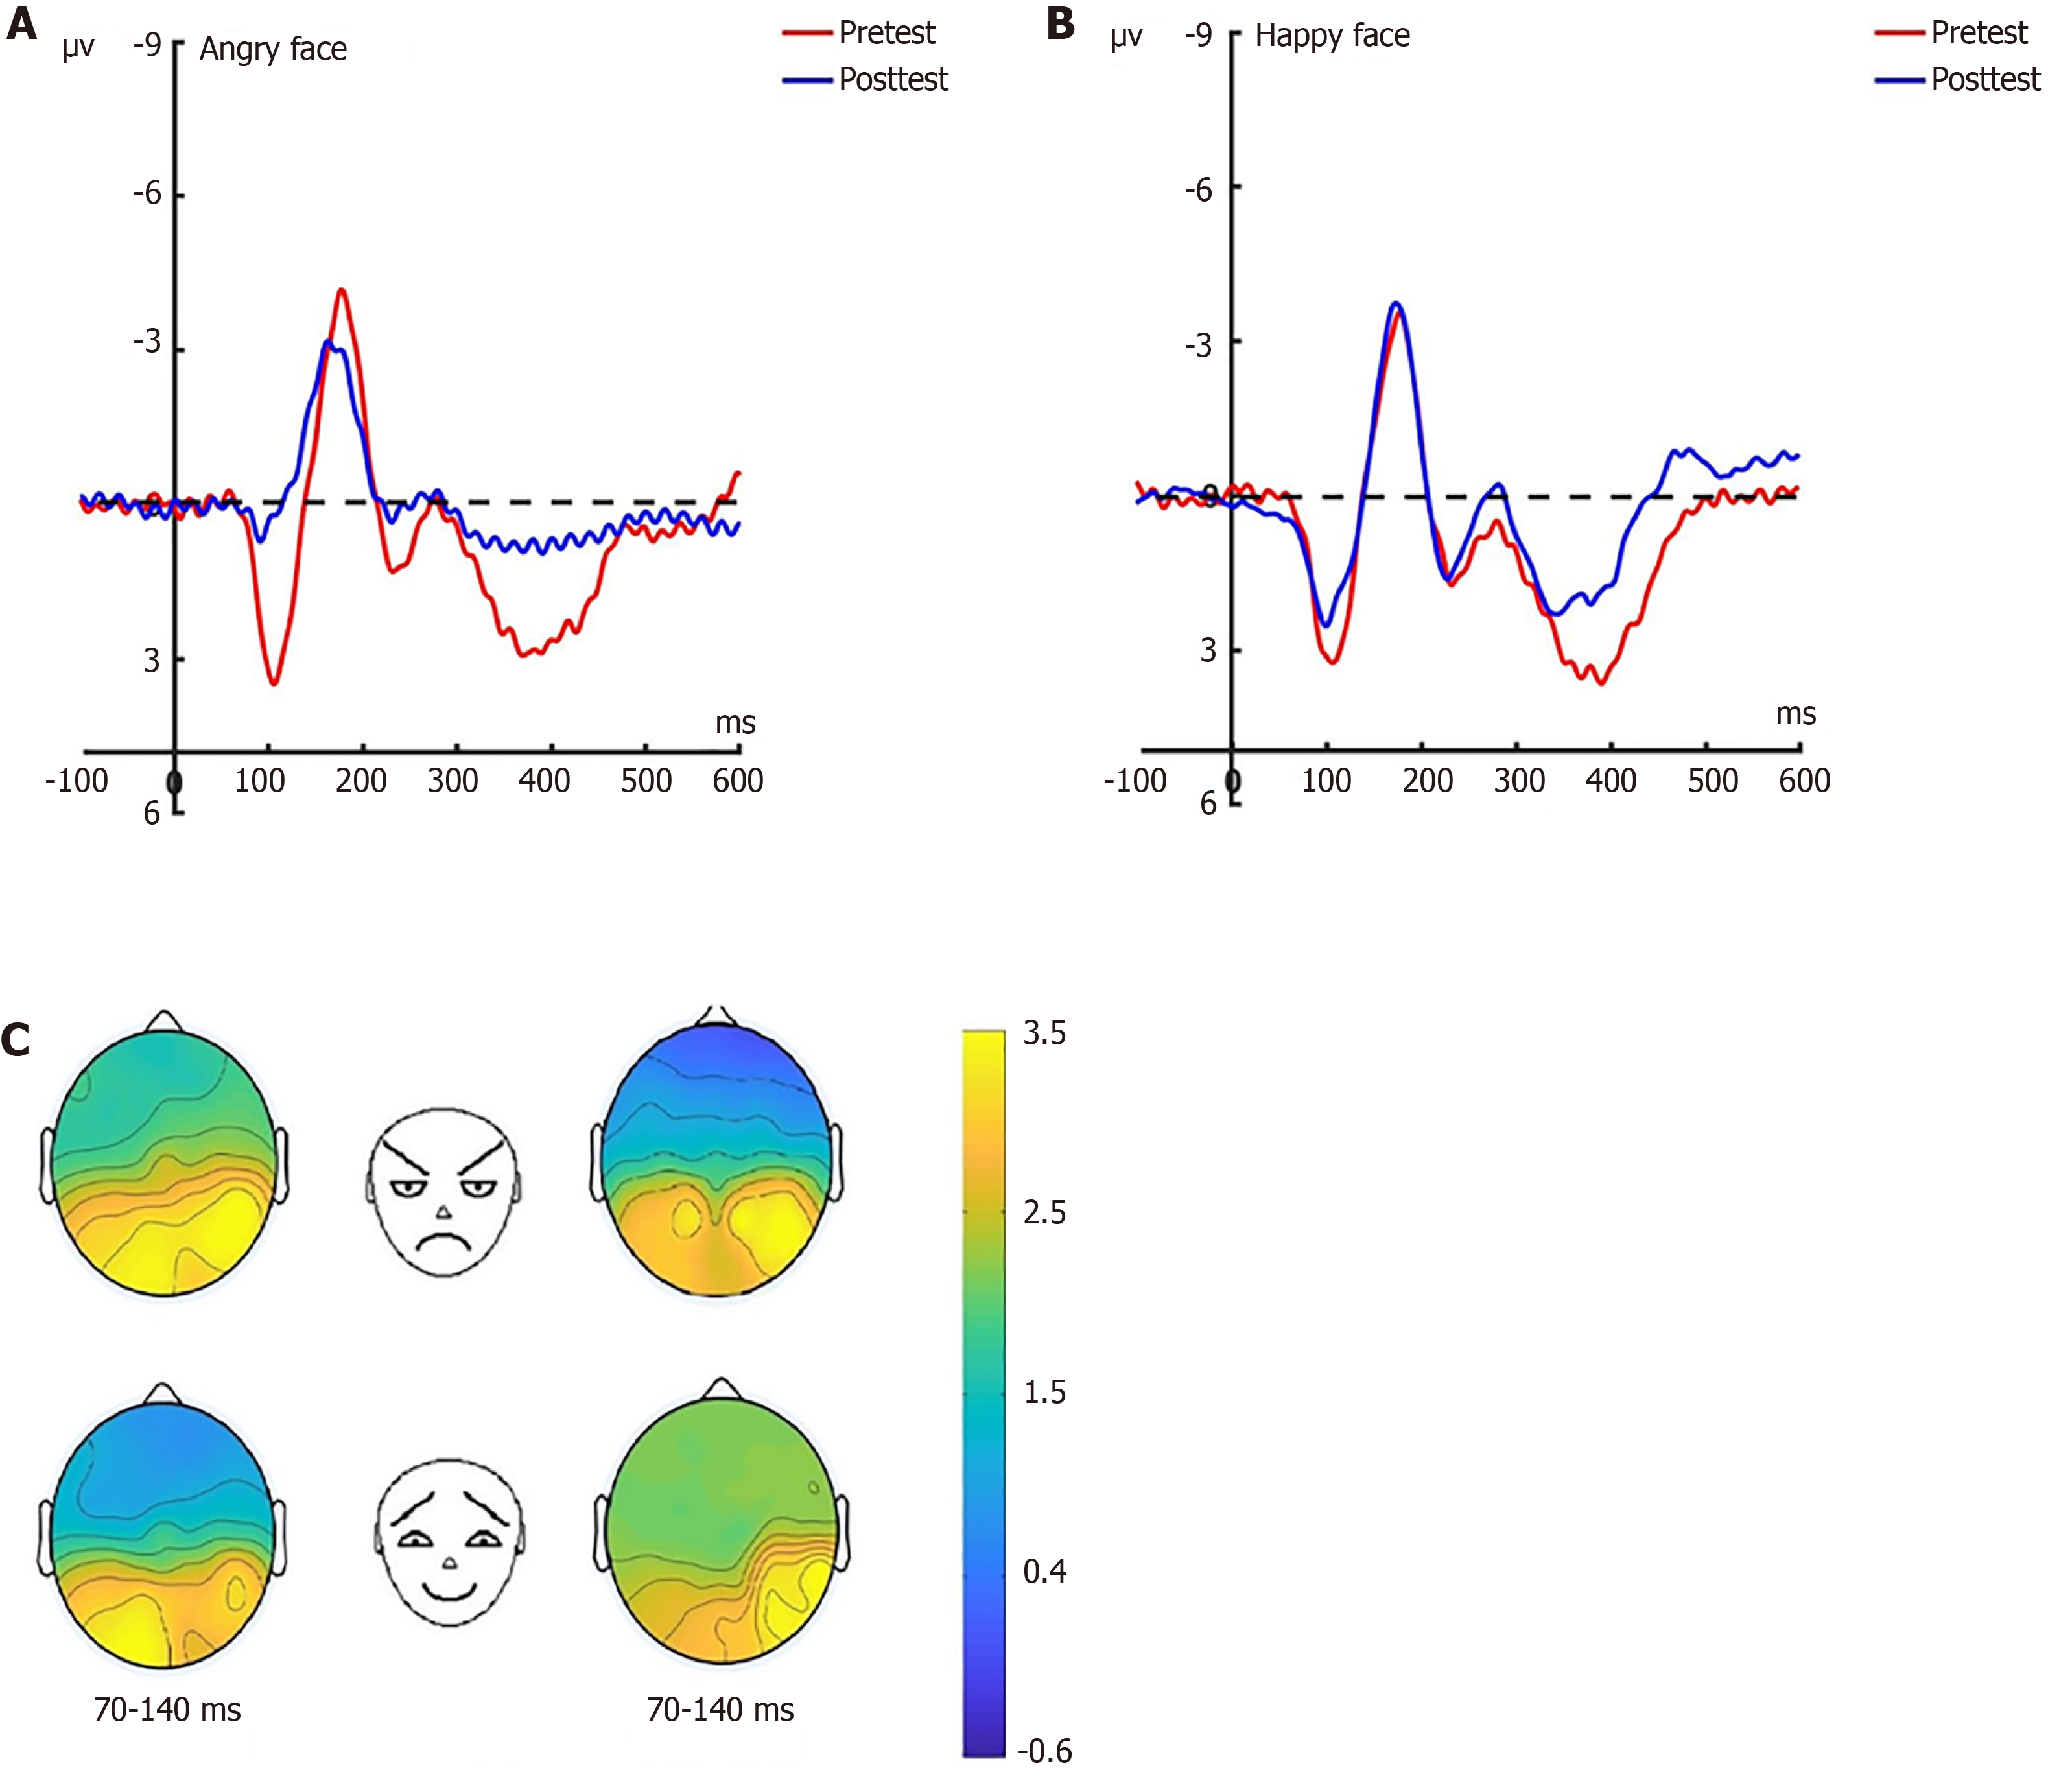
Figure 7 Pre-test and post-test P1 analyses of O1 electrode for experimental group.
A: Grand average waveforms of P1 for angry faces under attention disengagement conditions; B: Grand average waveforms of P1 for happy faces under attention disengagement conditions; C: Scalp topographies of P1 component over different faces and times. Left: Before hypnotherapy; Right: After hypnotherapy. ms: Milliseconds.
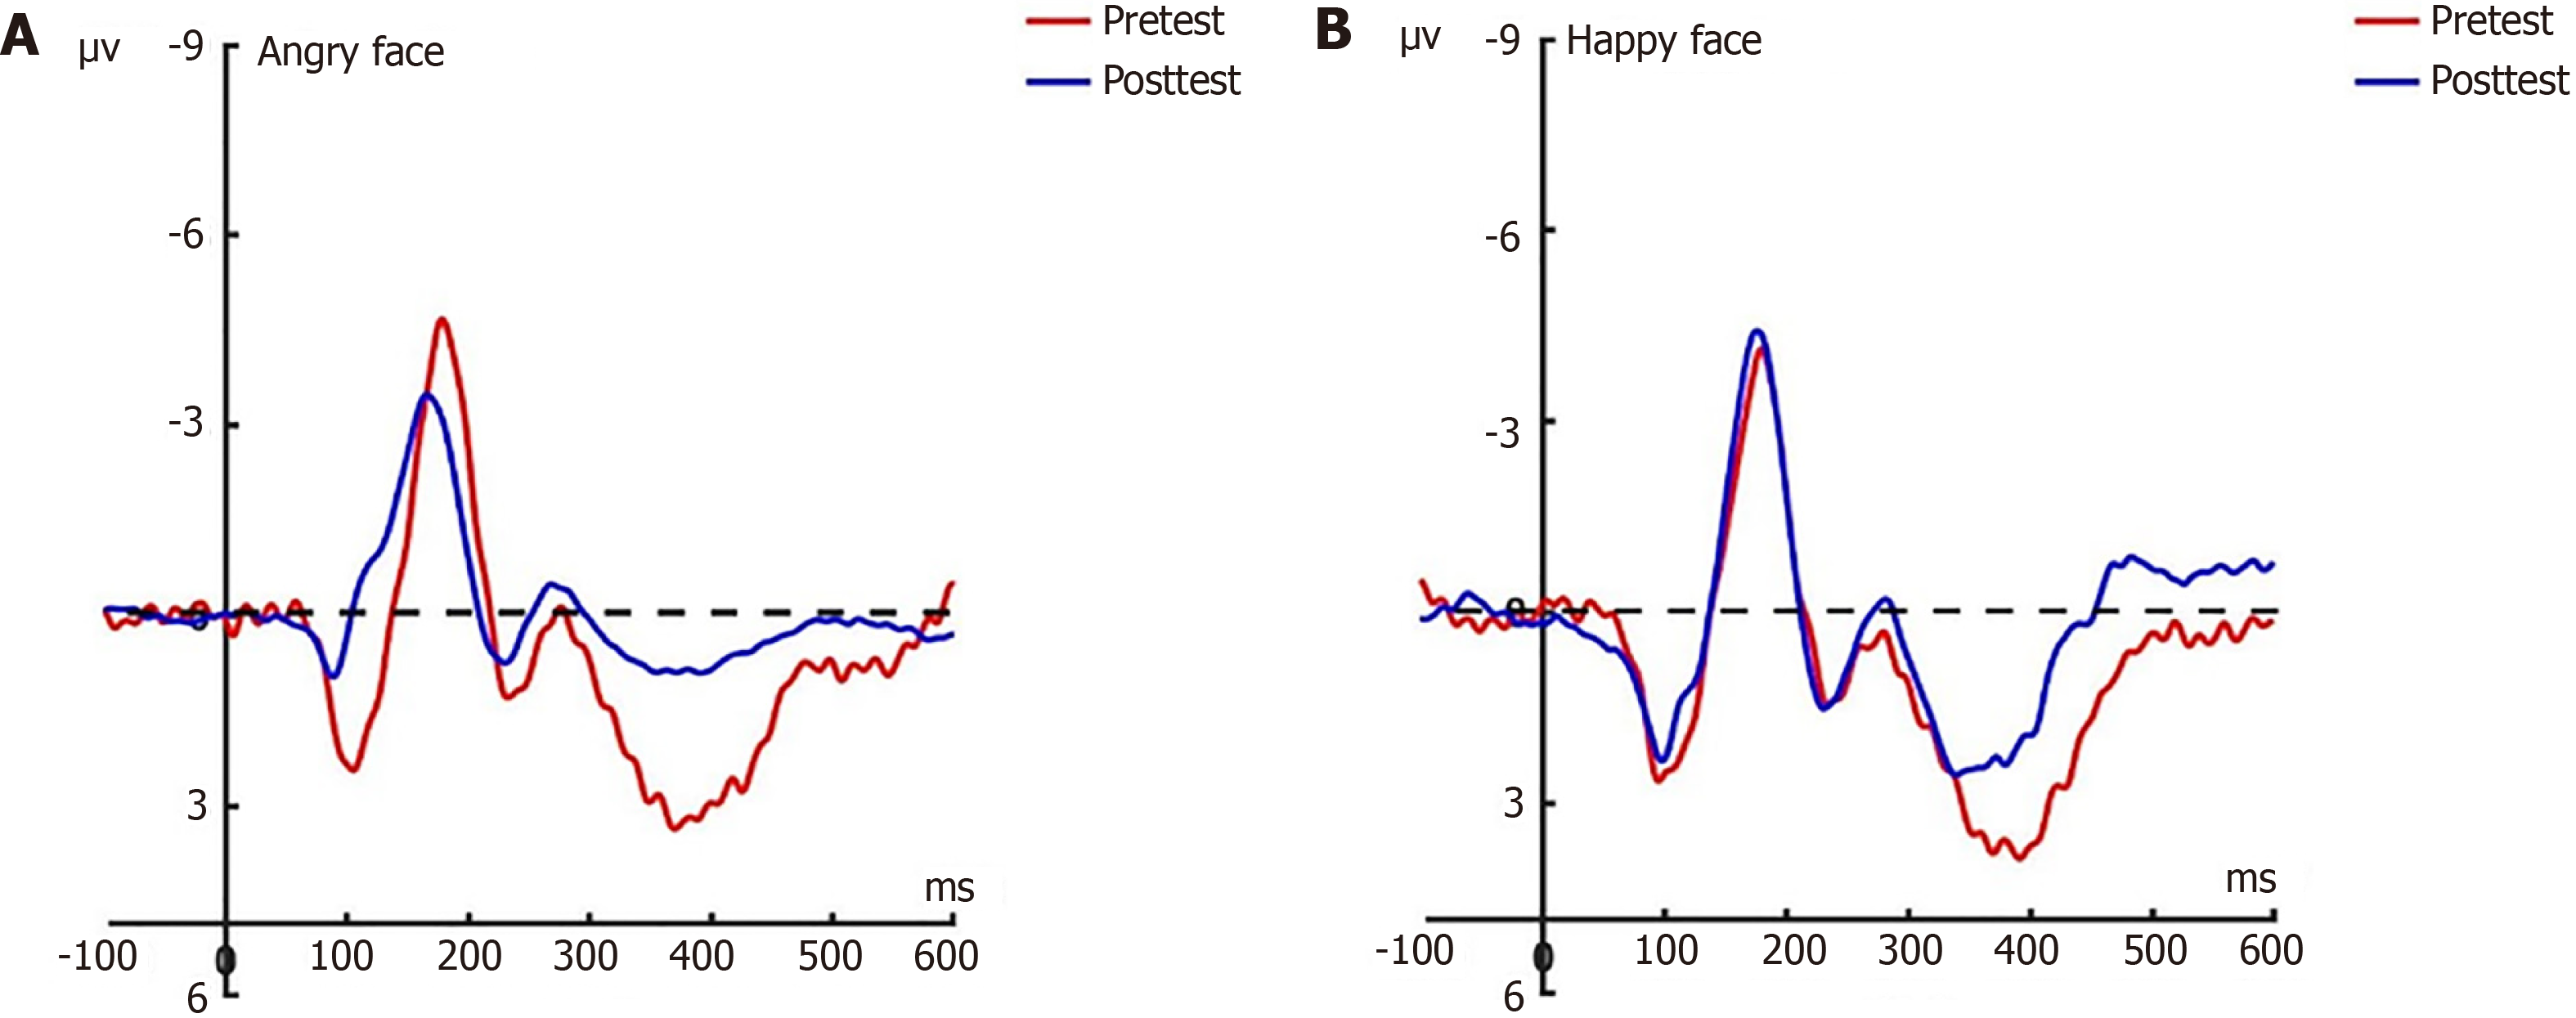
Figure 8 Pre-test and post-test P1 analyses conducted on O2 electrode for experimental group.
A: Grand average waveforms of P1 for angry faces under attention disengagement conditions; B: Grand average waveforms of P1 for happy faces under attention disengagement conditions. ms: Milliseconds.
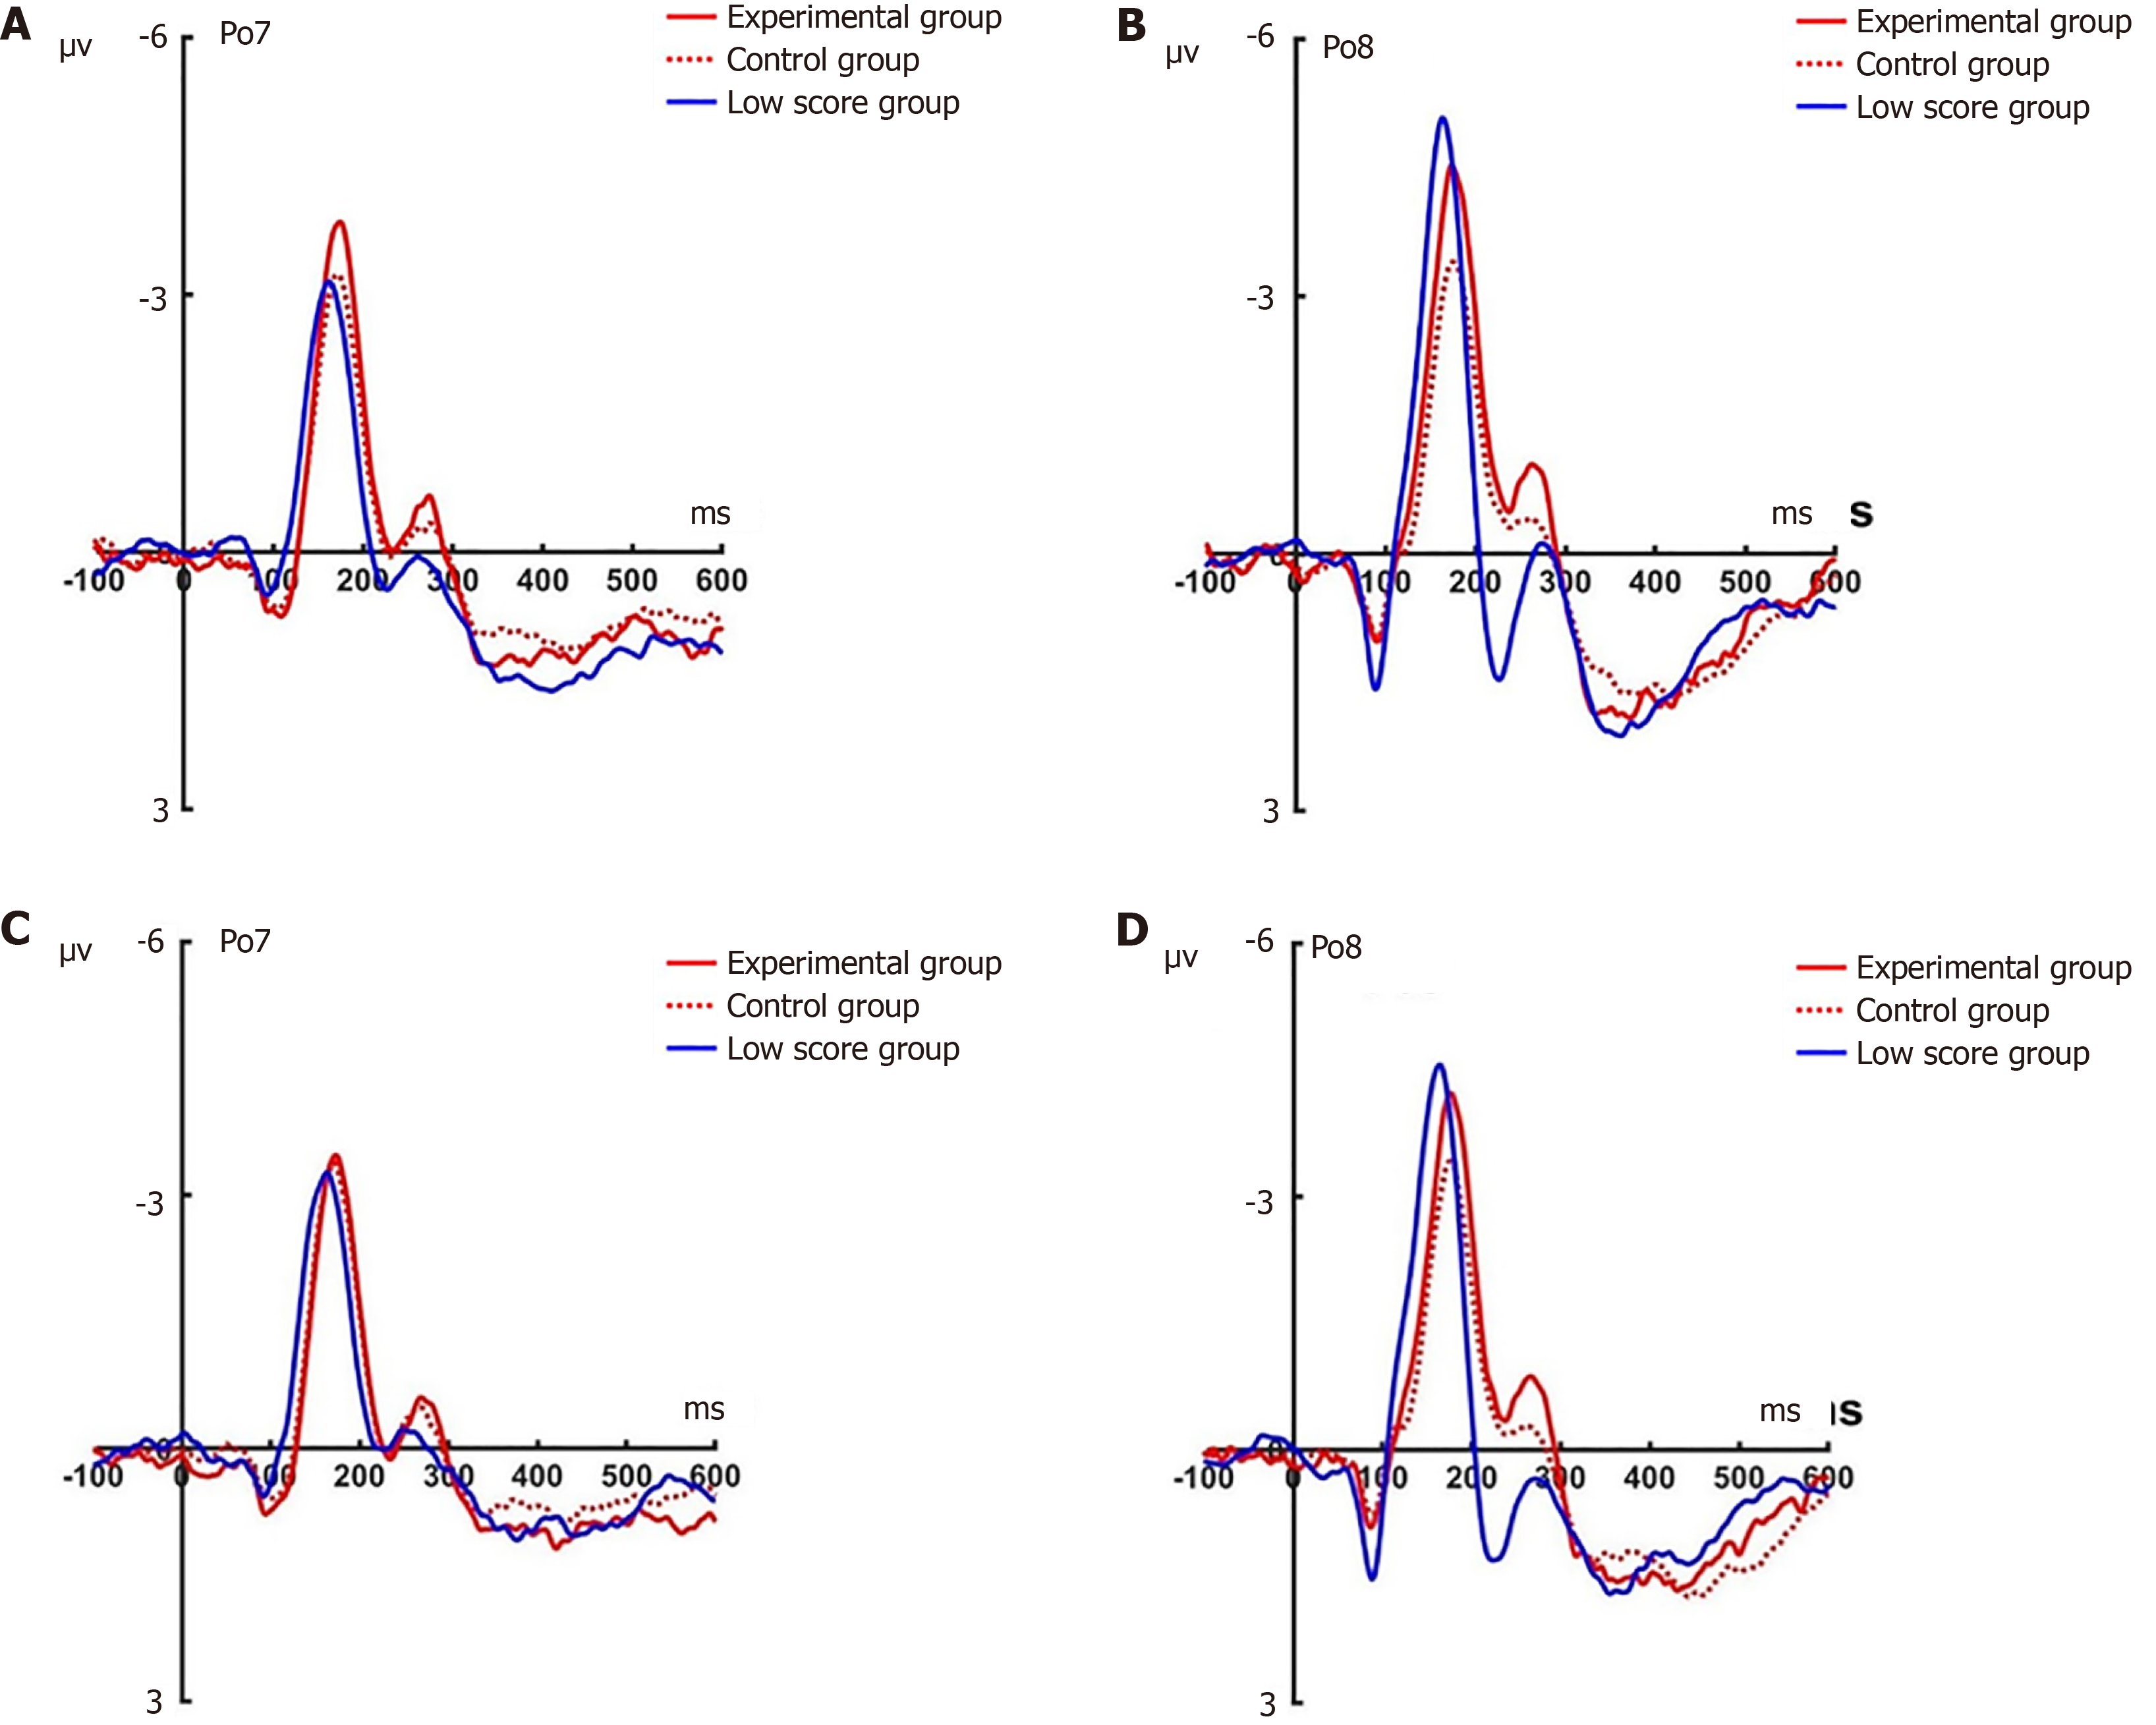
Figure 9 Pre-test N2pc analyses conducted on Po7 and Po8 electrodes for the three groups under attention sensitivity conditions.
A: Grand average waveforms of the three groups at Po7 for angry faces; B: Grand average waveforms of the three groups at Po8 for angry faces; C: Grand average waveforms of the three groups at Po7 for happy faces; D: Grand average waveforms of the three groups at Po8 for happy faces. ms: Milliseconds.
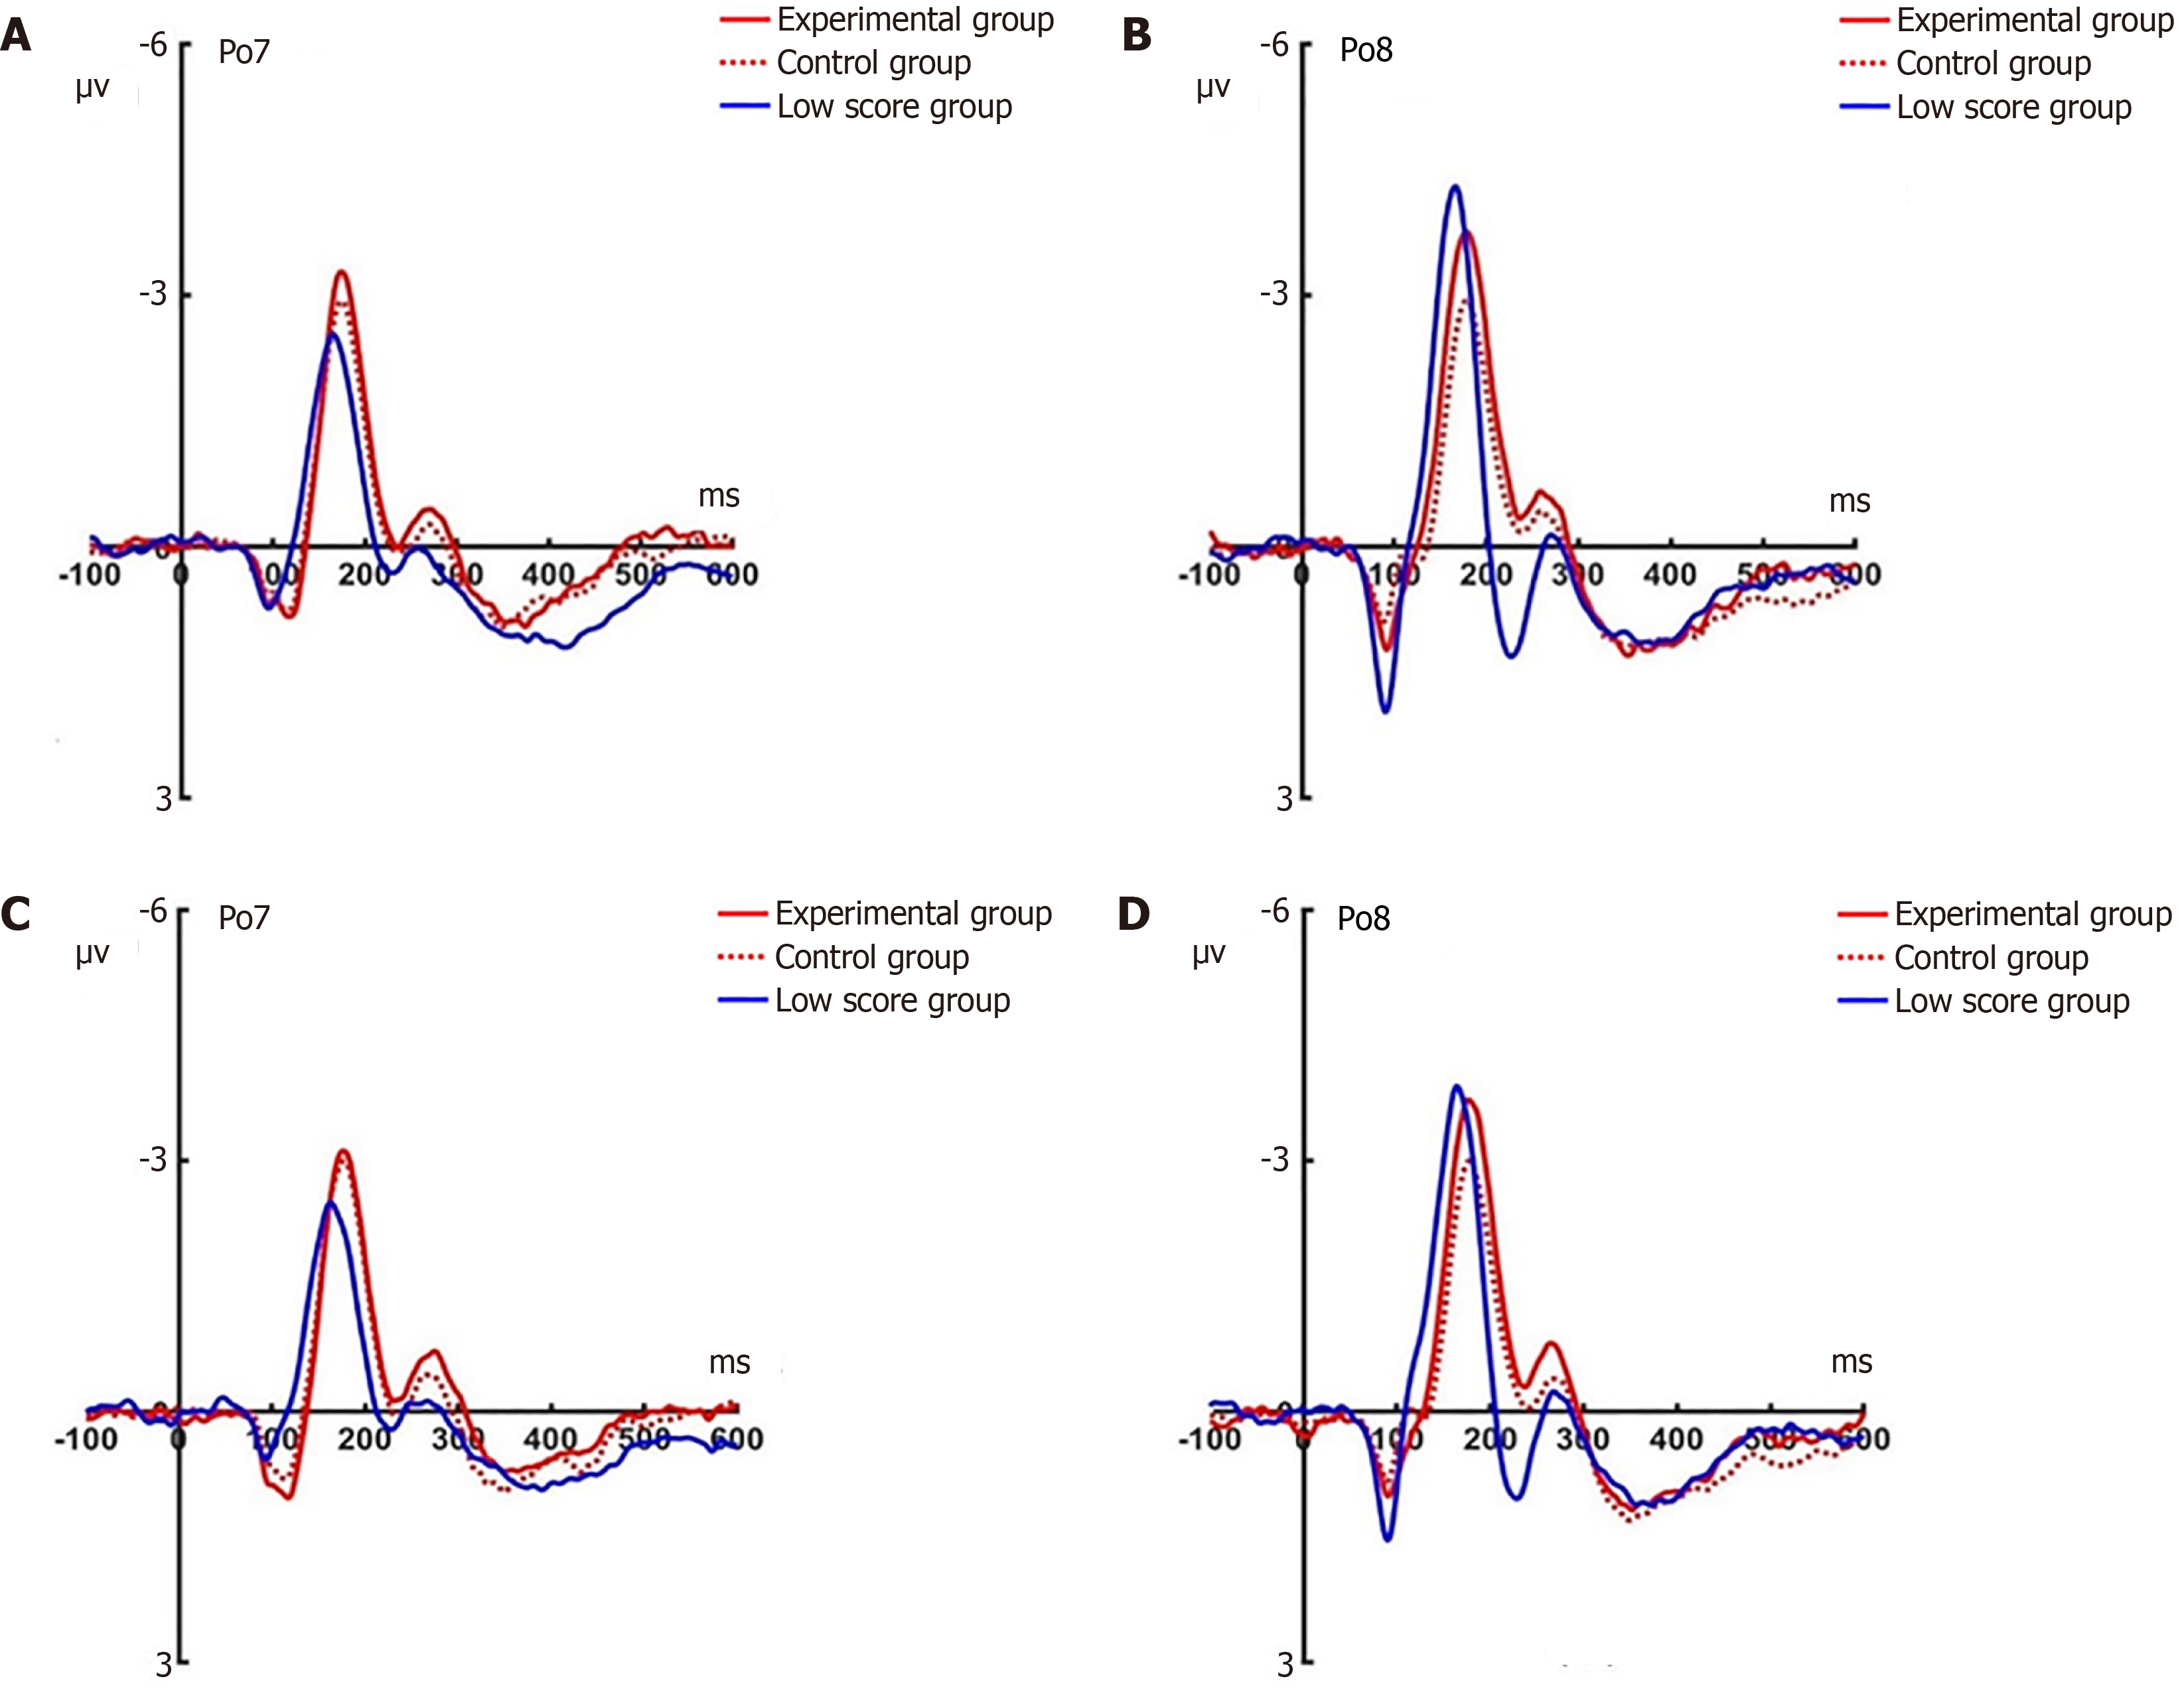
Figure 10 Pre-test N2pc analyses conducted on Po7 and Po8 electrodes for the three groups under attention disengagement conditions.
A: Grand average waveforms of the three groups at Po7 for angry faces; B: Grand average waveforms of the three groups at Po8 for angry faces; C: Grand average waveforms of the three groups at Po7 for happy faces; D: Grand average waveforms of the three groups at Po8 for happy faces. ms: Milliseconds.
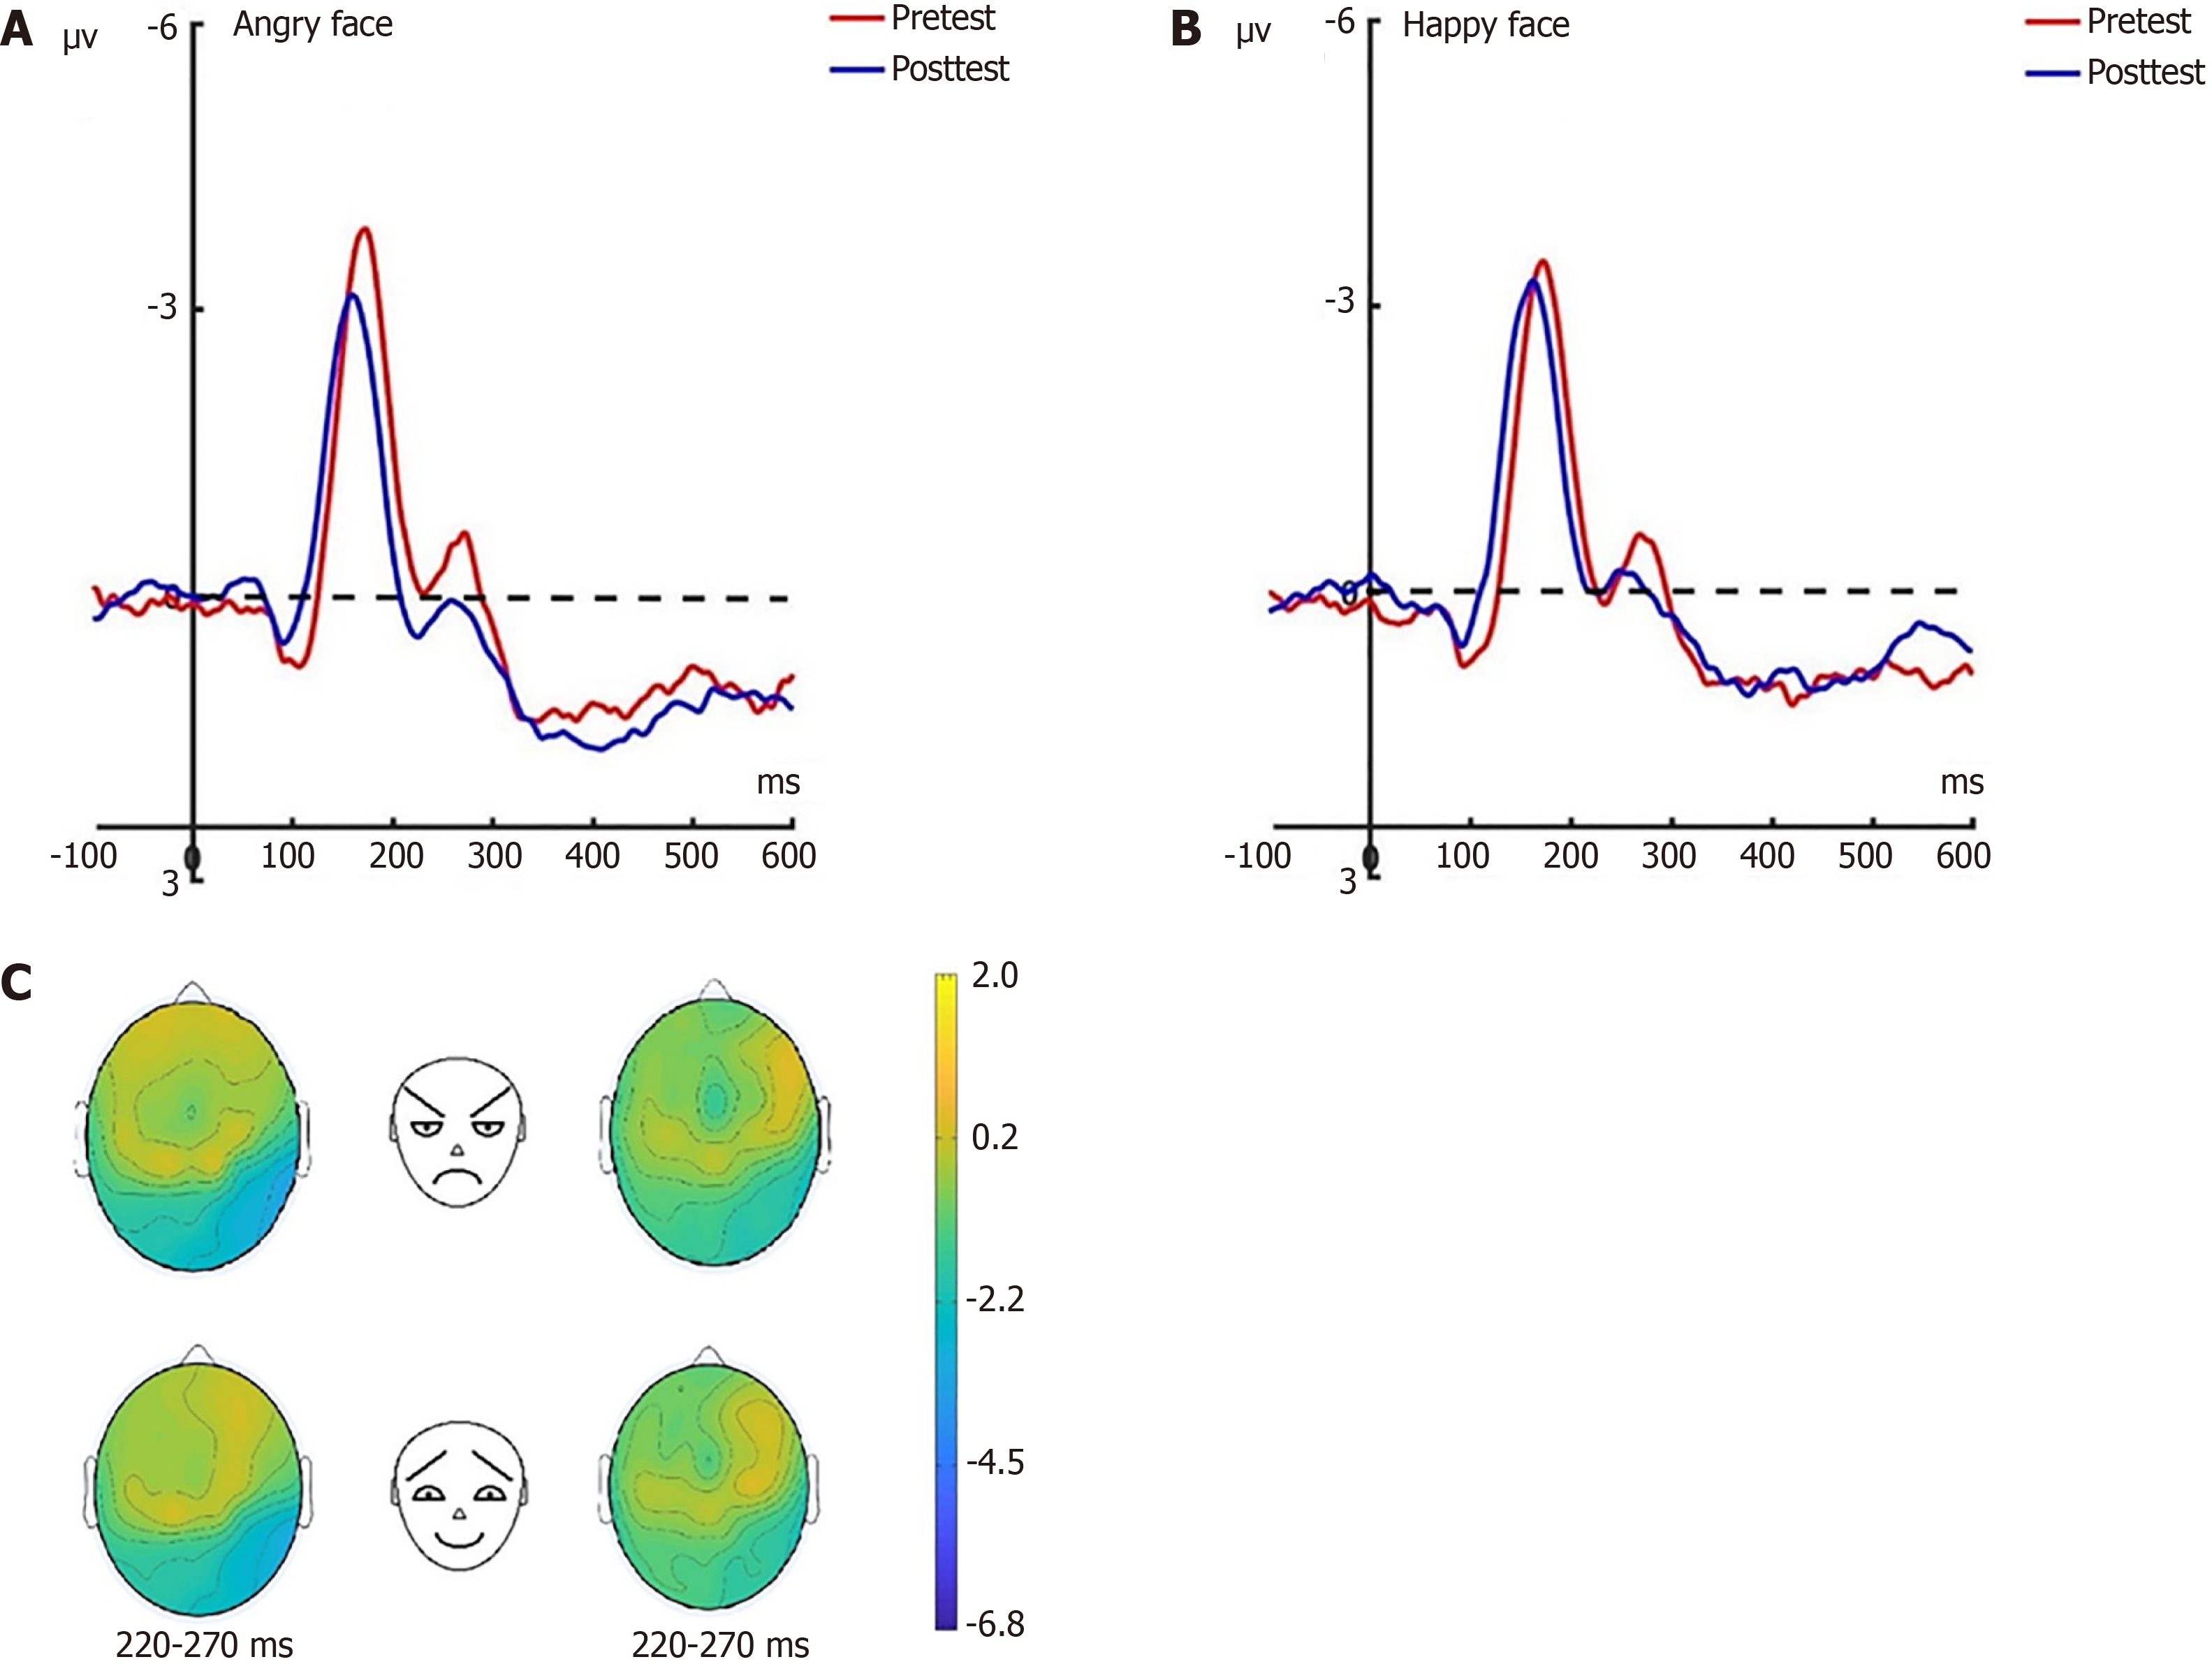
Figure 11 Pre-test and post-test N2pc analyses conducted on Po7 electrode for experimental group.
A: Grand average waveforms of N2pc for angry faces under attention sensitivity conditions; B: Grand average waveforms of N2pc for happy faces under attention sensitivity conditions; C: Scalp topographies of N2pc component over different faces and times. The left side shows data collected before hypnotherapy, and the right side shows data collected after hypnotherapy. ms: Milliseconds.
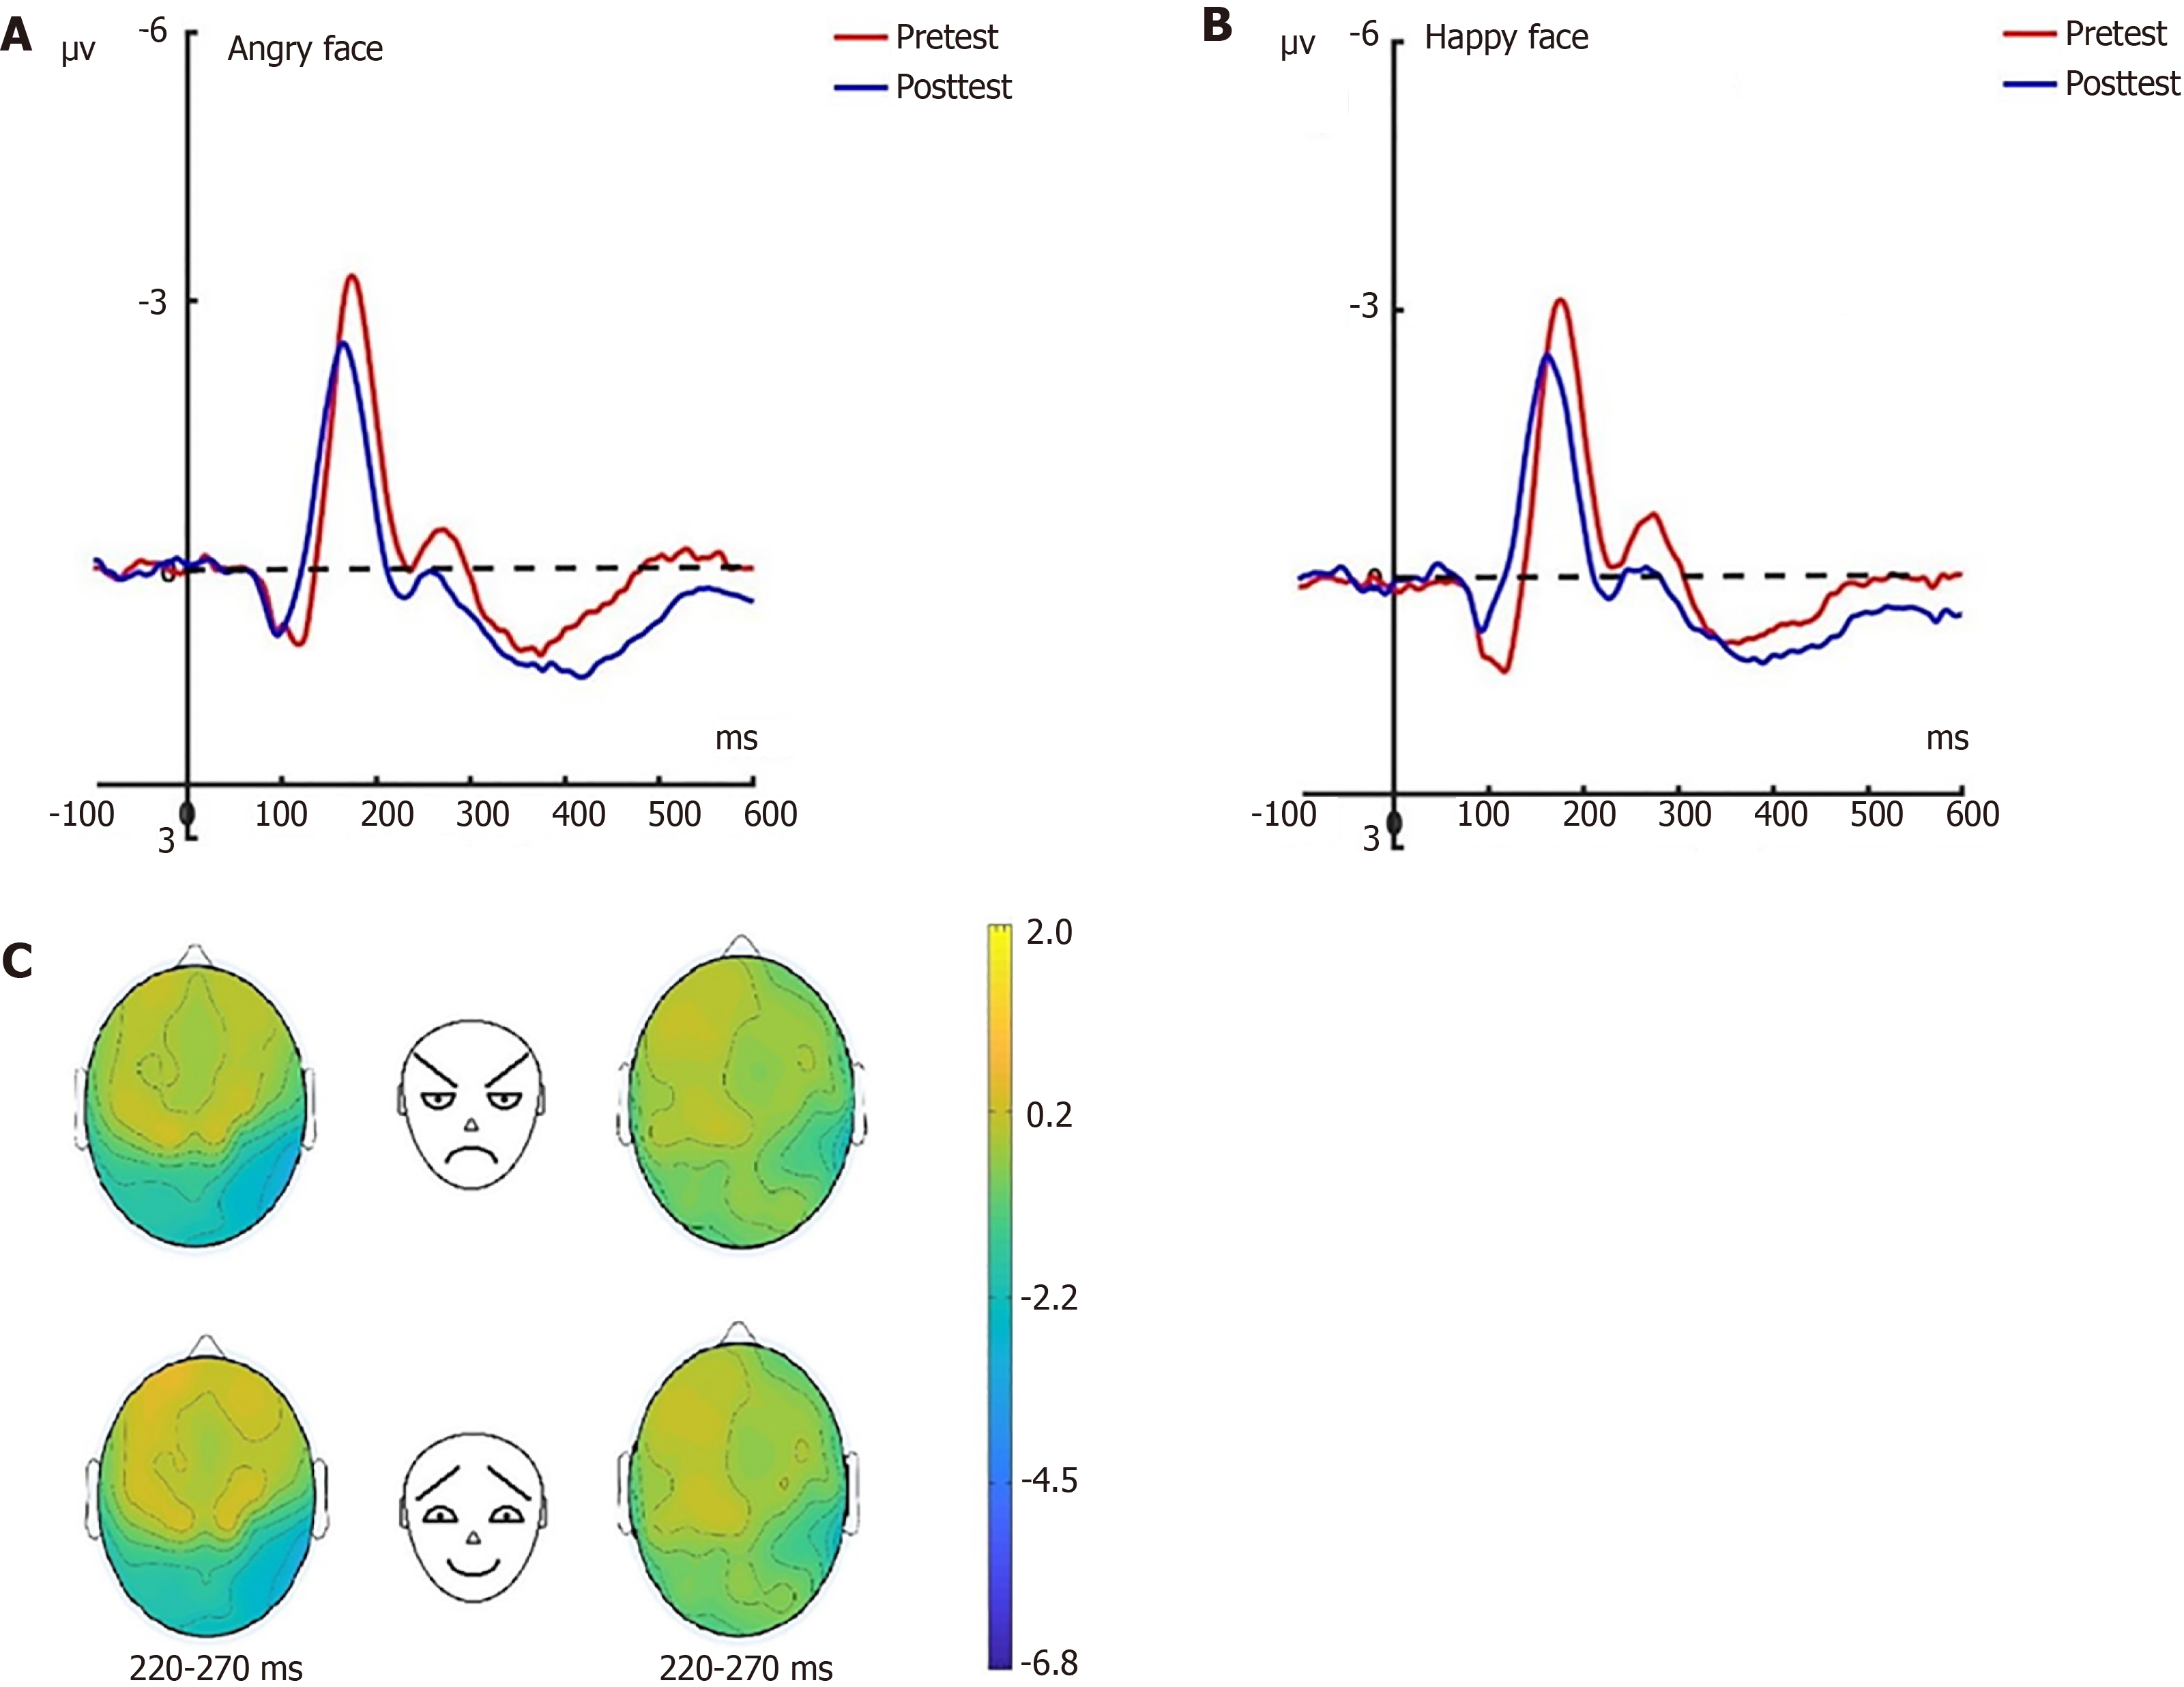
Figure 12 Pre-test and post-test N2pc analyses of Po7 electrode for experimental group.
A: Grand average waveforms of Po7 for angry faces under attention disengagement conditions; B: Grand average waveforms of N2pc for happy faces under attention disengagement conditions; C: Scalp topographies of N2pc component over different faces and times. Left: Before hypnotherapy; Right: After hypnotherapy. ms: Milliseconds.
- Citation: Zhang H, Zhang M, Li N, Wei WZ, Yang LX, Li YY, Zu ZY, Ma LJ, Wang HX, Wang K, Li XM. Event-related potentials reveal hypnotherapy's impact on attention bias in social anxiety disorder. World J Psychiatry 2025; 15(5): 102552
- URL: https://www.wjgnet.com/2220-3206/full/v15/i5/102552.htm
- DOI: https://dx.doi.org/10.5498/wjp.v15.i5.102552


