©The Author(s) 2025.
World J Psychiatry. Nov 19, 2025; 15(11): 108688
Published online Nov 19, 2025. doi: 10.5498/wjp.v15.i11.108688
Published online Nov 19, 2025. doi: 10.5498/wjp.v15.i11.108688
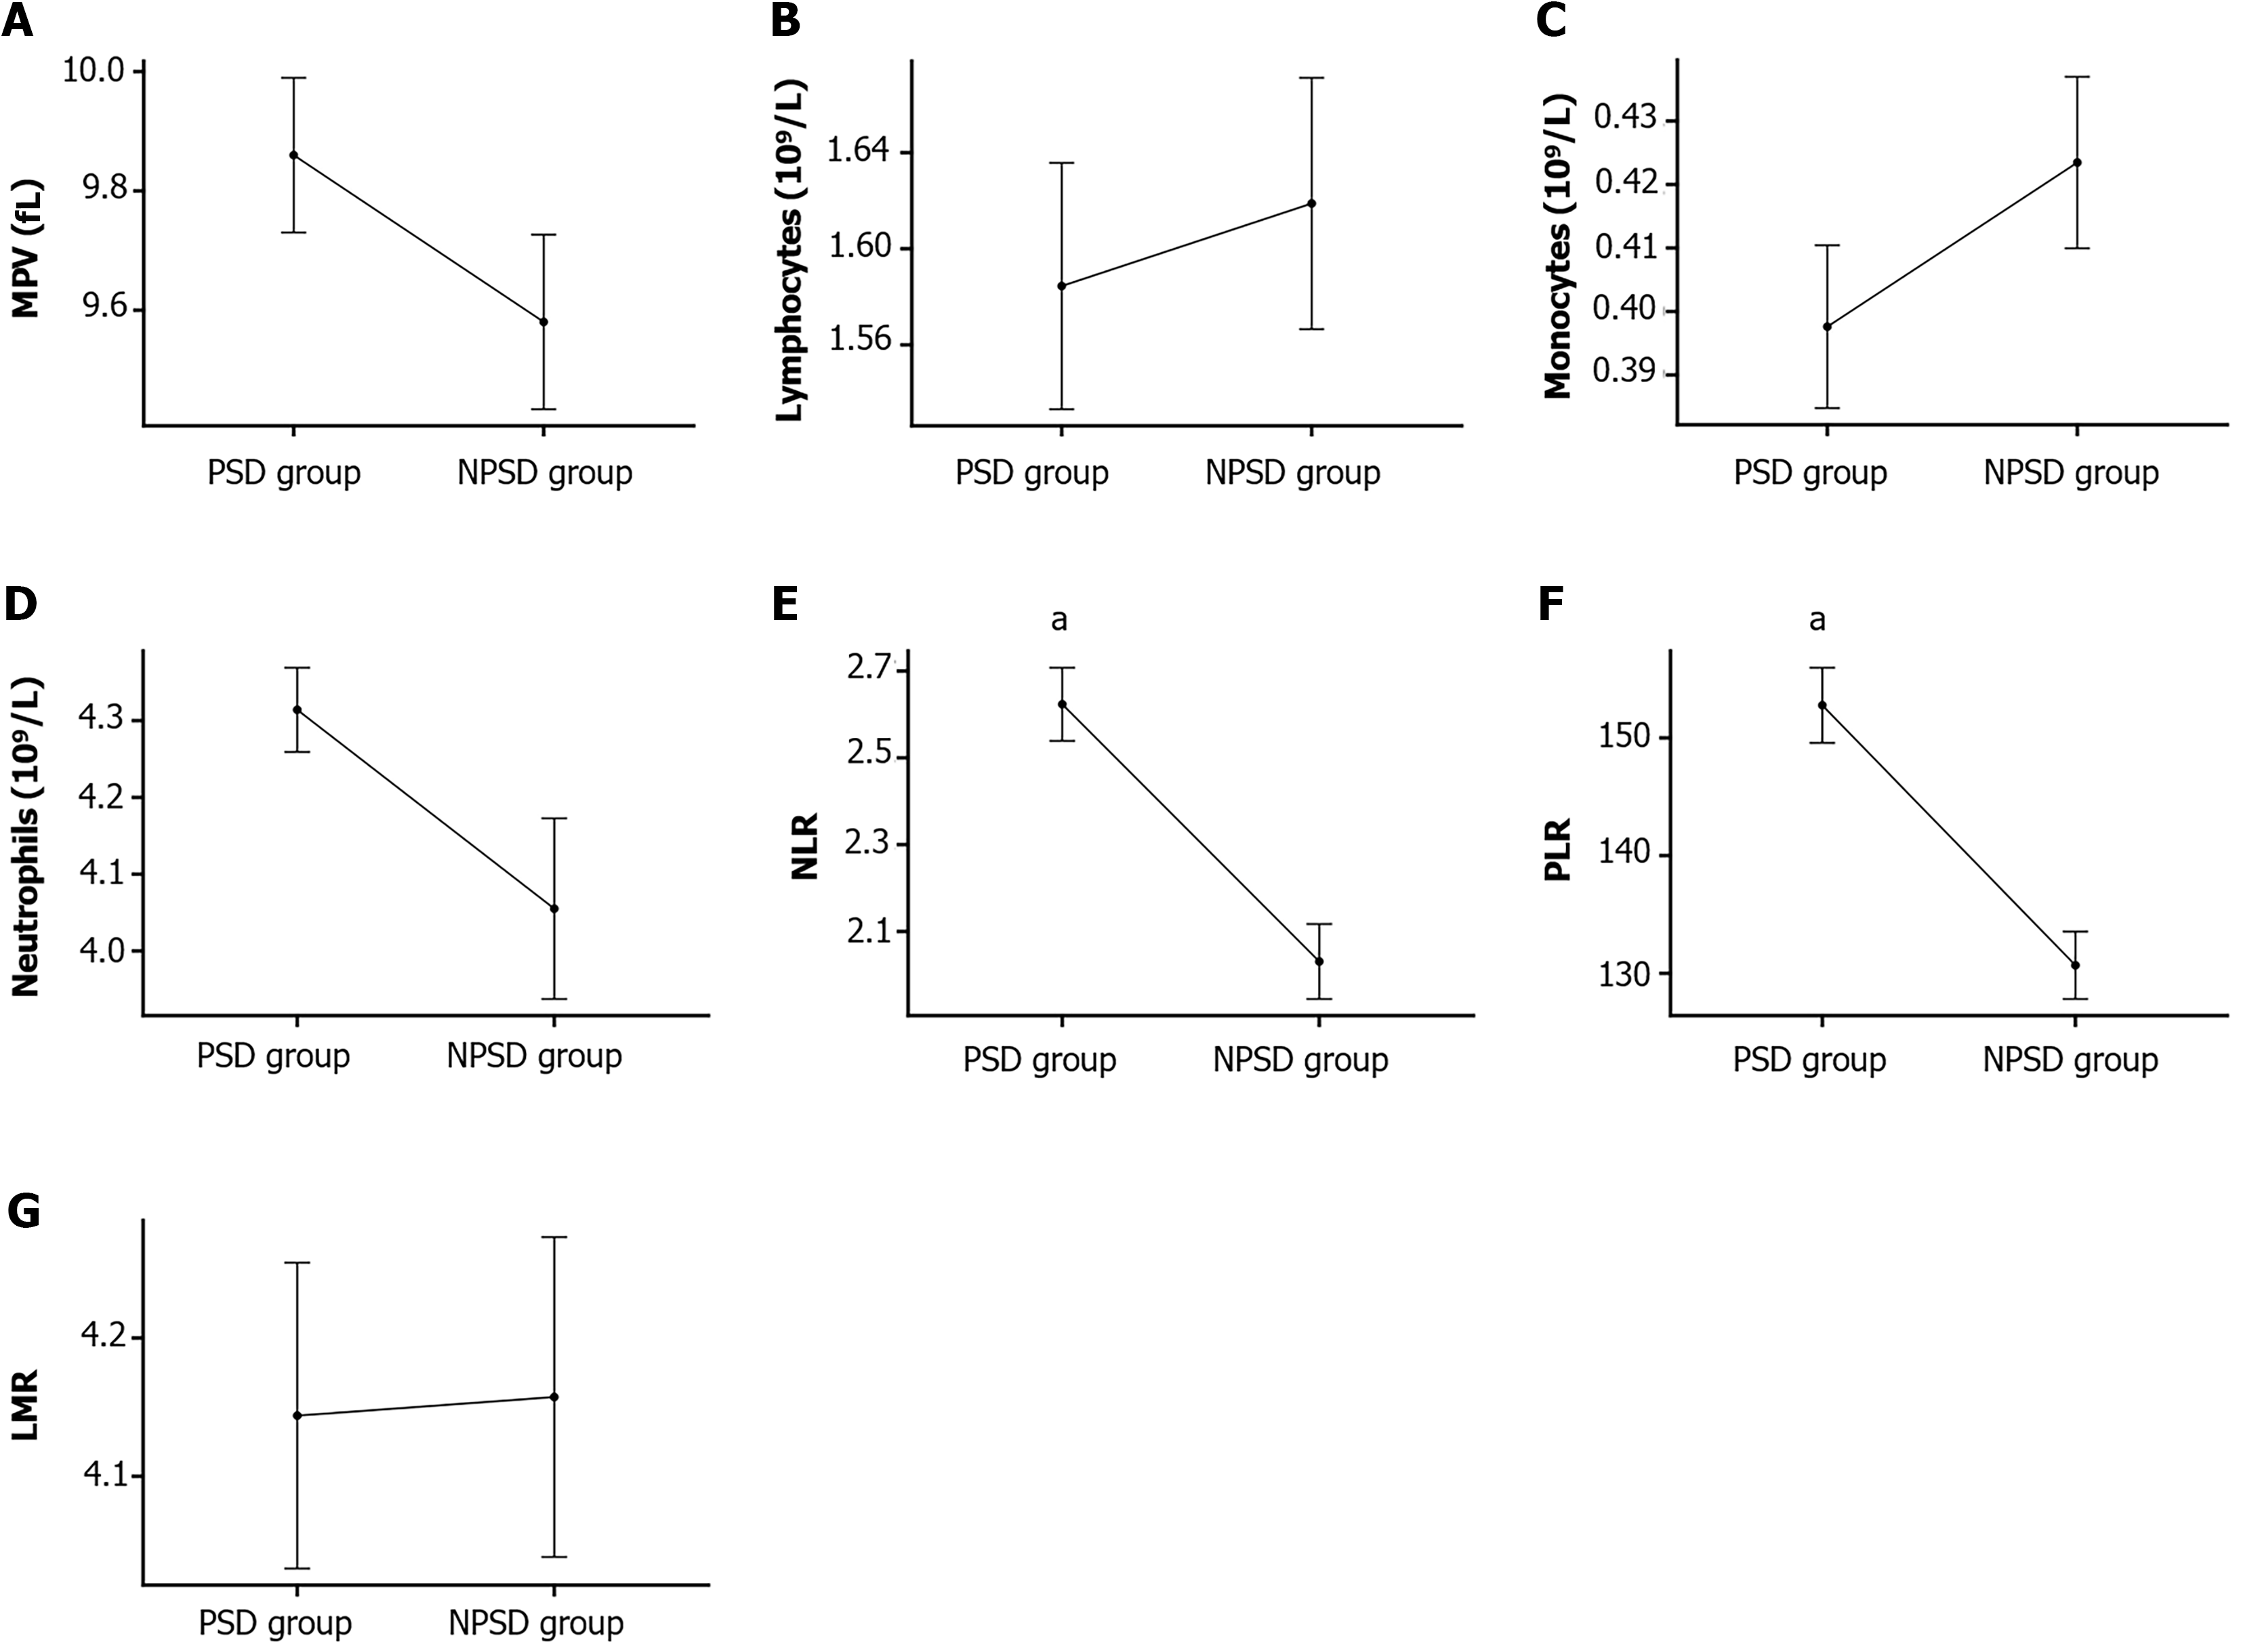
Figure 1 Blood biochemical parameters in the two patient groups.
A: Mean platelet volume comparison; B: Lymphocyte levels between groups; C: Monocyte counts in both cohorts; D: Neutrophil measurements across groups; E: Neutrophil-to-lymphocyte ratio analysis; F: Platelet-to-lymphocyte ratio evaluation; G: Lymphocyte-to-monocyte ratio assessment. aP < 0.001 vs the non-post-stroke depression group. MPV: Mean platelet volume; NLR: Neutrophil-to-lymphocyte ratio; PLR: Platelet-to-lymphocyte ratio; LMR: Lymphocyte-to-monocyte ratio.
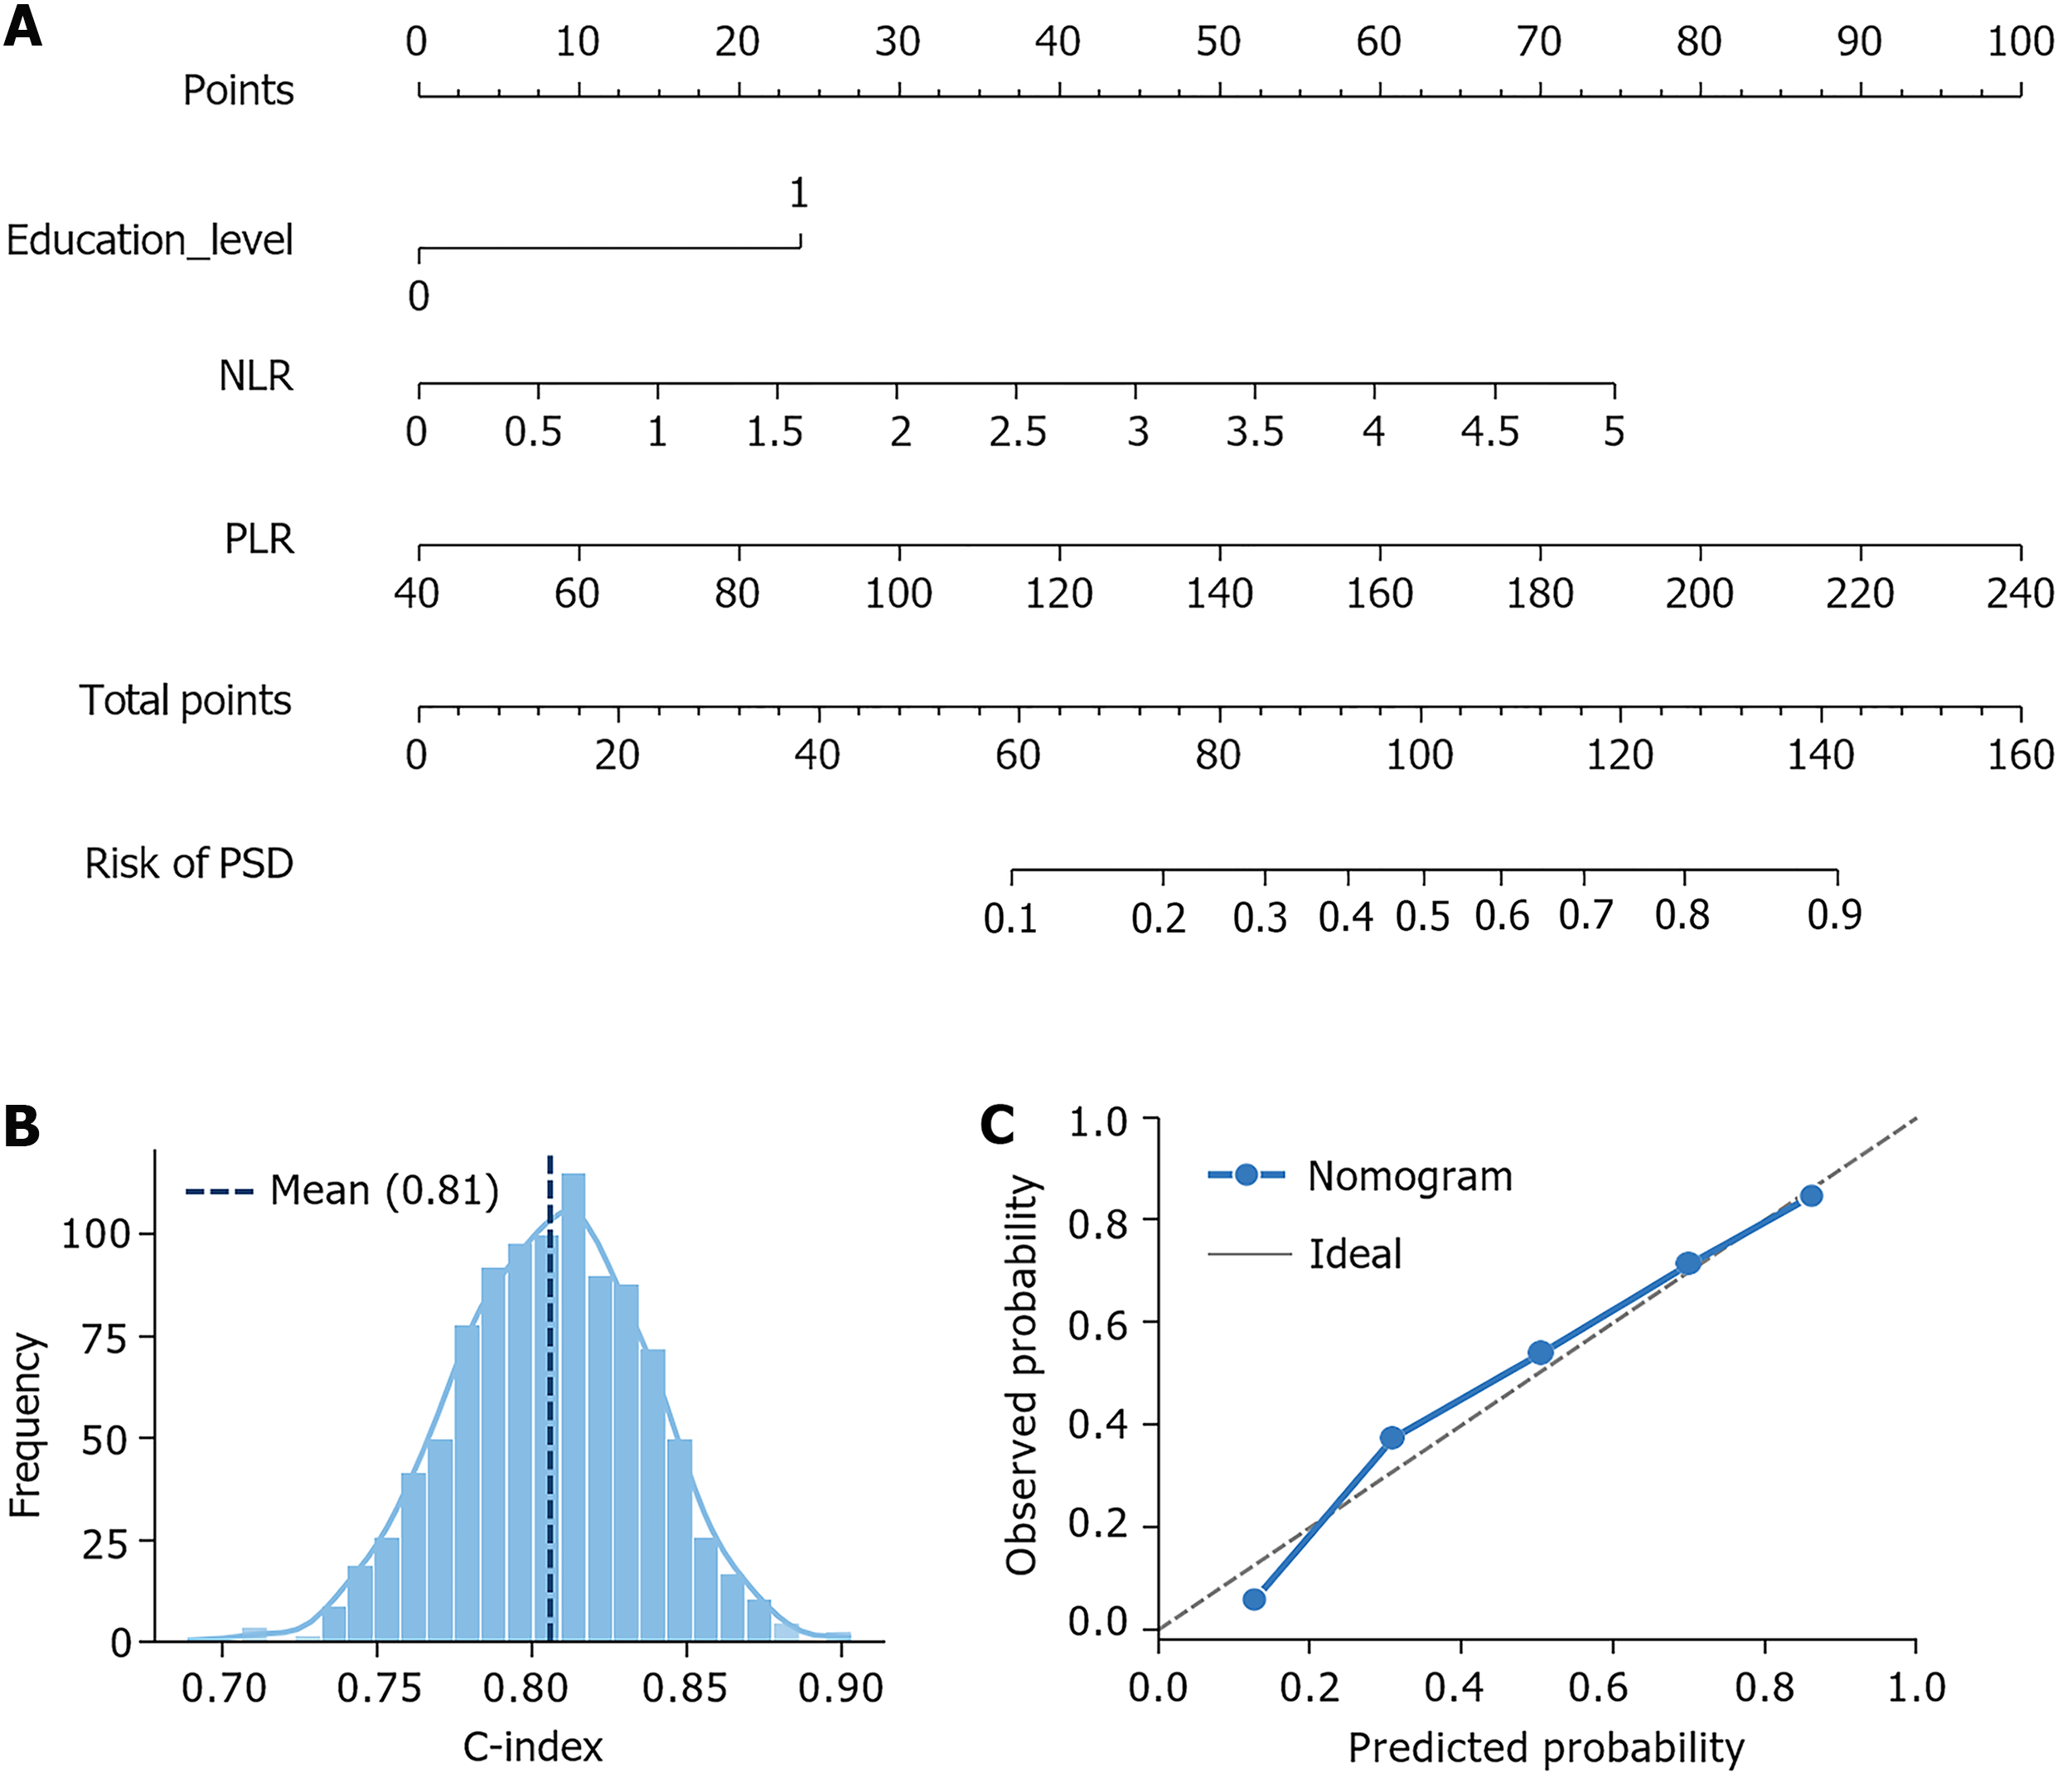
Figure 2 Nomogram visualization of the post-stroke depression risk-prediction model and performance validation.
A: Risk prediction nomogram for post-stroke depression; B: Internal validation with 1000 bootstrap replicates; C: Calibration curve evaluation. Severity means severity of neurological impairment. PSD: Post-stroke depression; NLR: Neutrophil-to-lymphocyte ratio; PLR: Platelet-to-lymphocyte ratio.
- Citation: Han Z, Zhang DD, Li NN. Influencing factors and construction of a nomogram for post-stroke depression in patients with chronic stroke. World J Psychiatry 2025; 15(11): 108688
- URL: https://www.wjgnet.com/2220-3206/full/v15/i11/108688.htm
- DOI: https://dx.doi.org/10.5498/wjp.v15.i11.108688


