©The Author(s) 2025.
World J Psychiatry. Nov 19, 2025; 15(11): 106164
Published online Nov 19, 2025. doi: 10.5498/wjp.v15.i11.106164
Published online Nov 19, 2025. doi: 10.5498/wjp.v15.i11.106164
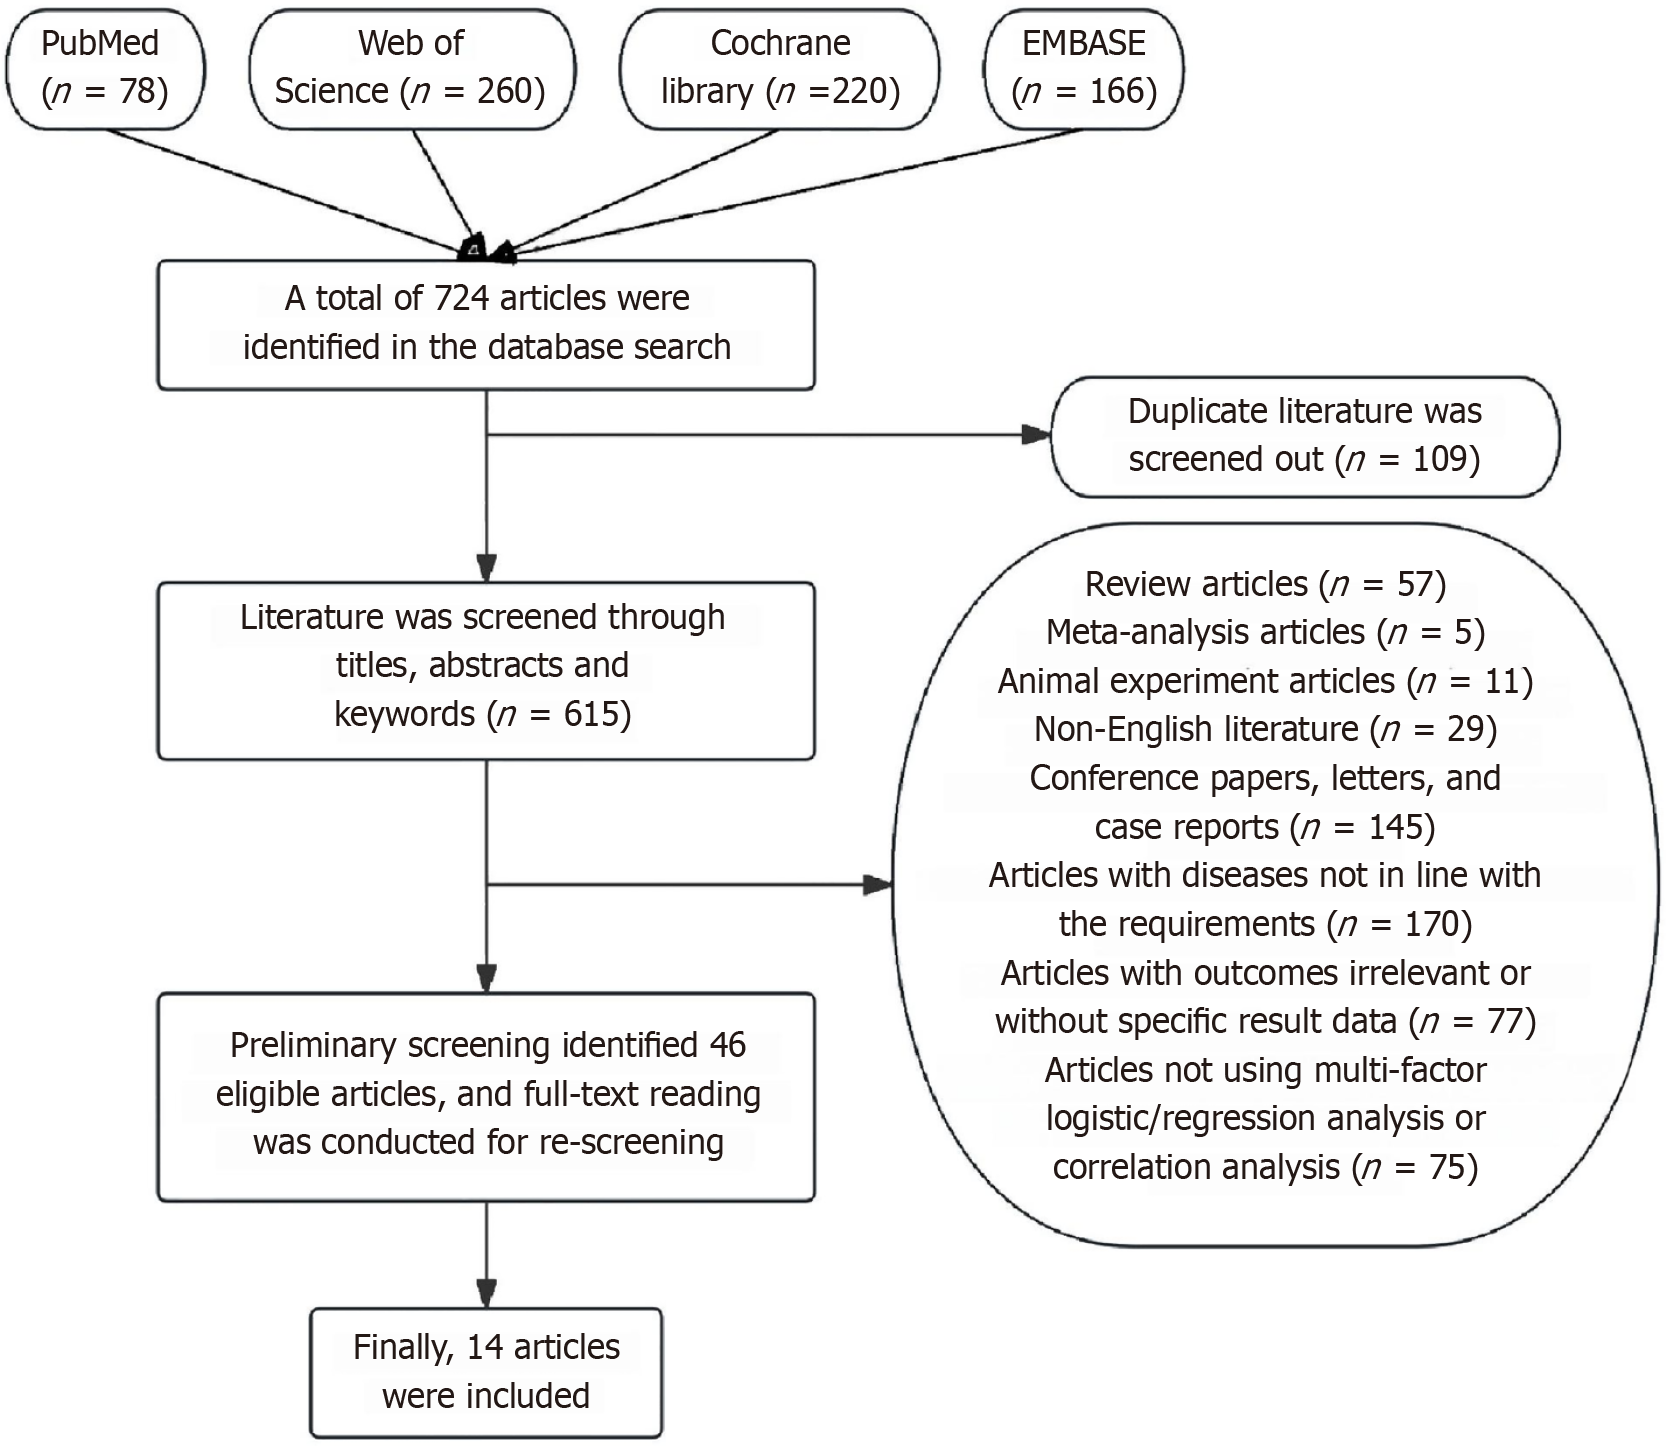
Figure 1
Flowchart of literature inclusion screening.
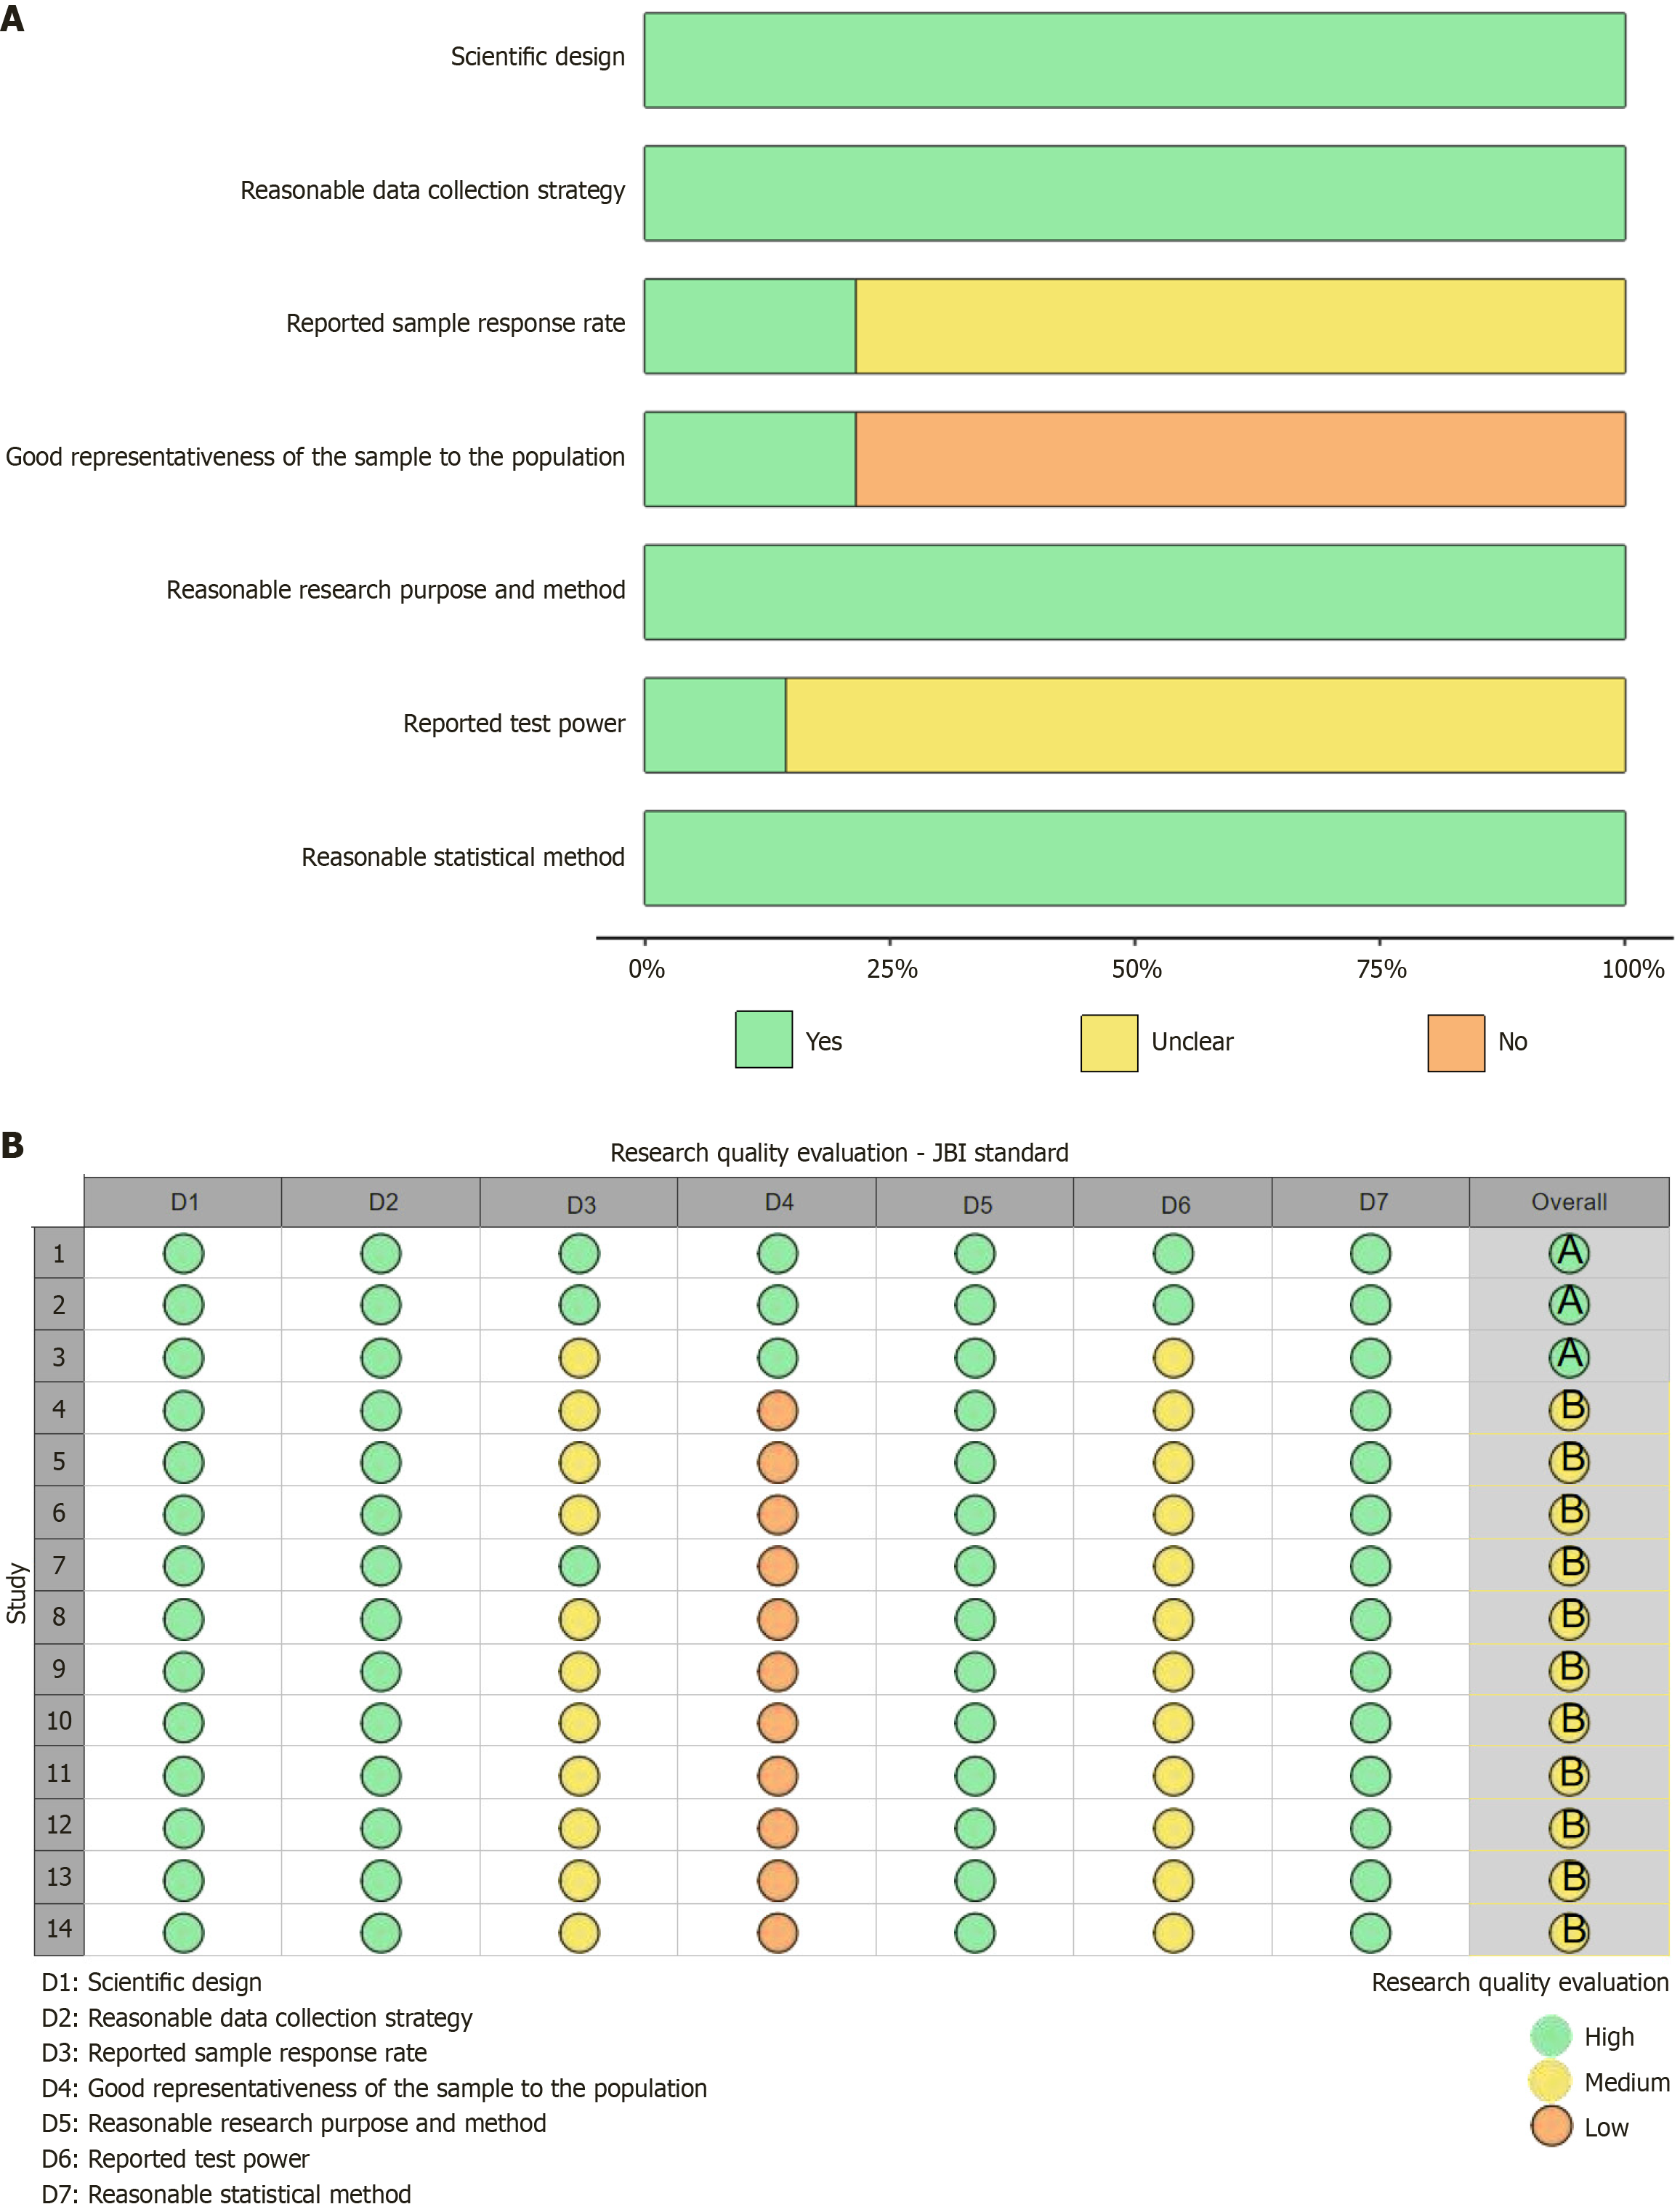
Figure 2 Results and evaluation table of literature quality assessment.
A: Situation of literature quality assessment; B: Literature quality evaluation table. Green indicates low risk, yellow indicates uncertainty, and orange indicates high risk. Green is marked as 1 point, indicating "yes"; orange is marked as 0 points, indicating "no"; yellow is marked as 0.5 points, indicating "not clear". This scale is highly flexible, and users can adjust it according to the actual research situation. The total score of this scale is 7.0 points. Literature with a quality score of 6.0-7.0 points is of grade A (high-quality literature), literature with a score of 4.0-5.5 points is of grade B (medium-quality literature), and literature with a score of less than 4.0 points is of grade C (low-quality literature).
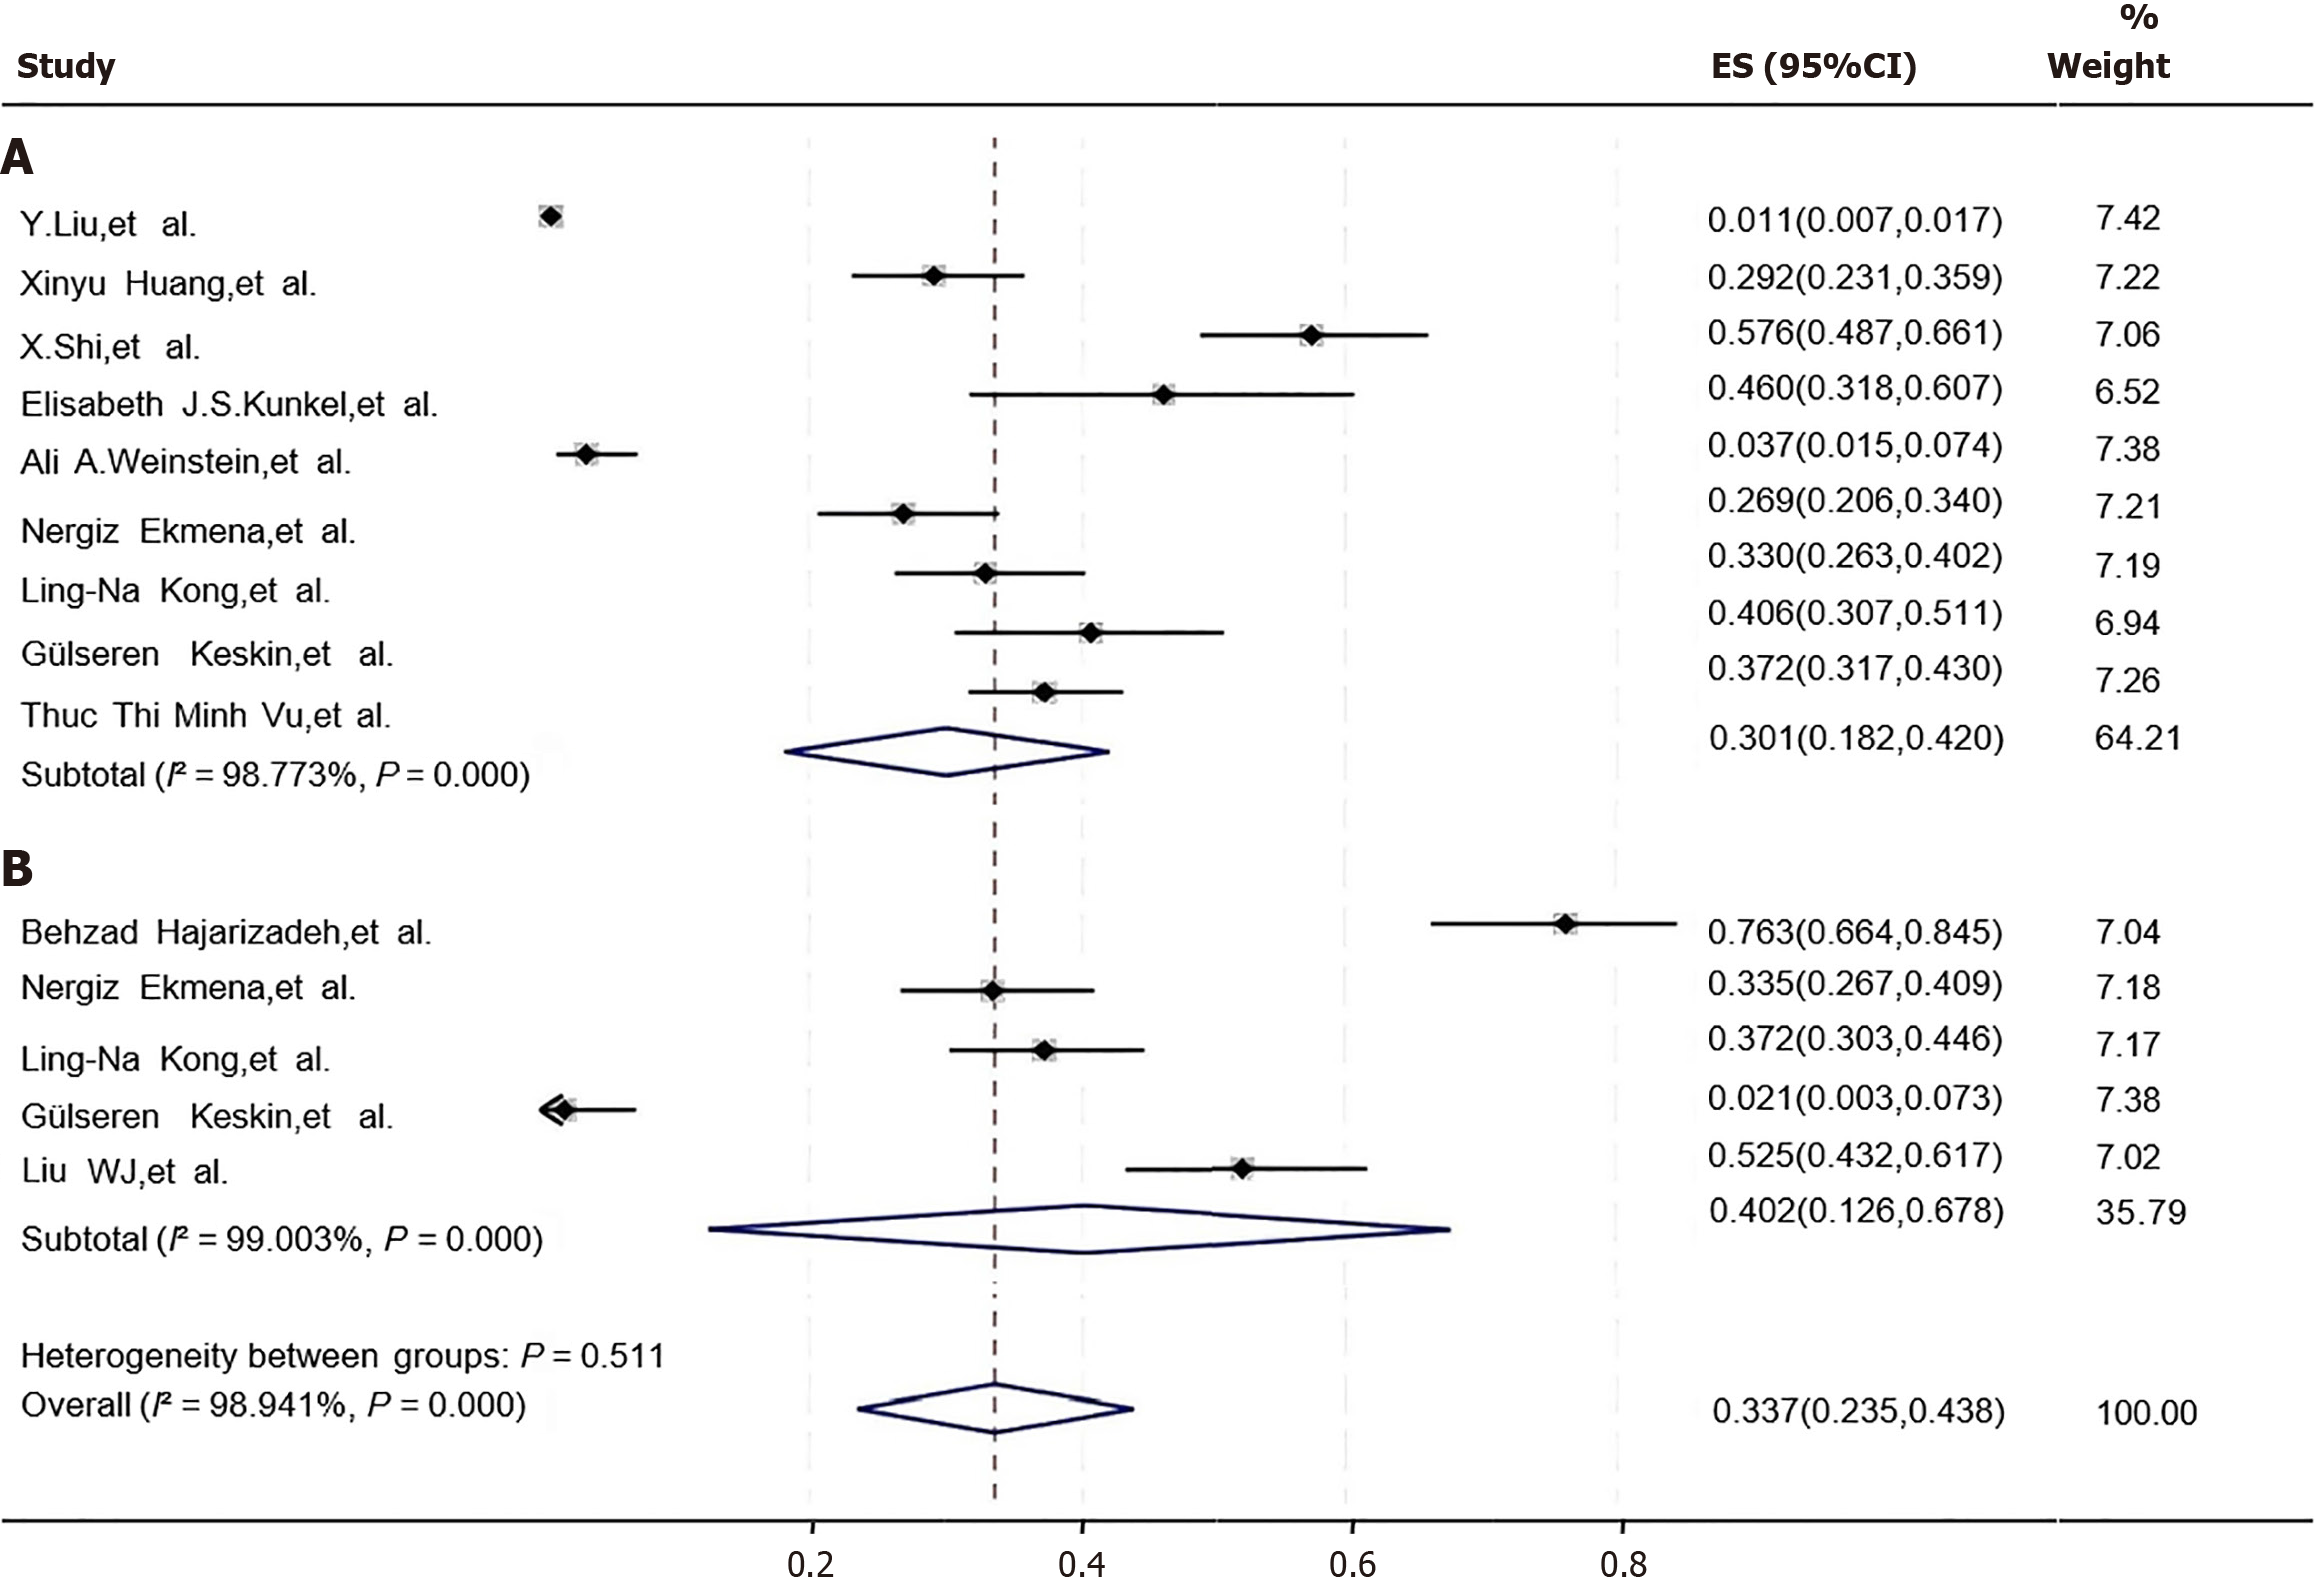
Figure 3 Incidence of comorbid negative emotions in chronic hepatitis B patients.
A: Incidence of comorbid depression; B: Incidence of comorbid anxiety. 95%CI: 95% confidence interval.
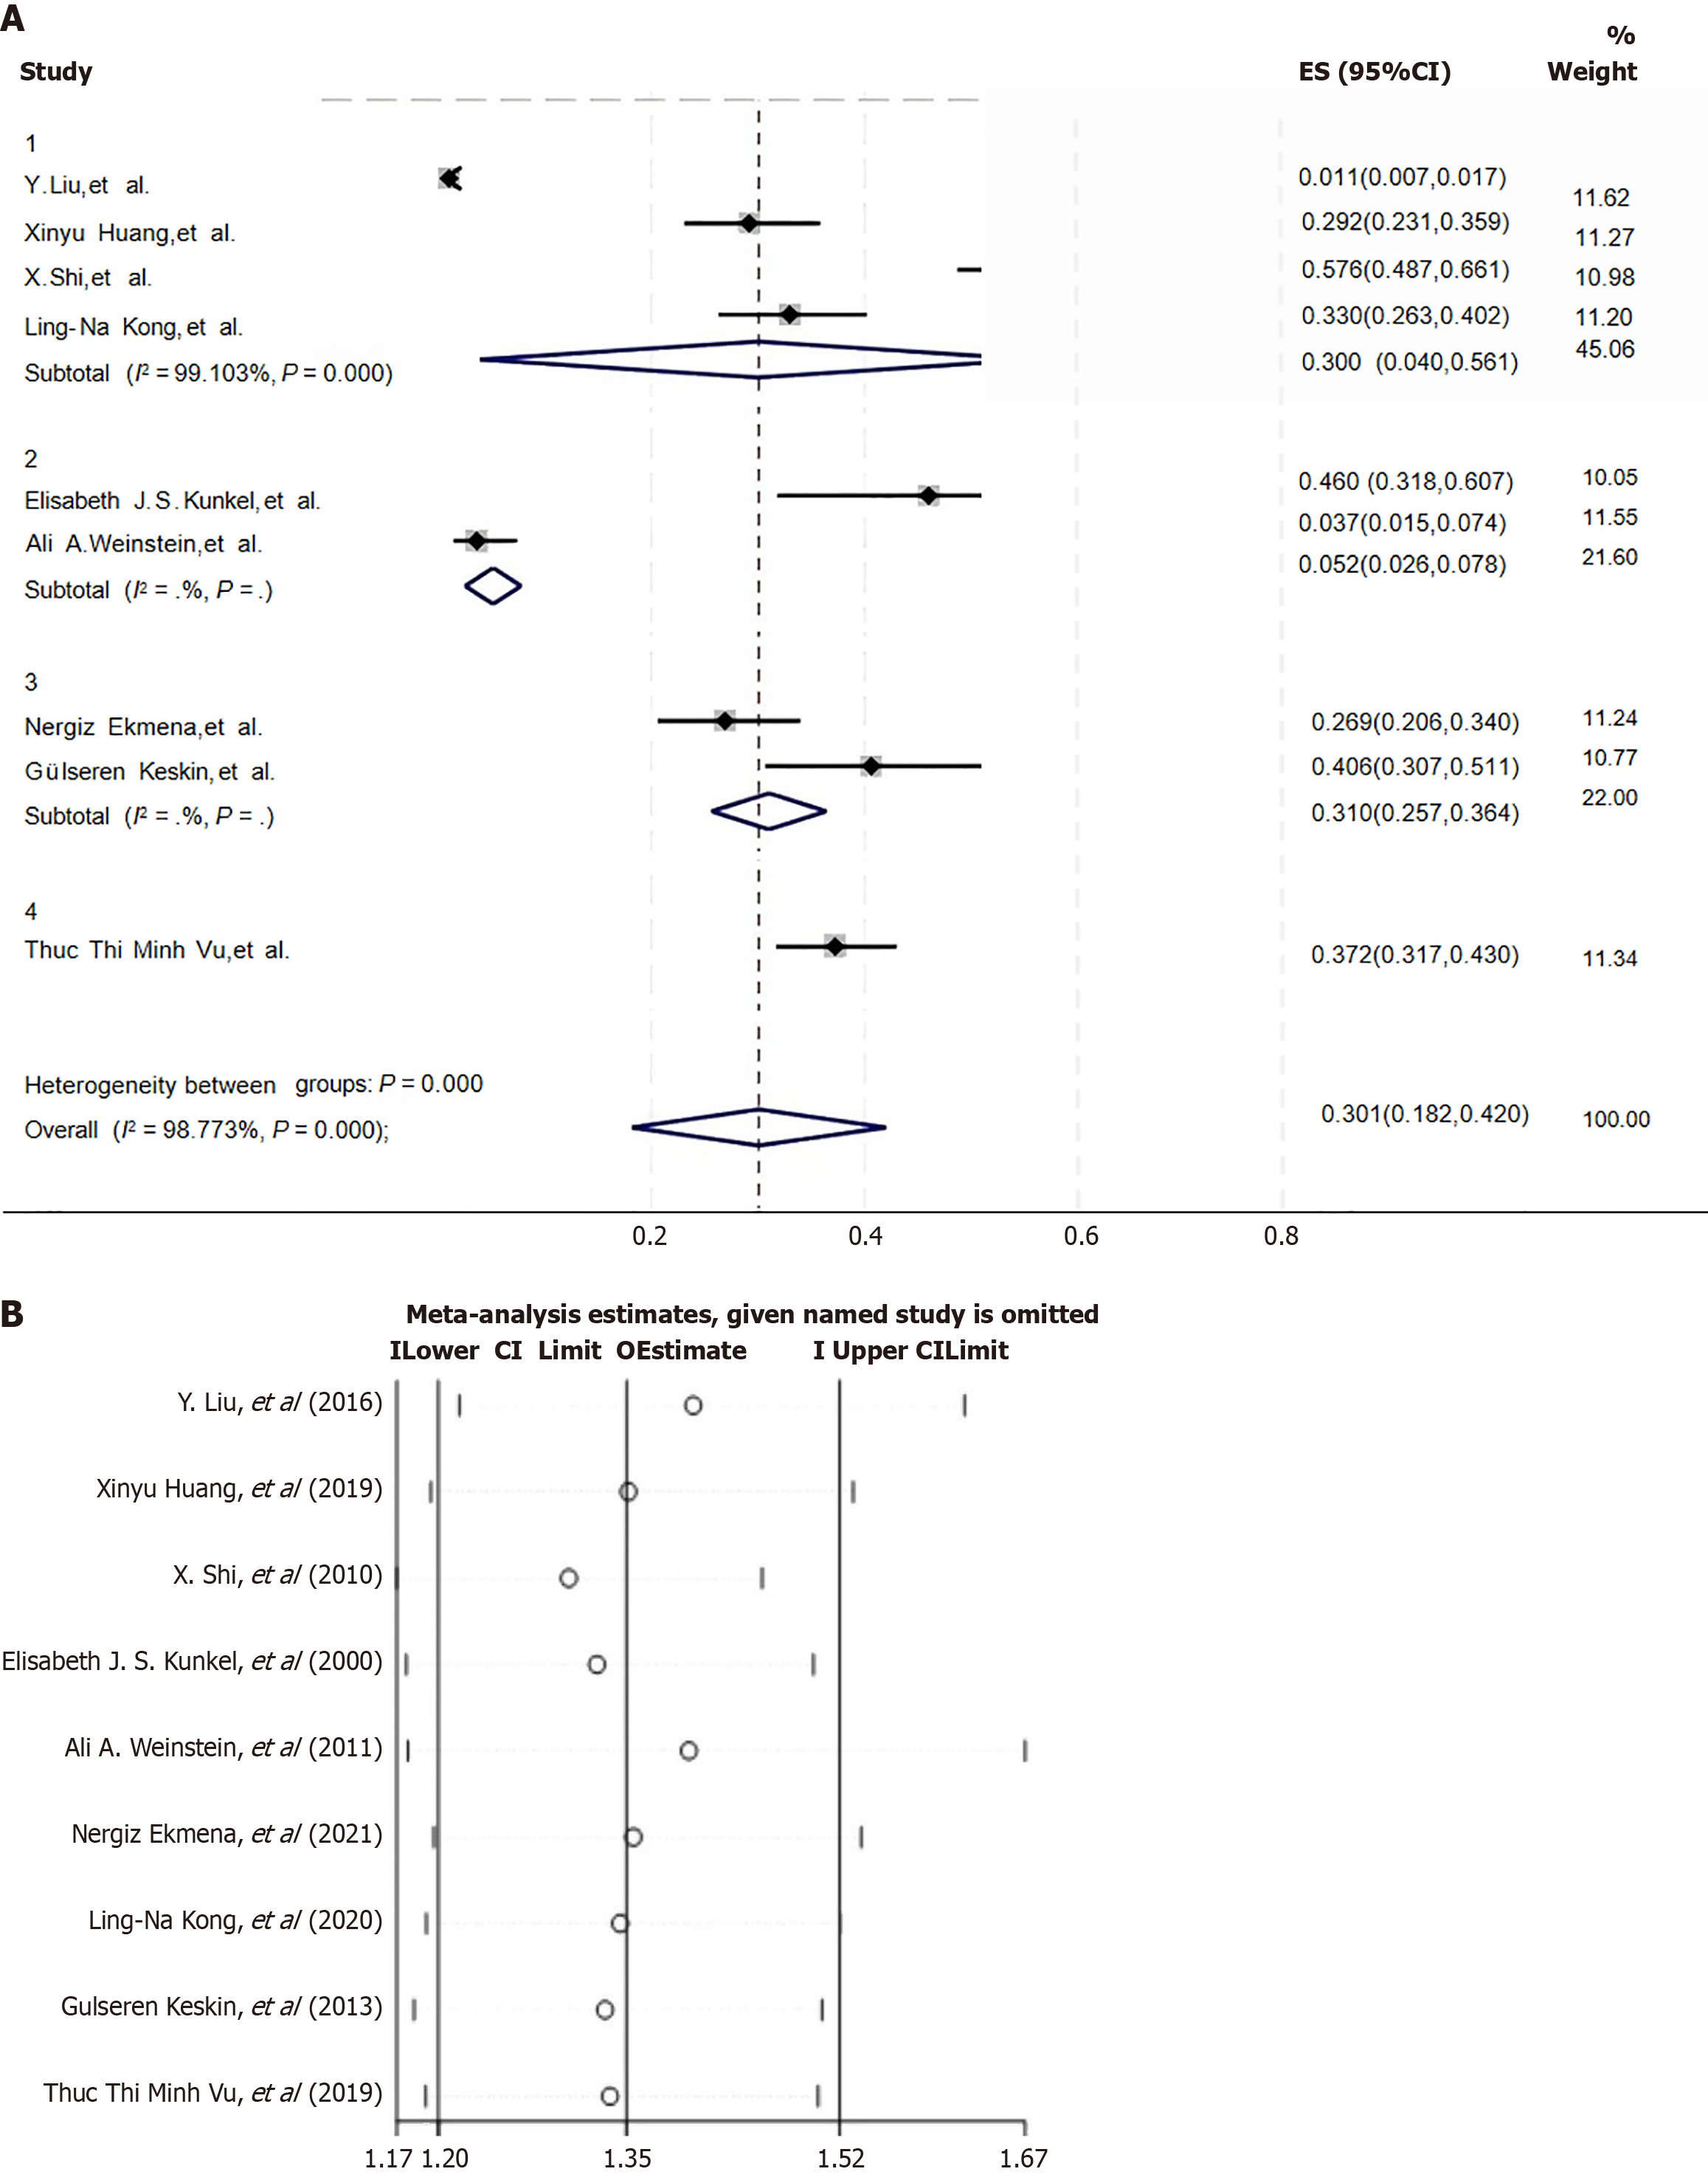
Figure 4 Regional subgroup analysis and sensitivity analysis of depression incidence in patients with chronic hepatitis B.
A: Regional subgroup analysis of the incidence of depression in chronic hepatitis B patients (Group 1: China; Group 2: The United States; Group 3: Turkey; and Group 4: Vietnam); B: Sensitivity analysis of the incidence of depression in chronic hepatitis B patients. 95%CI: 95% confidence interval.
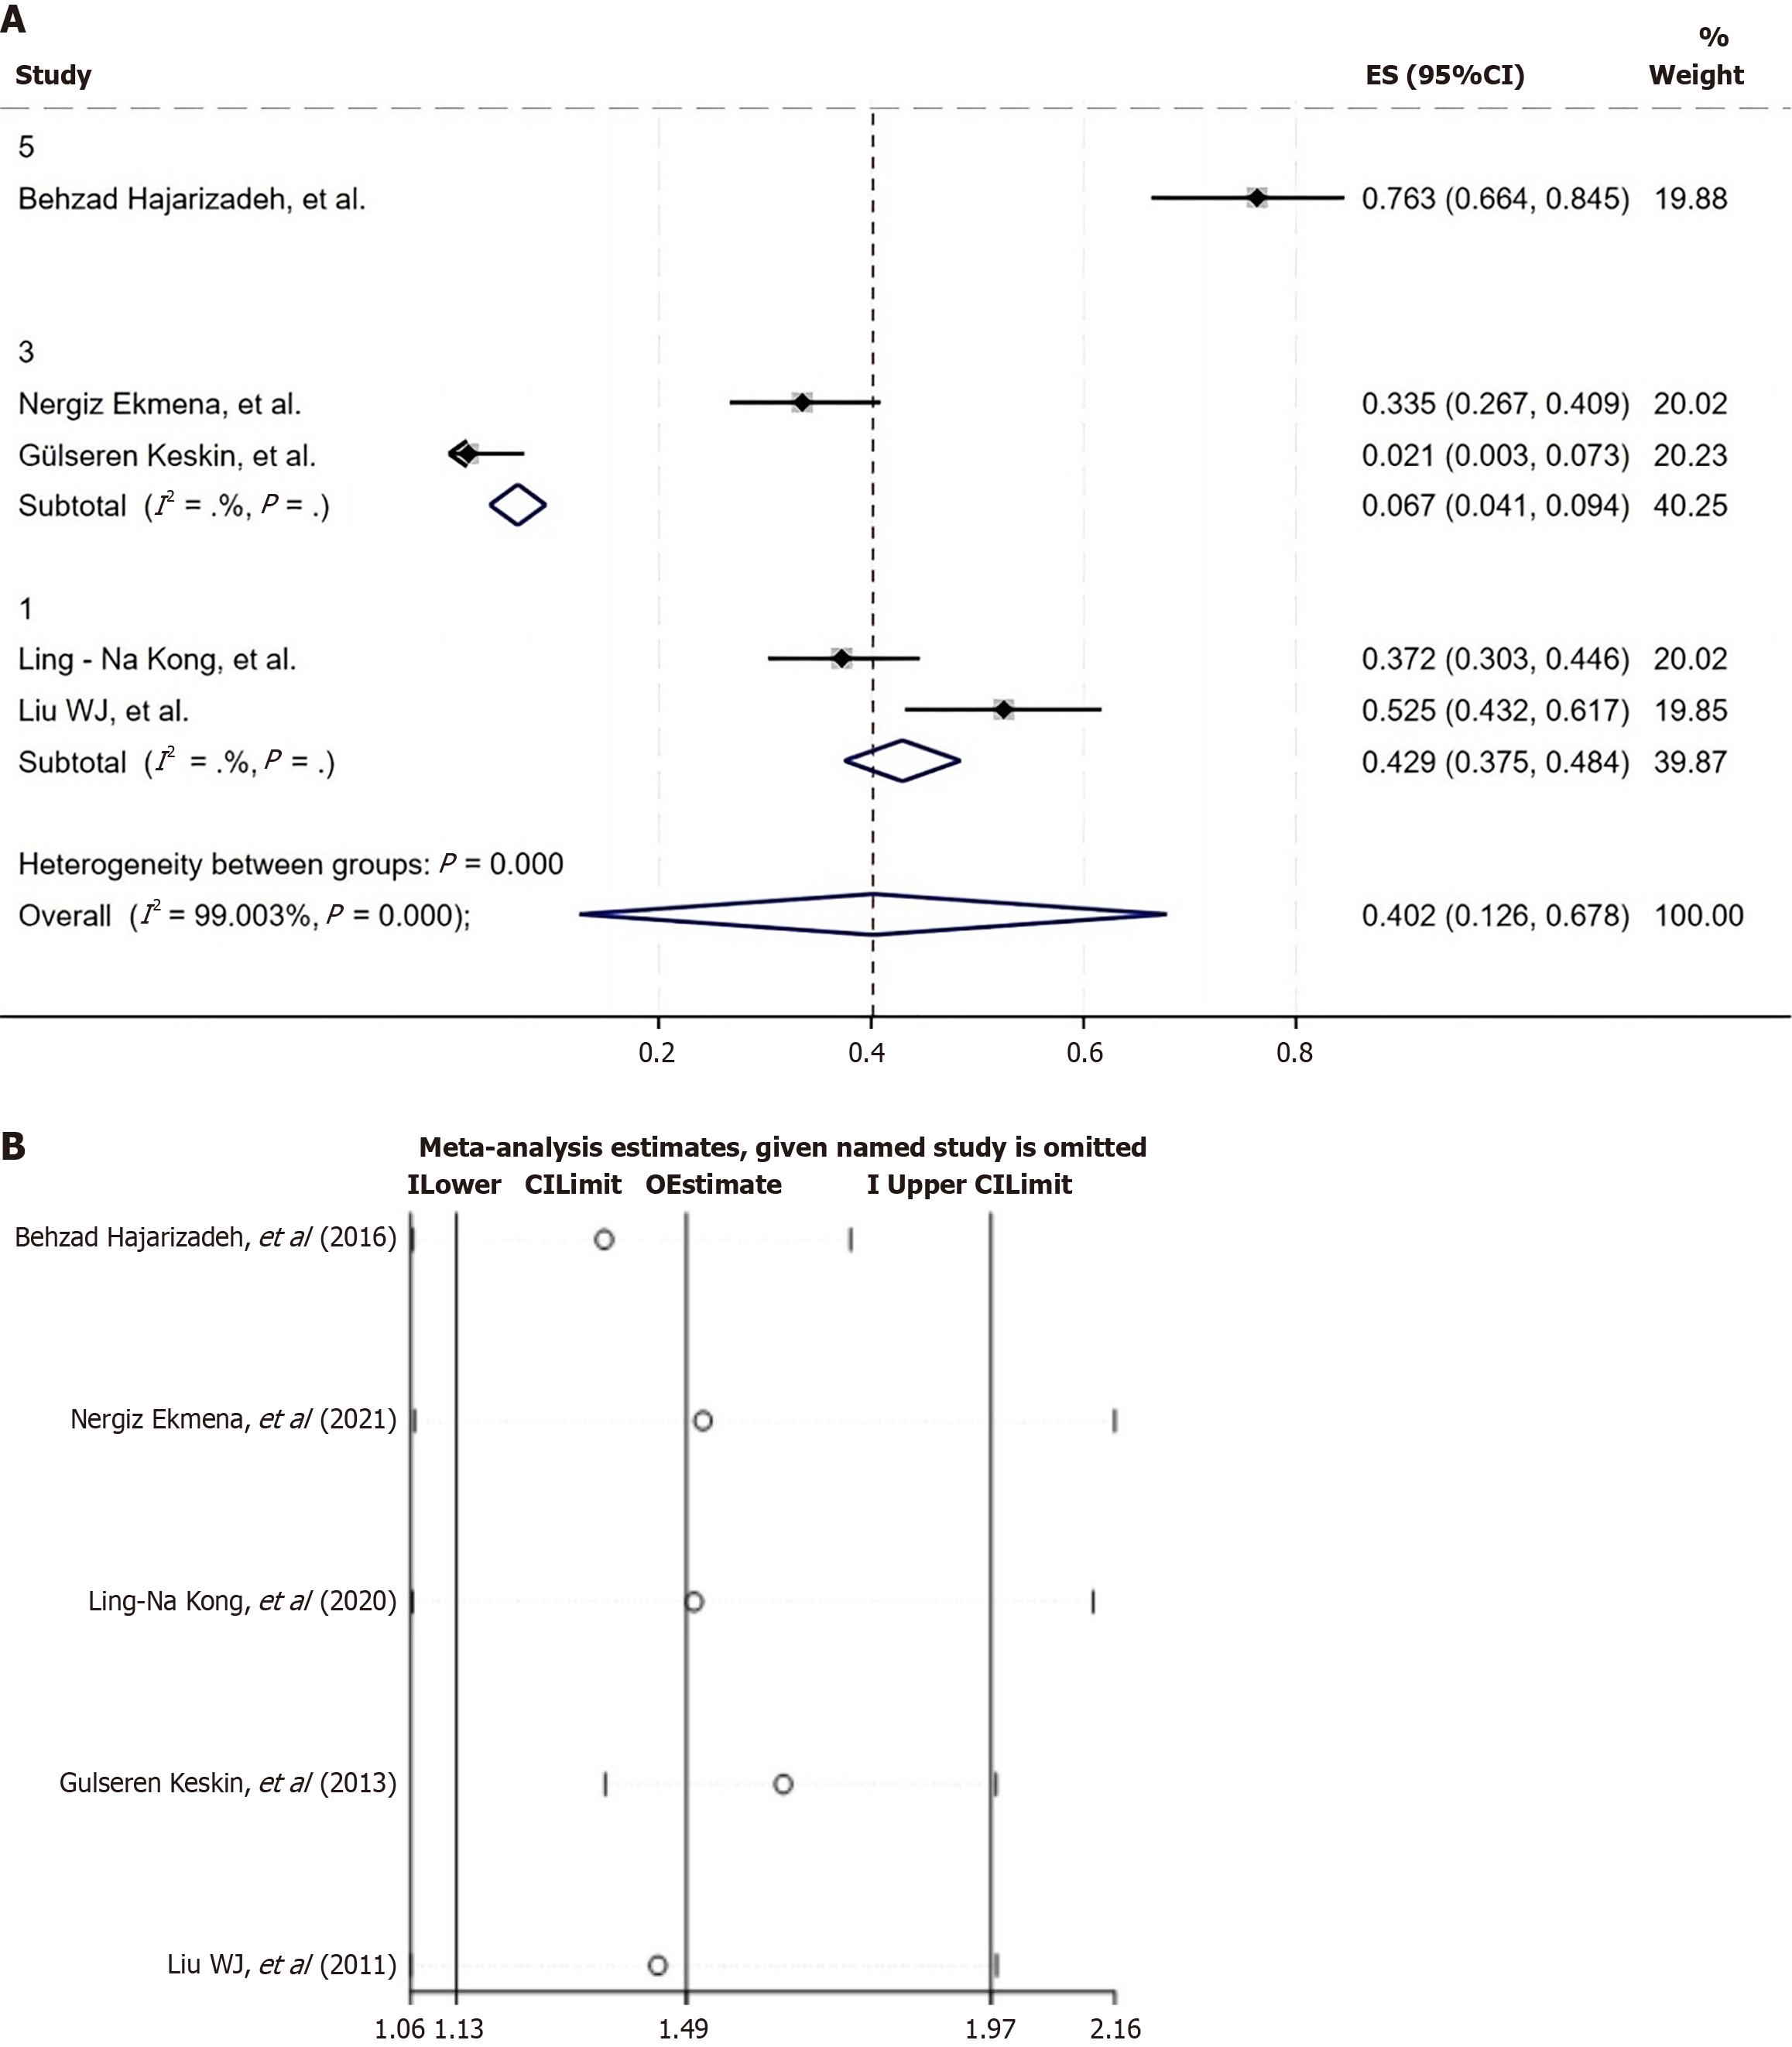
Figure 5 Regional subgroup analysis and sensitivity analysis of anxiety incidence in patients with chronic hepatitis B.
A: Regional subgroup analysis of the incidence of anxiety in chronic hepatitis B patients (Group 1: China; Group 3: Turkey; Group 5: Australia); B: Sensitivity analysis of the incidence of anxiety in chronic hepatitis B patients. 95%CI: 95% confidence interval.
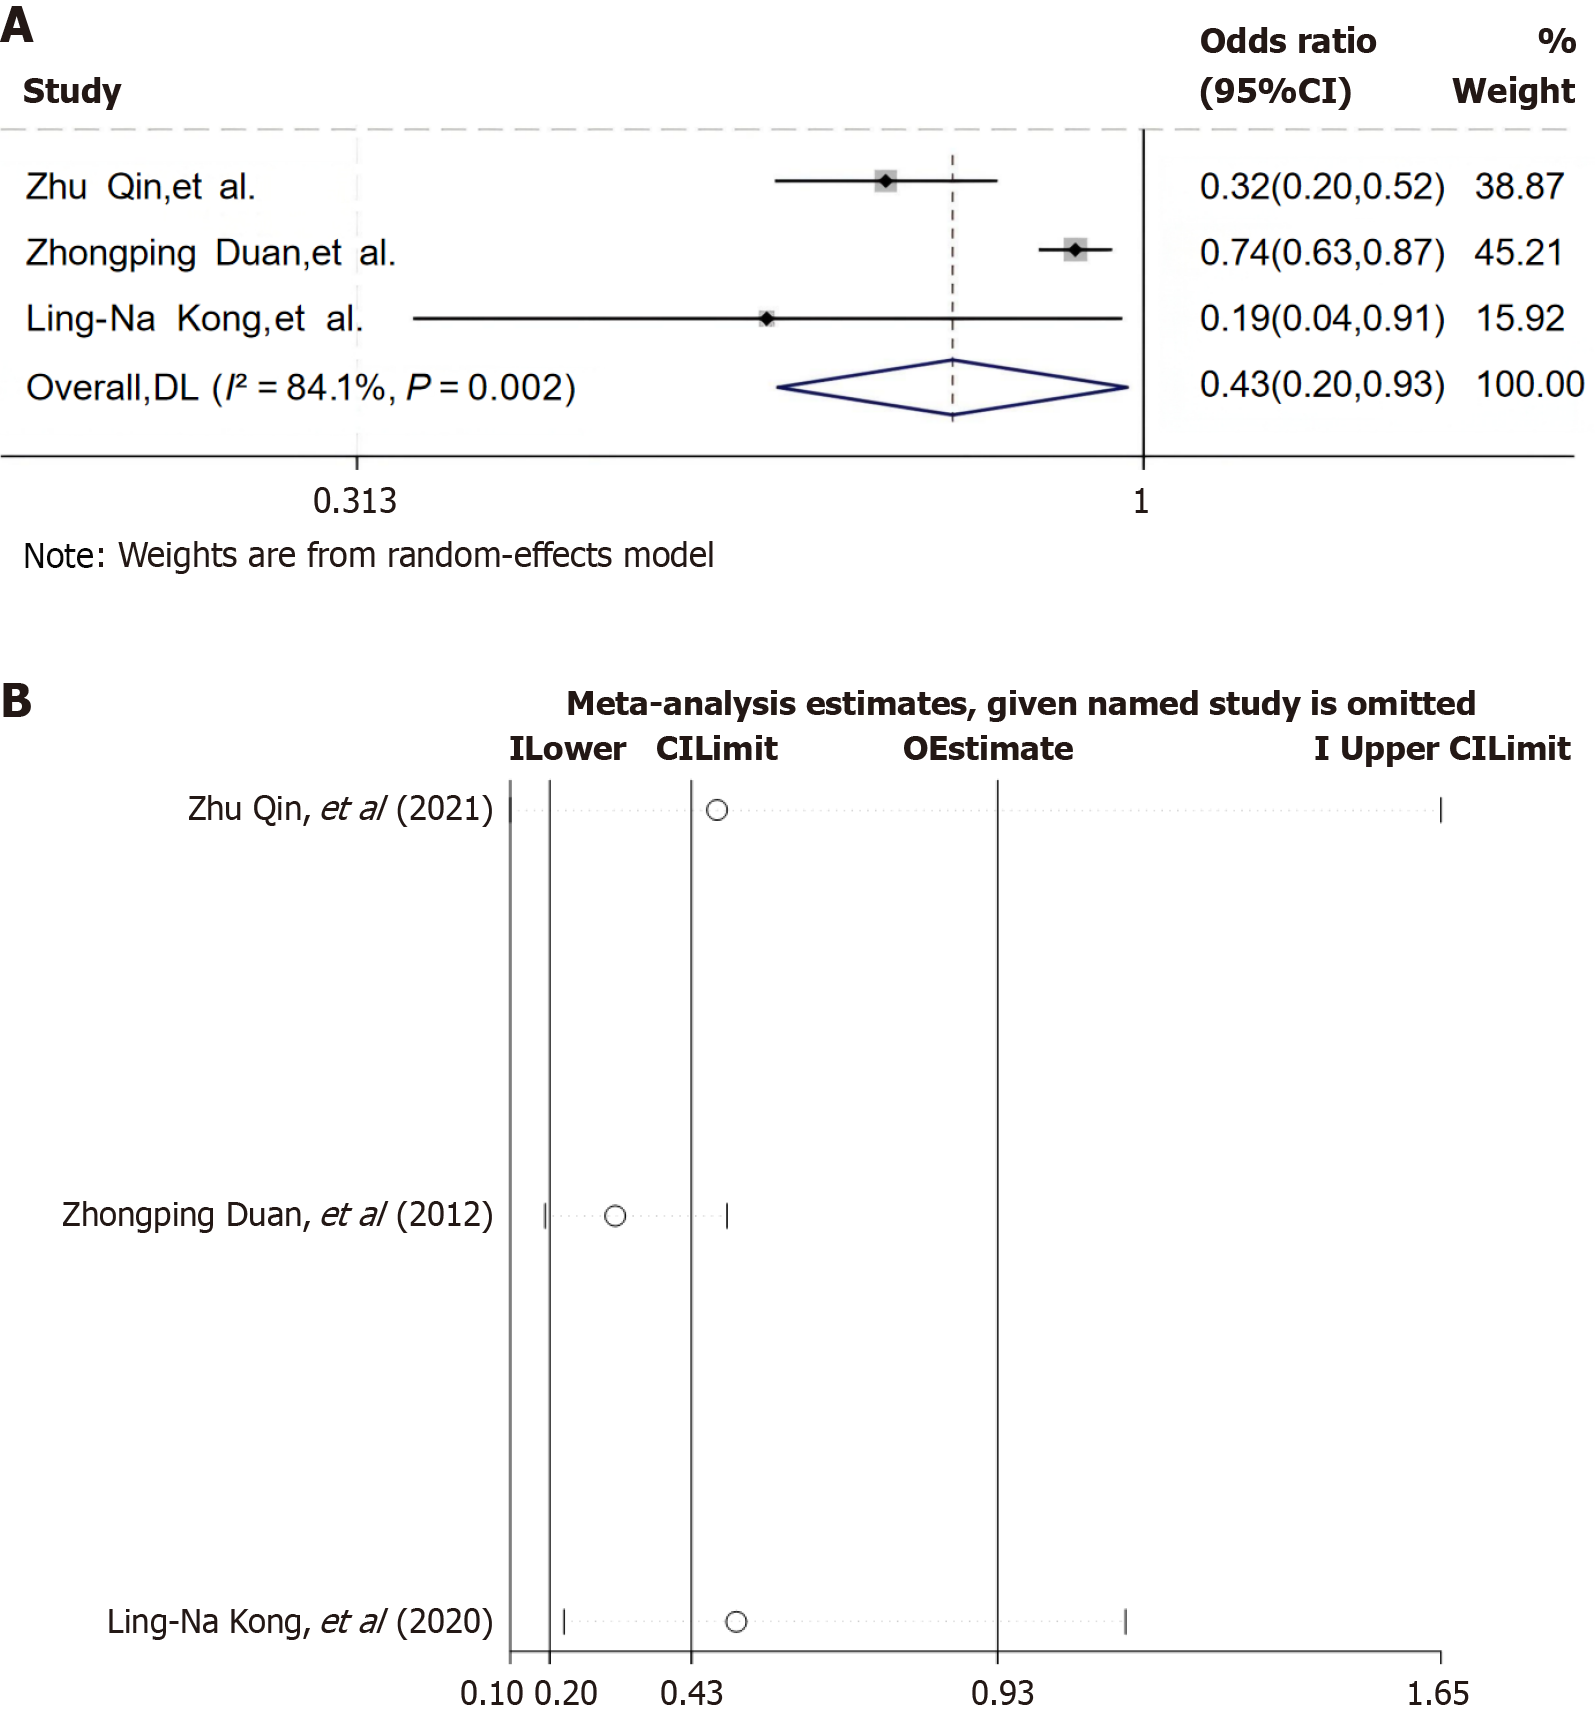
Figure 6 Forest plot and sensitivity analysis of the association between educational level and comorbid depression/anxiety in patients with chronic hepatitis B.
A: Forest map for education level analysis; B: Sensitivity analysis of educational level analysis. 95%CI: 95% confidence interval.
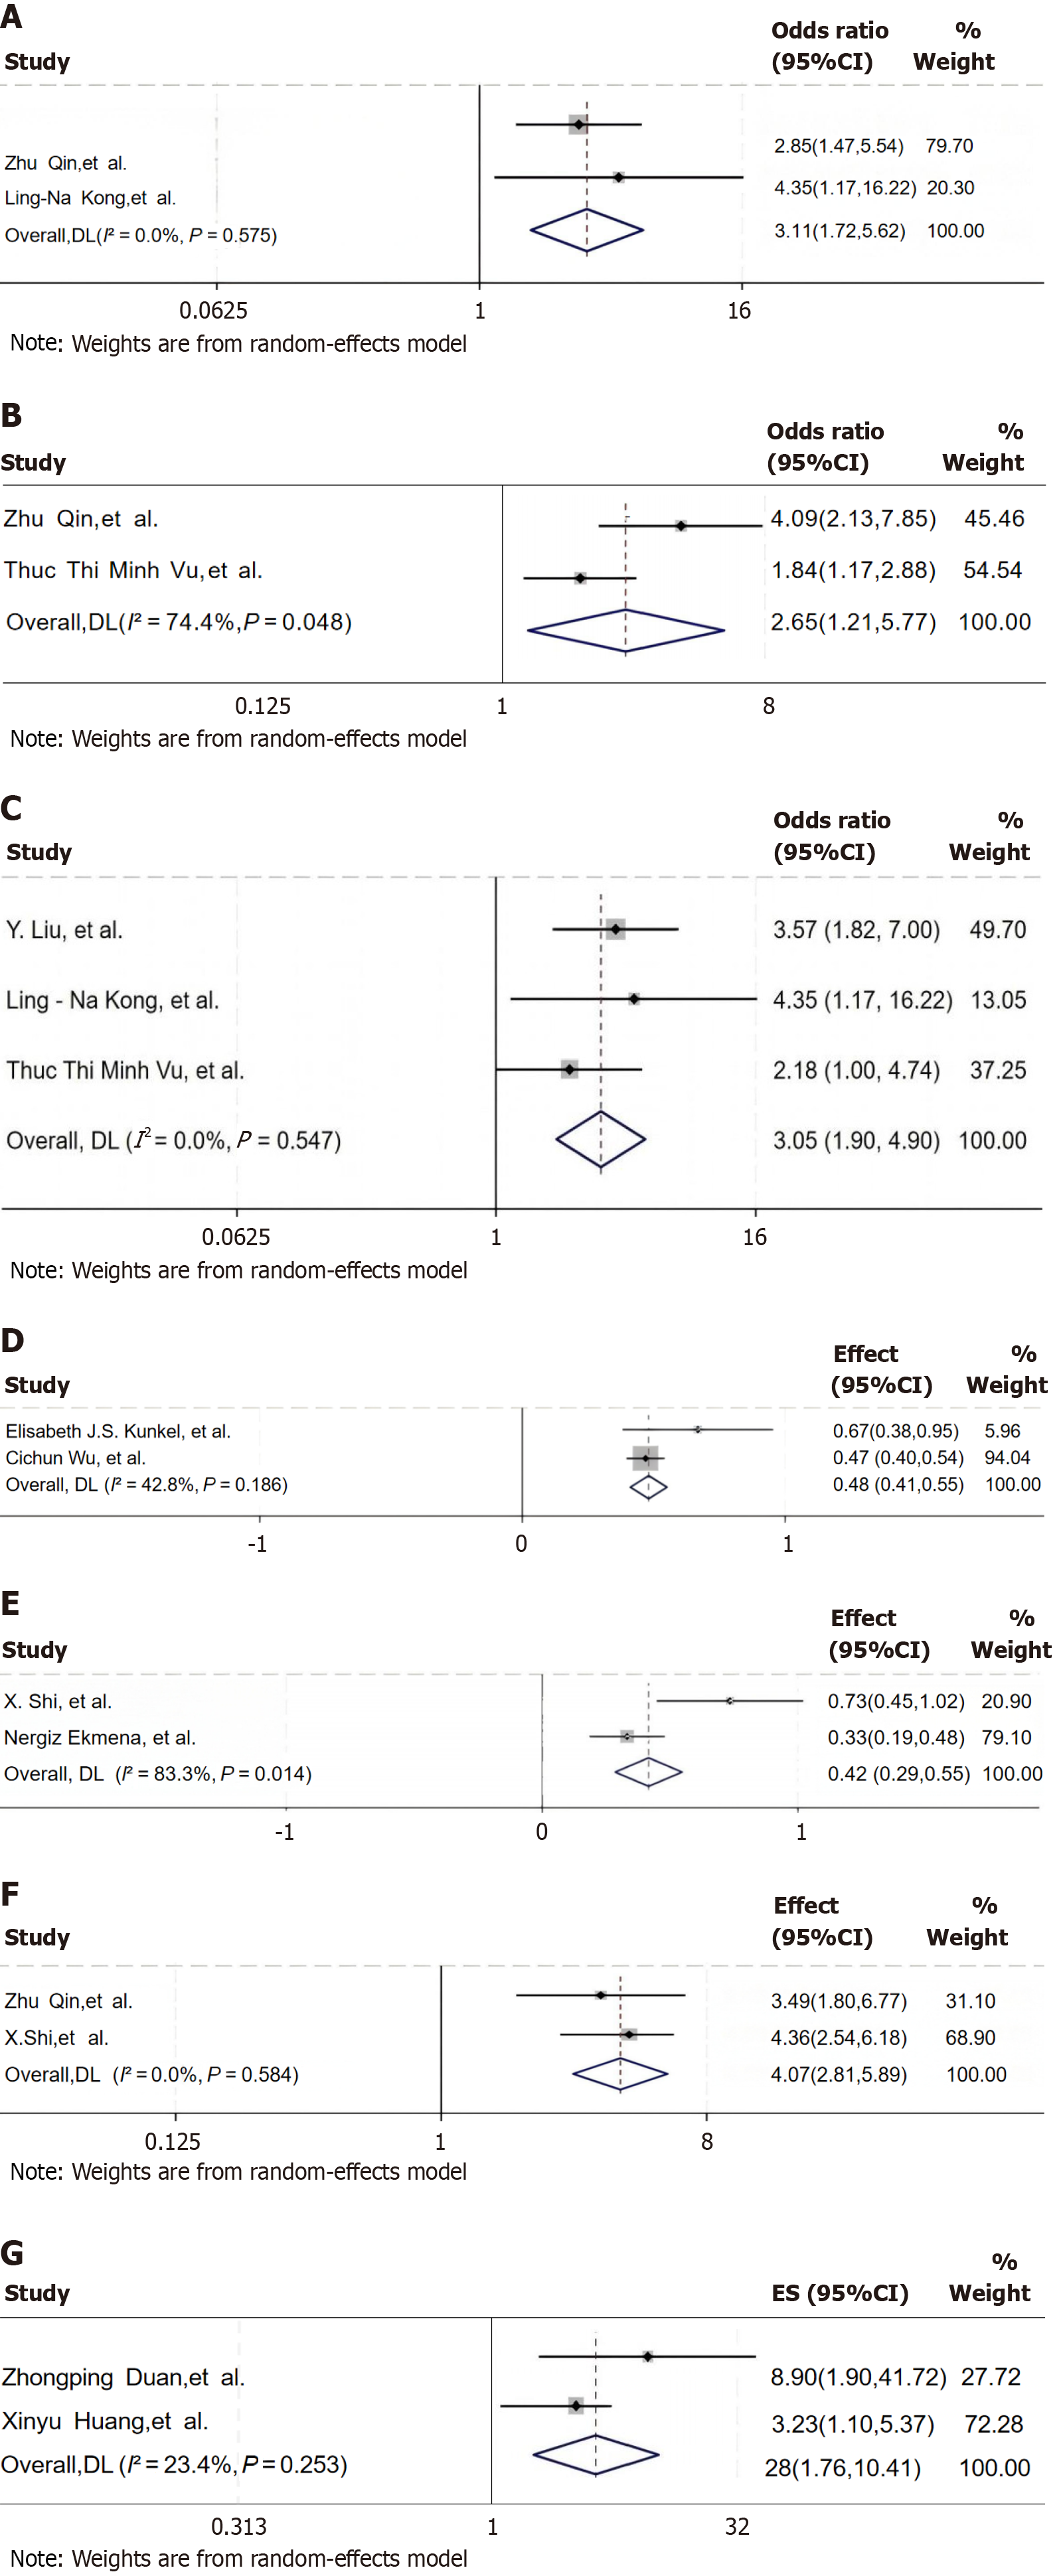
Figure 7 Forest plots of associations between key factors and comorbid depression/anxiety in patients with chronic hepatitis B.
A-G: Forest plot of treatment duration (A), comorbidities (B), age (C), sleep quality (D), emotional stability (E), the number of relapses (F), and hepatitis degree (G) analysis. 95%CI: 95% confidence interval.
- Citation: Guo L, He LX, Wan PQ, Zhen XM, Xiao F, Wu WB, Su MH, Gao BH, Liu ZH. Meta-analysis of factors associated with the incidence of comorbid depression and anxiety in patients with chronic hepatitis B. World J Psychiatry 2025; 15(11): 106164
- URL: https://www.wjgnet.com/2220-3206/full/v15/i11/106164.htm
- DOI: https://dx.doi.org/10.5498/wjp.v15.i11.106164


