Copyright
©The Author(s) 2025.
World J Psychiatry. Oct 19, 2025; 15(10): 108491
Published online Oct 19, 2025. doi: 10.5498/wjp.v15.i10.108491
Published online Oct 19, 2025. doi: 10.5498/wjp.v15.i10.108491
Figure 1 Comparison of parental baseline characteristics between mental retardation and control groups before and after matching.
aP < 0.05. A: Sex; B: Mean age; C: Education level; D: Family income; E: Employment status; F: Residential location; G: Payment method; H: Only child status; I: Child sex; J: Child age. MR: Mental retardation.
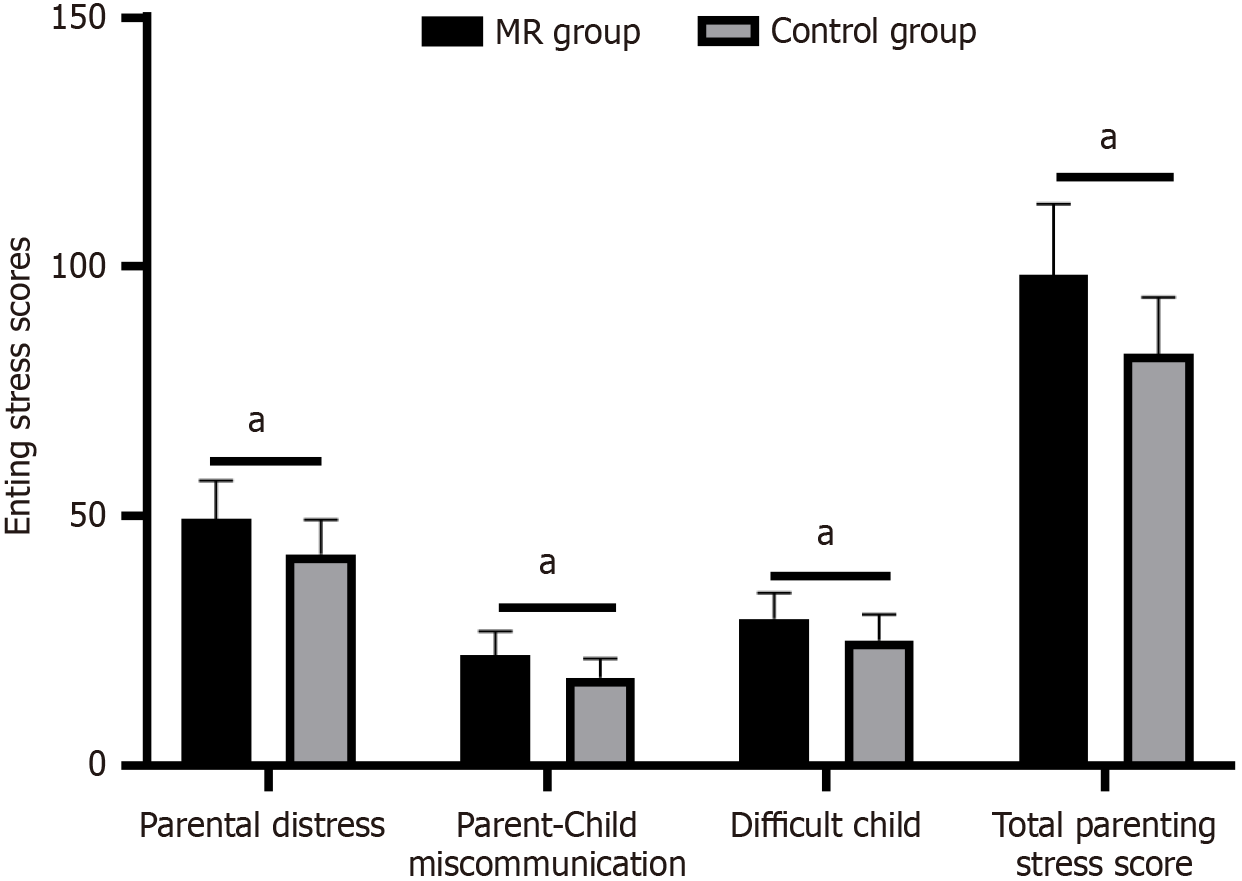
Figure 2 Comparison of parental stress scores between mental retardation and control groups.
aP < 0.05. MR: Mental retardation.
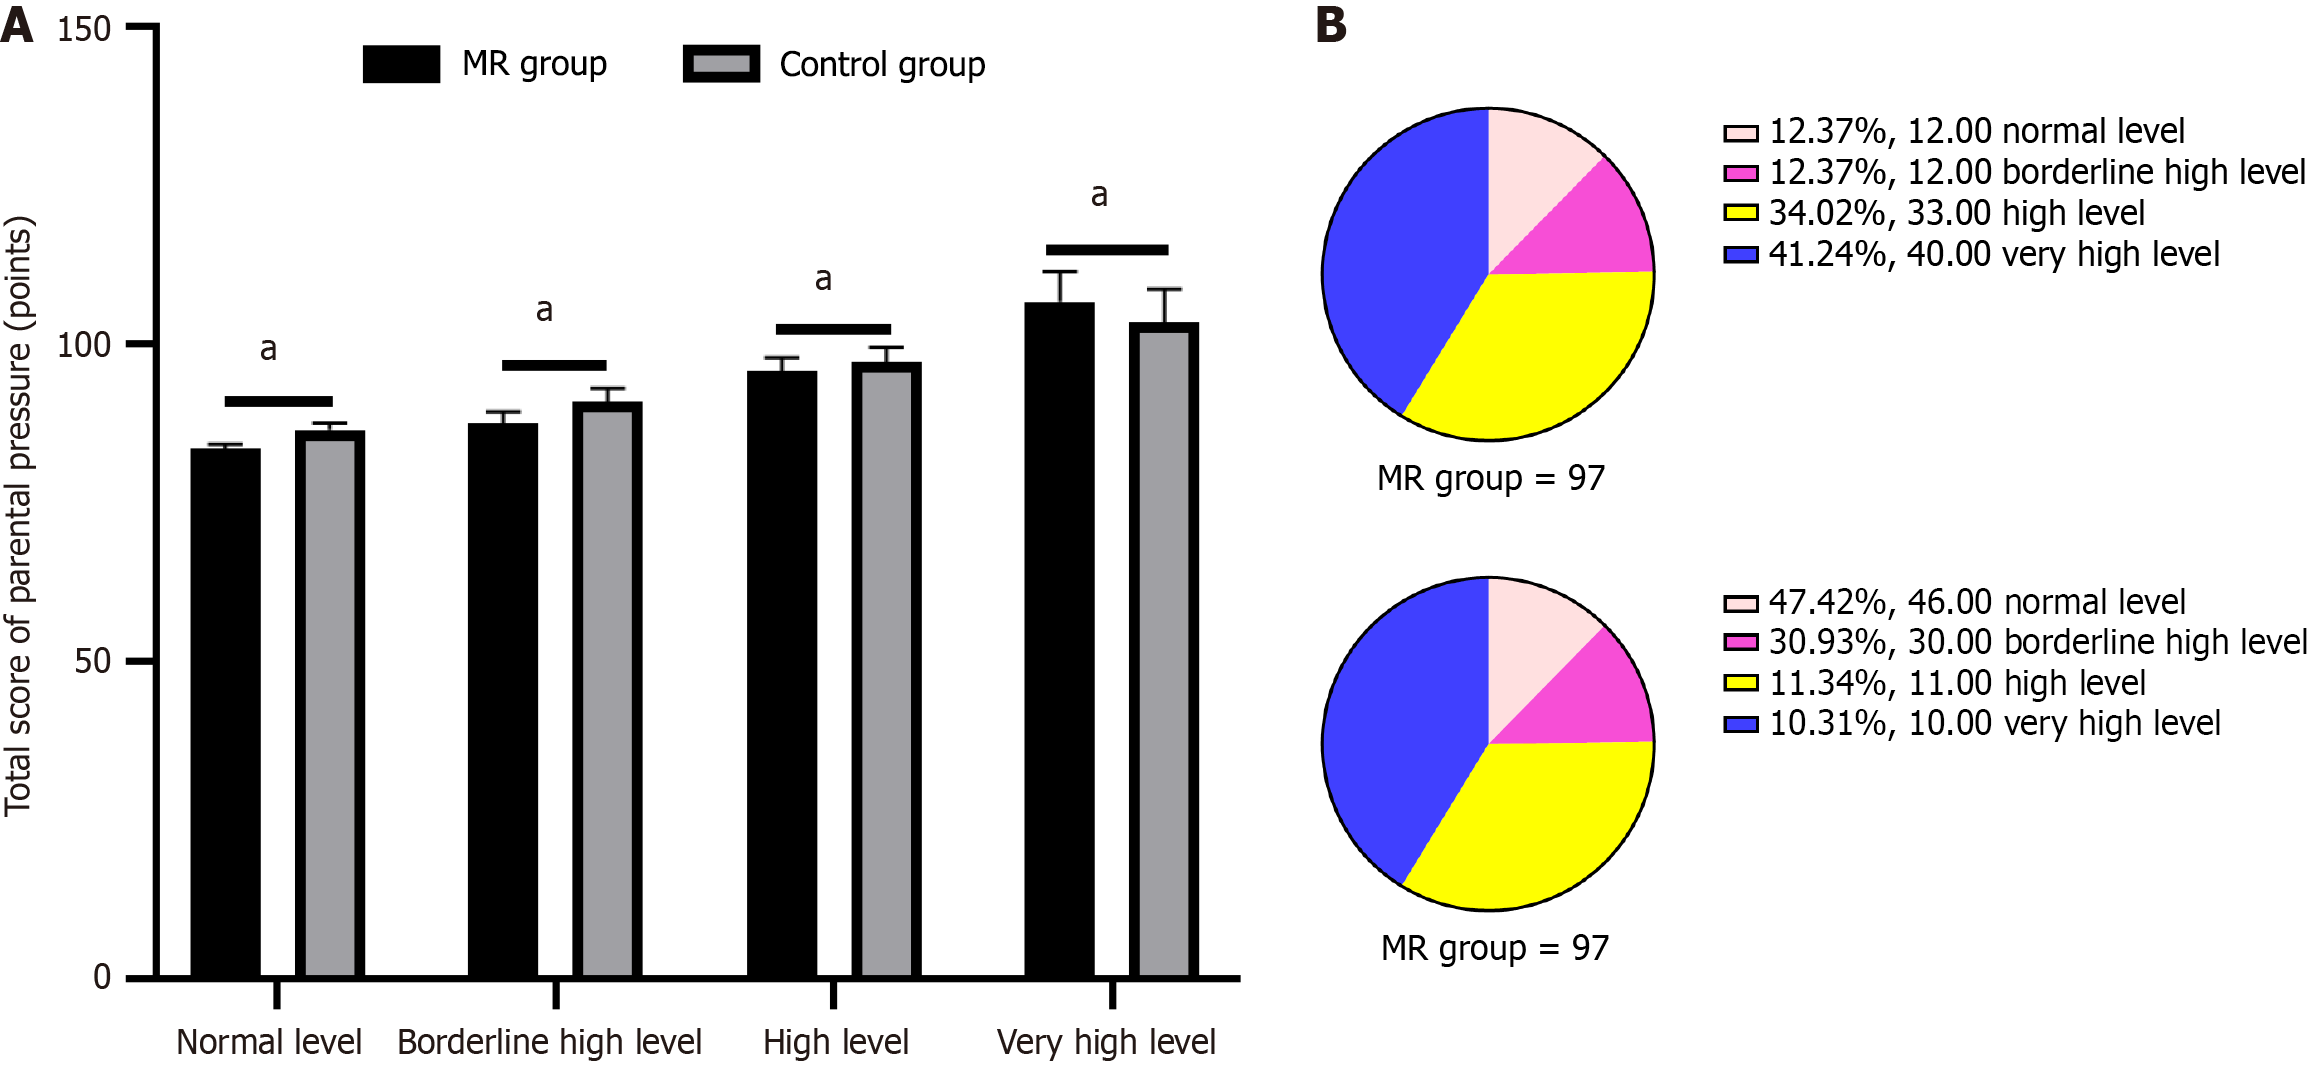
Figure 3 Distribution of parental stress levels in mental retardation and control groups.
aP < 0.05. A: Total parenting stress score; B: Number of participants. MR: Mental retardation.
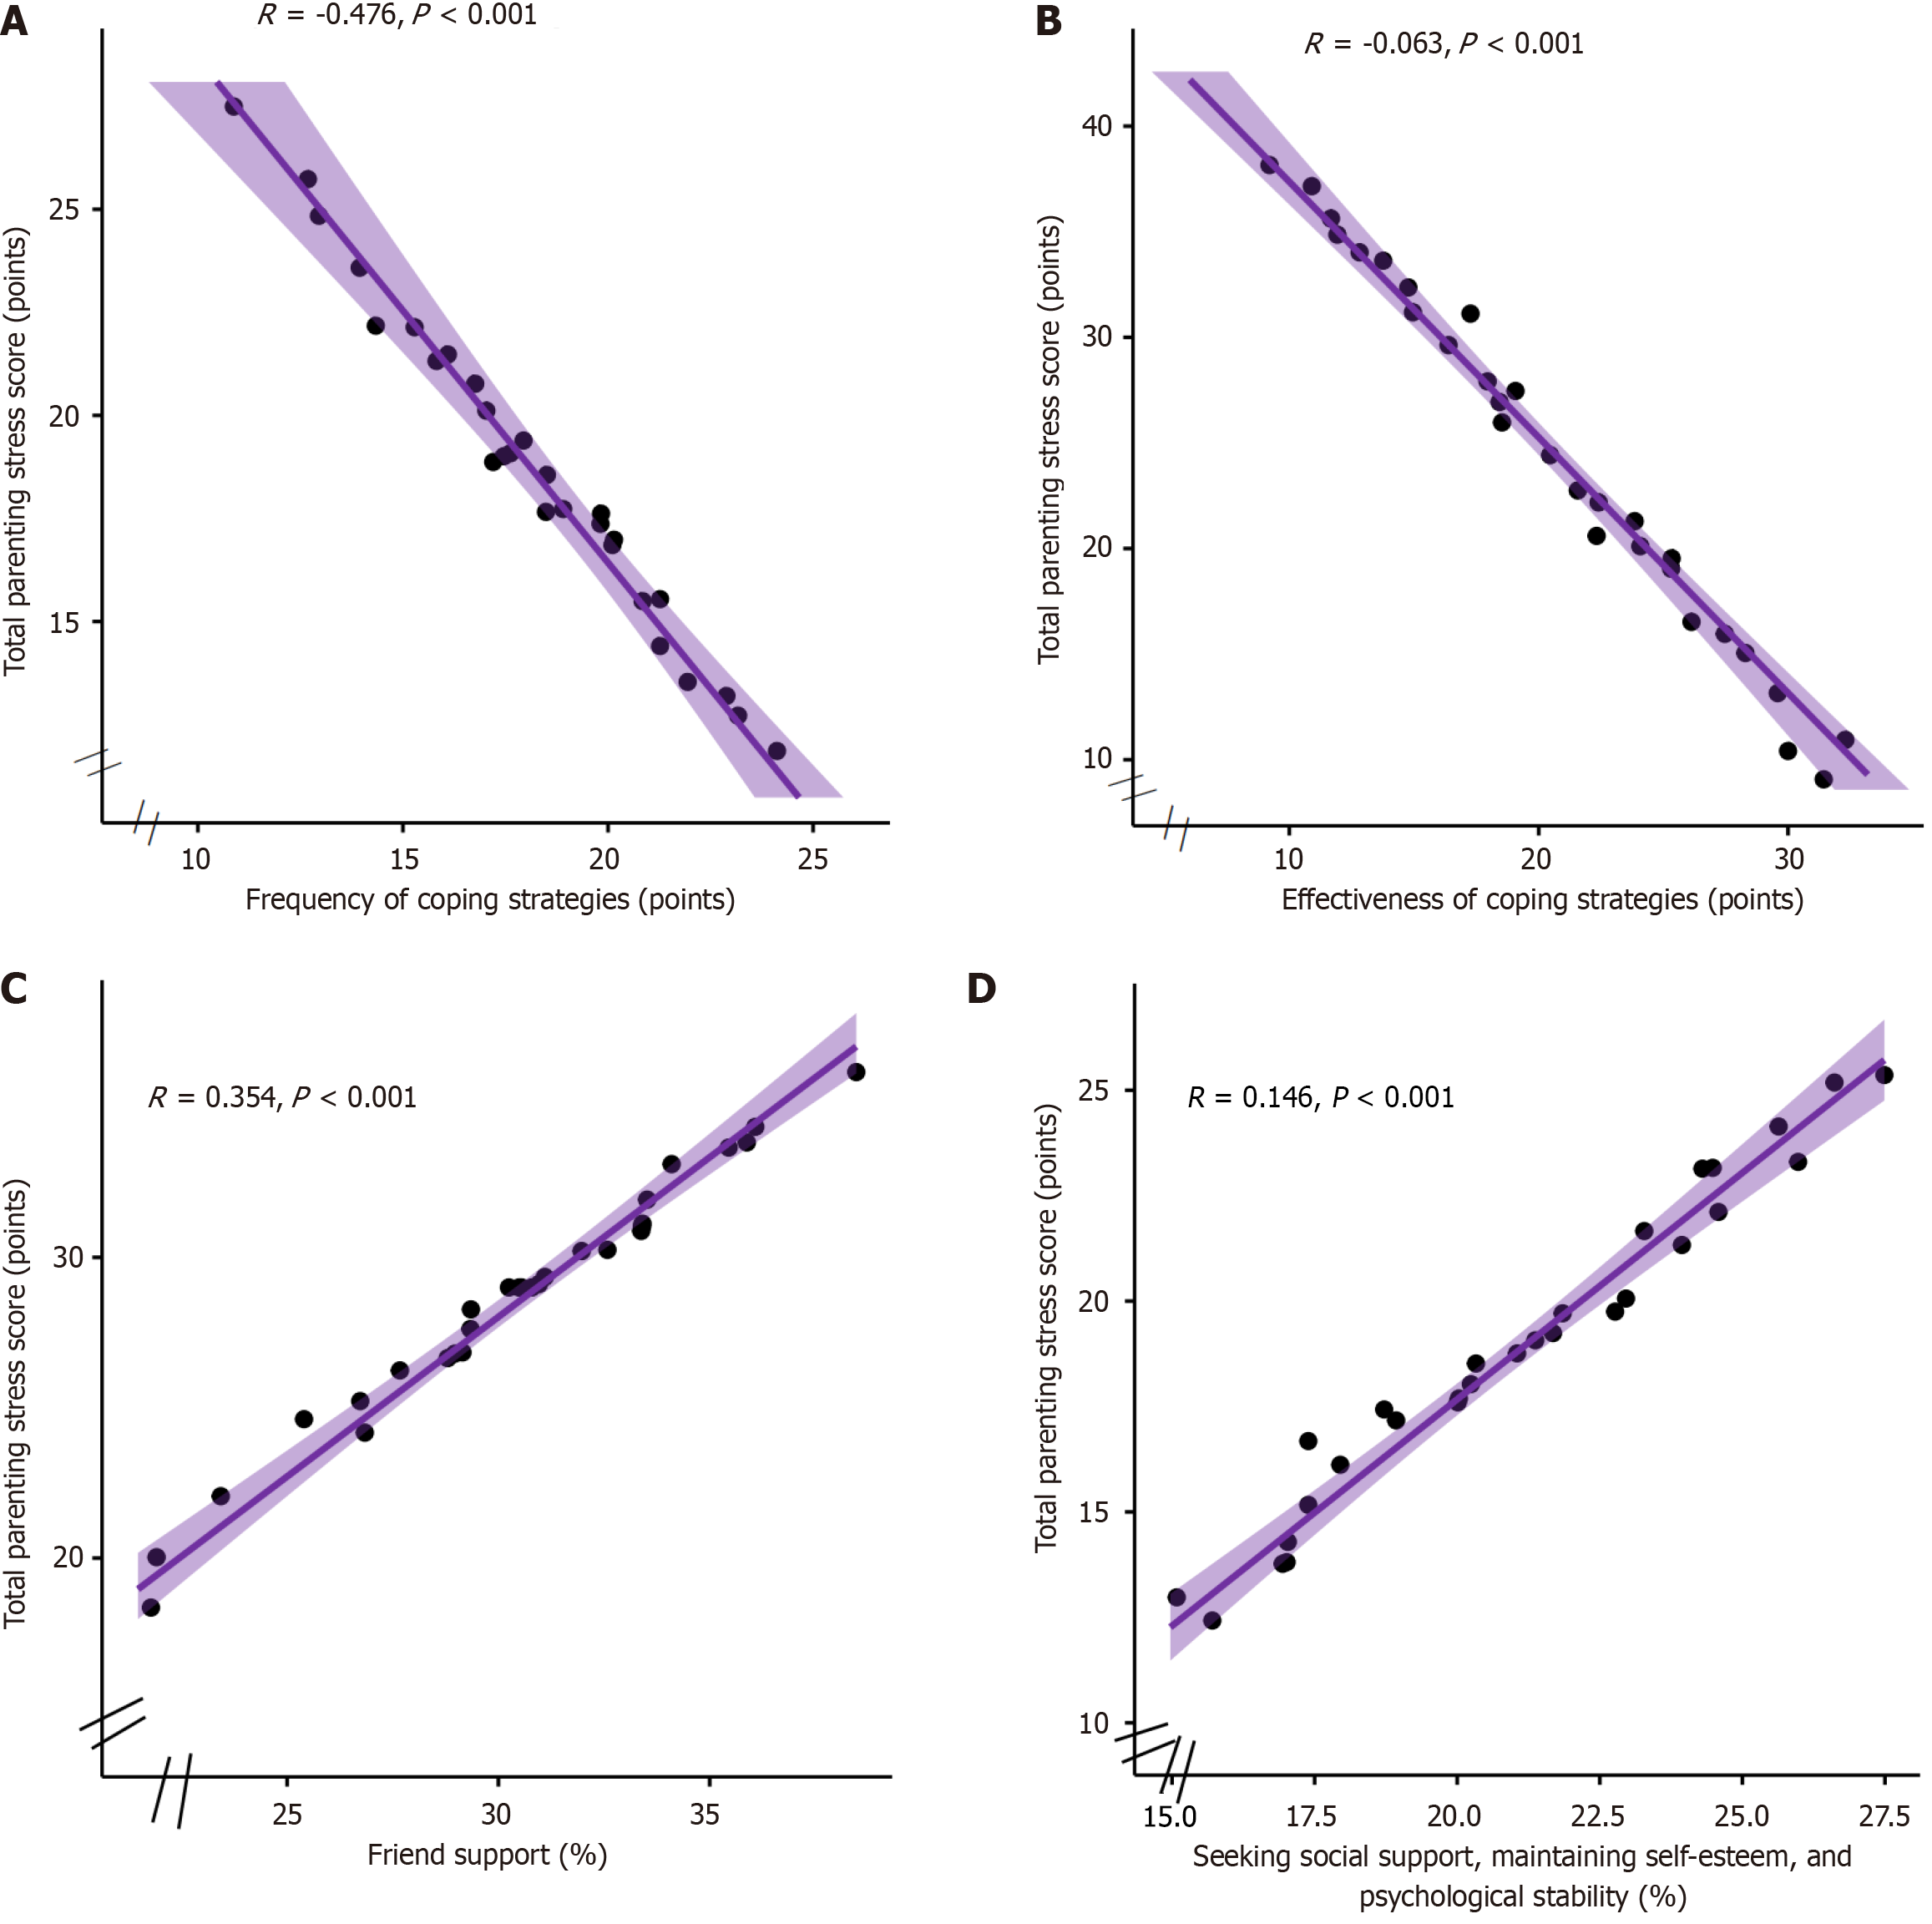
Figure 4 Correlation analysis of factors influencing parenting stress in preschool mental retardation children.
A: Coping strategy frequency; B: Coping strategy efficacy; C: Perceived Social Support Scale; D: Coping health inventory for parents.
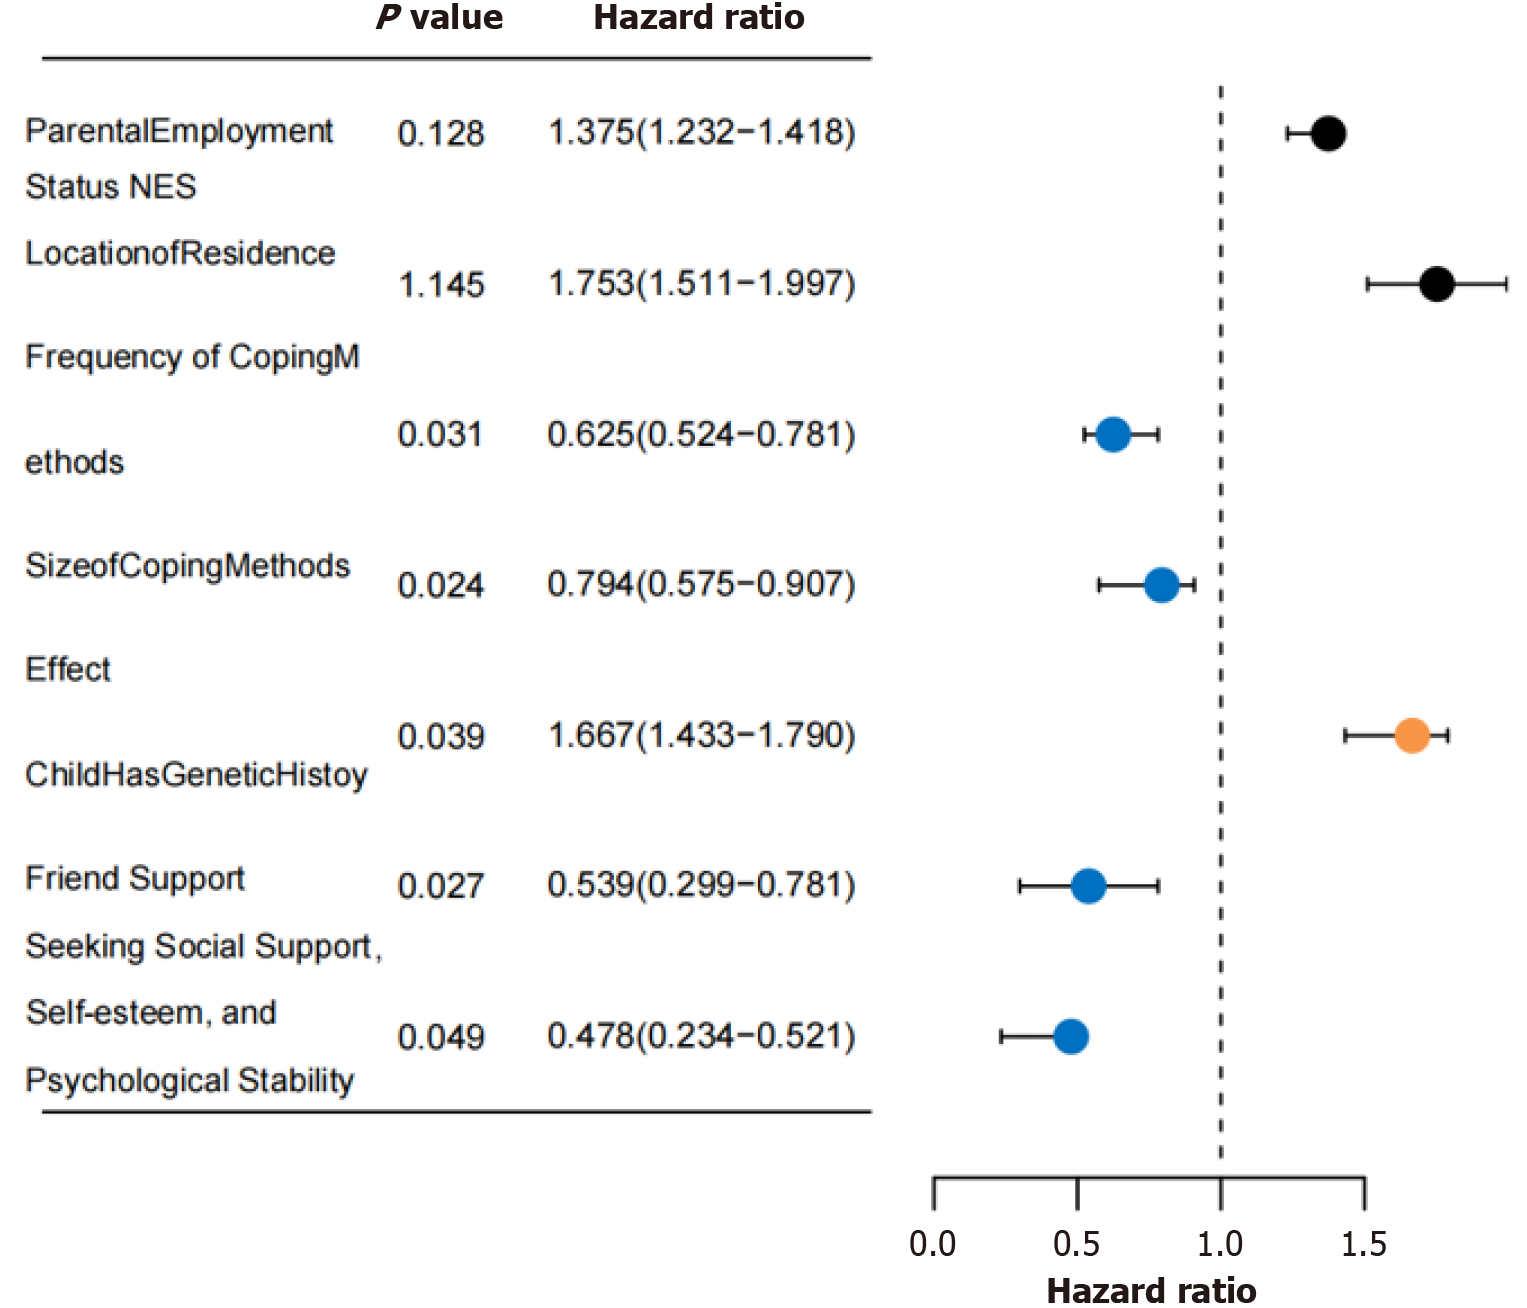
Figure 5
Multivariate analysis of parenting stress determinants in preschool mental retardation children.
- Citation: Li YJ, Fu ZW, Yu R, Duan JJ, Guo RQ, Li XY. Analysis of influencing factors of parents’ job stress of preschool children with mental retardation based on preference score matching. World J Psychiatry 2025; 15(10): 108491
- URL: https://www.wjgnet.com/2220-3206/full/v15/i10/108491.htm
- DOI: https://dx.doi.org/10.5498/wjp.v15.i10.108491


