Copyright
©The Author(s) 2025.
World J Psychiatry. Oct 19, 2025; 15(10): 101658
Published online Oct 19, 2025. doi: 10.5498/wjp.v15.i10.101658
Published online Oct 19, 2025. doi: 10.5498/wjp.v15.i10.101658
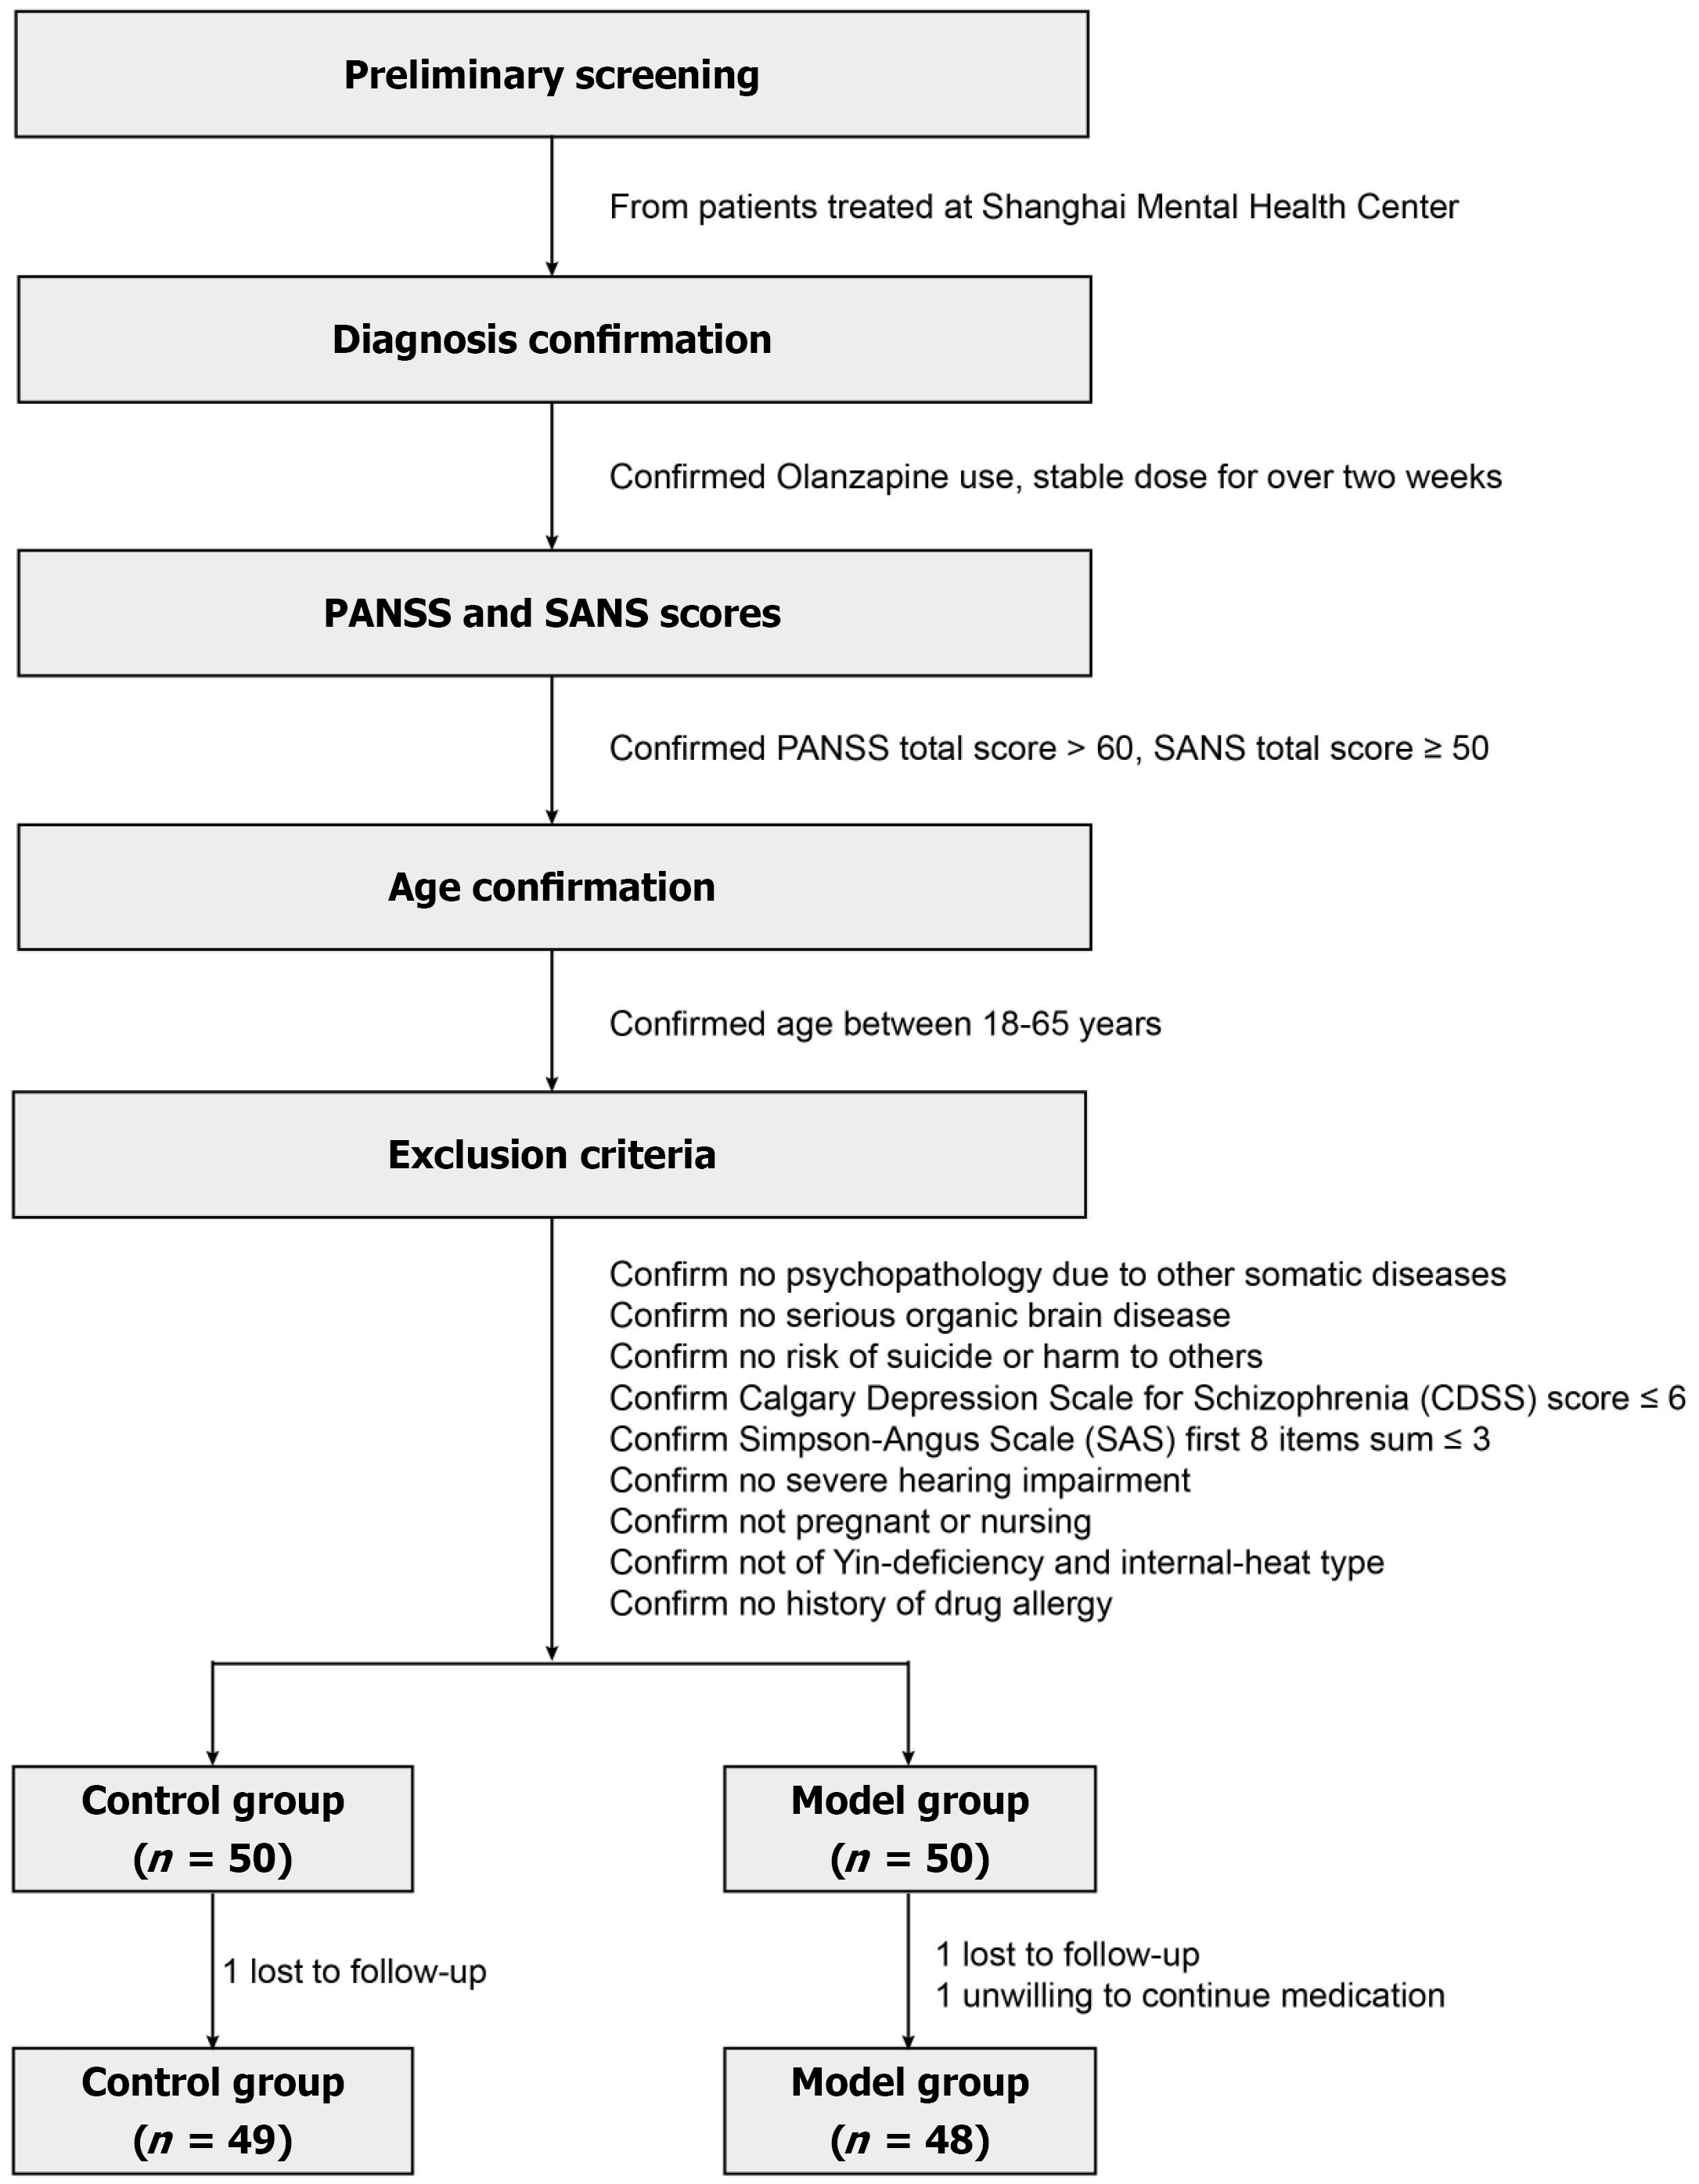
Figure 1 Flowchart of clinical inclusion and exclusion.
PANSS: Positive and negative syndrome scale; SANS: Scale for the assessment of negative symptoms.
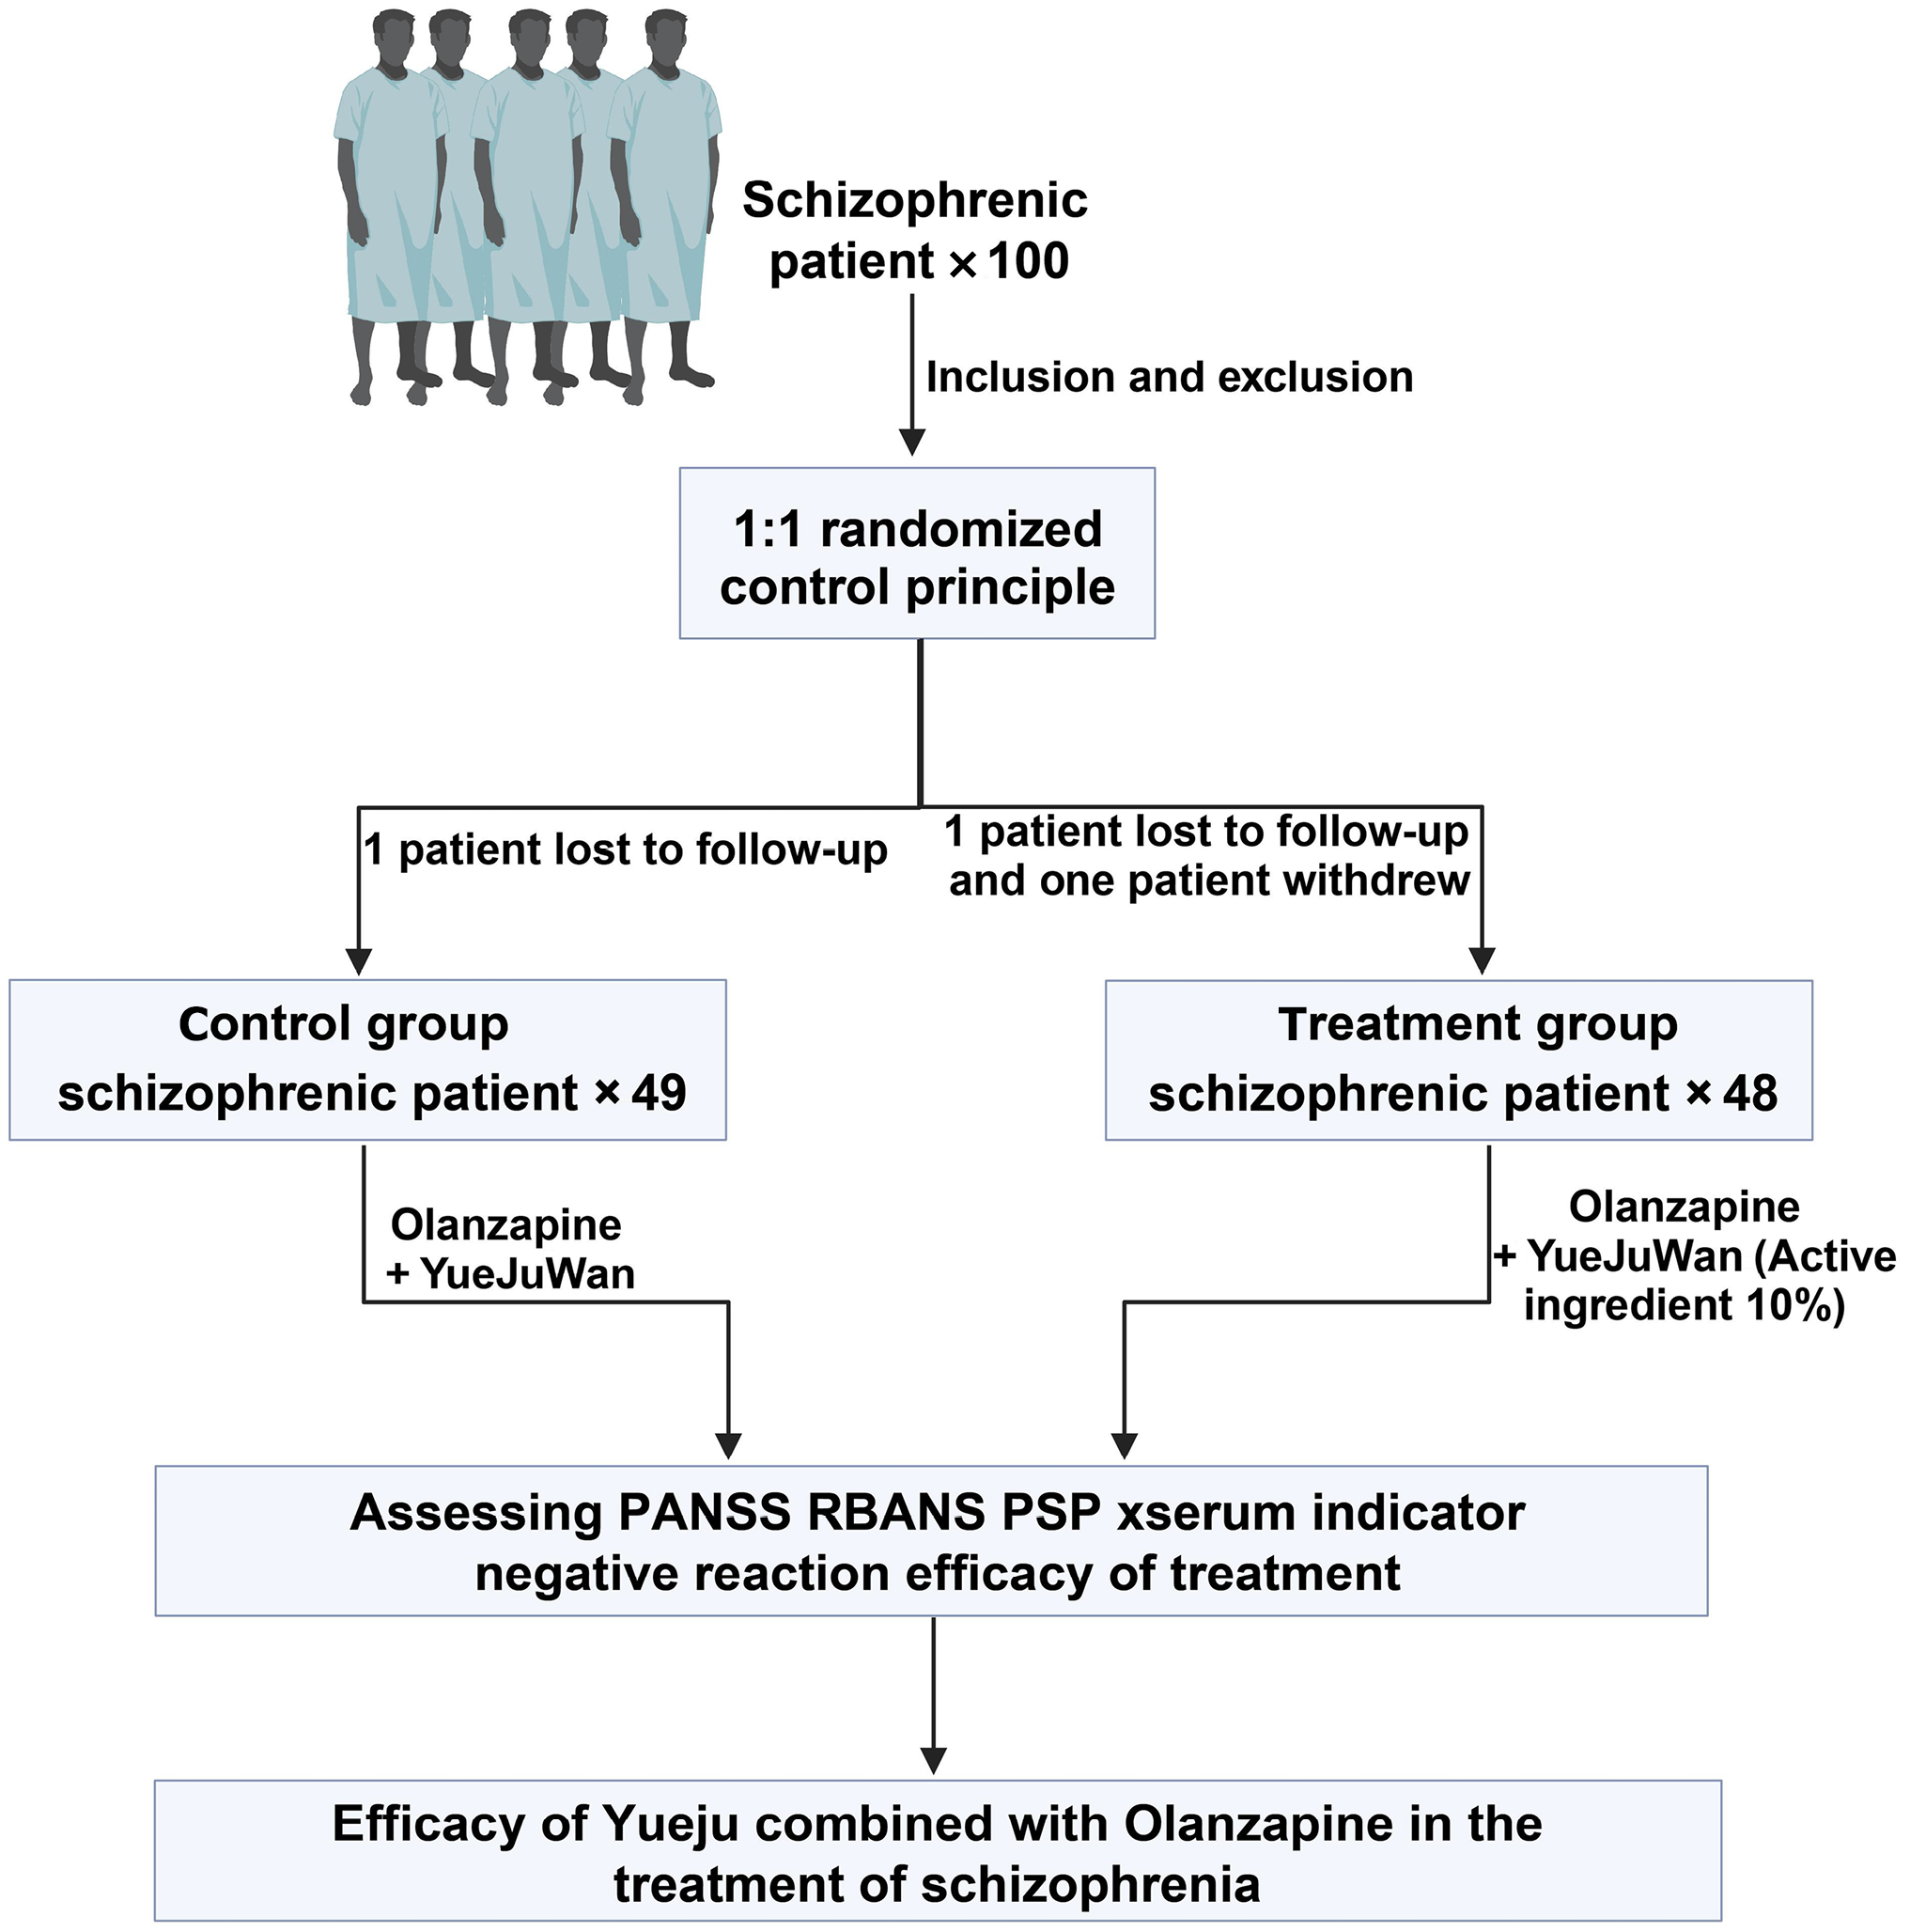
Figure 2 Flowchart of clinical trial design.
PANSS: Positive and negative syndrome scale; RBANS: Repeatable battery for the assessment of neuropsychological status; PSP: Personal and social performance scale.
Figure 3 Comparison of clinical efficacy between the intervention and control groups (intervention group = 48 cases, control group = 49 cases).
A: Distribution of patients across different efficacy levels in the schizophrenia intervention and control groups; B: Overall effectiveness rate of the schizophrenia intervention and control groups (intervention group = 48 cases, control group = 49 cases). NS: Not significance.
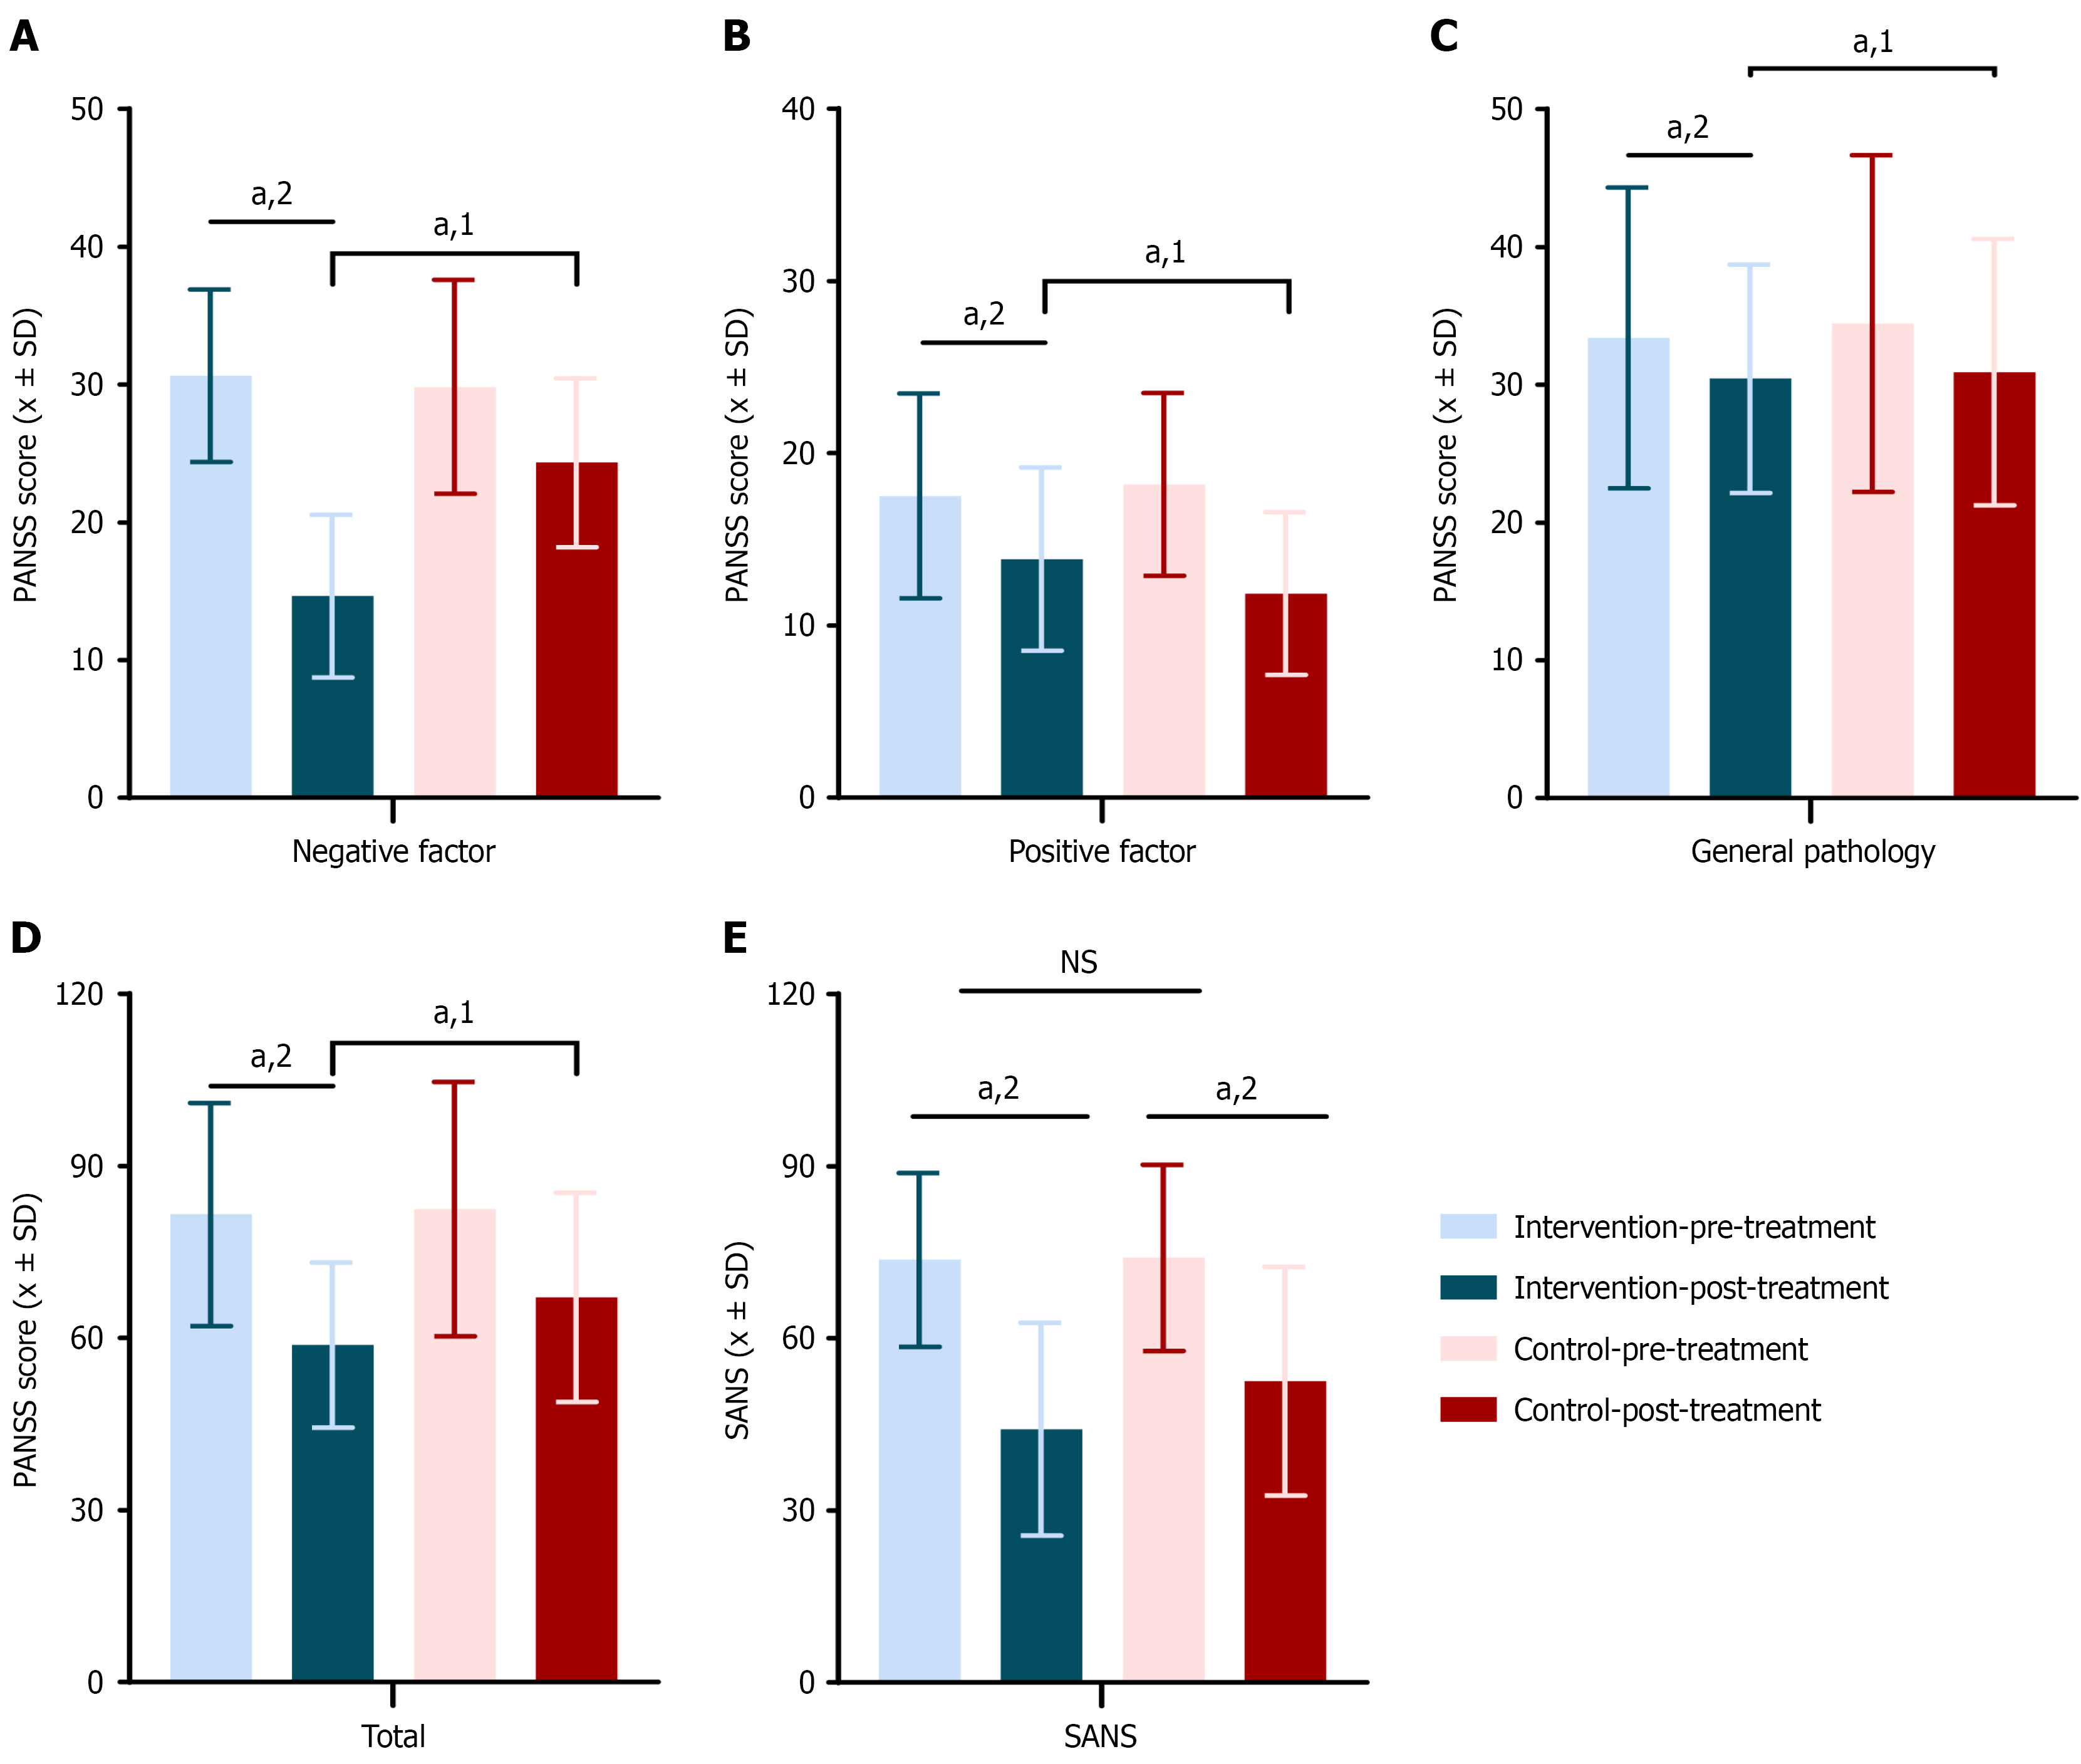
Figure 4 Scale scores for treatment outcomes in the schizophrenia intervention and control groups.
Positive and negative syndrome scale (PANSS) scores before and after treatment in the intervention and control groups. A: Negative factor score; B: Positive factor score; C: General psychopathology score; D: Total PANSS score; E: Scale for the assessment of negative symptoms scores for treatment outcomes in the schizophrenia intervention and control groups (intervention group = 48 cases, control group = 49 cases). 1Indicates a significant difference compared to the control group; 2Indicates a significant difference before and after the intervention; aP < 0.05. NS: Not significance; PANSS: Positive and negative syndrome scale; SANS: Scale for the assessment of negative symptoms.
Figure 5 Comparison of cognitive function and social function scores before and after treatment in the schizophrenia intervention and control groups.
A: Repeatable battery for the assessment of neuropsychological status scores for treatment outcomes in the schizophrenia intervention and control groups; B: Personal and social performance scale scores for treatment outcomes in the schizophrenia intervention and control groups (intervention group = 48 cases, control group = 49 cases). 1Indicates a significant difference before and after the intervention; aP < 0.05. NS: Not significance; RBANS: Repeatable battery for the assessment of neuropsychological status; PSP: Personal and social performance scale.
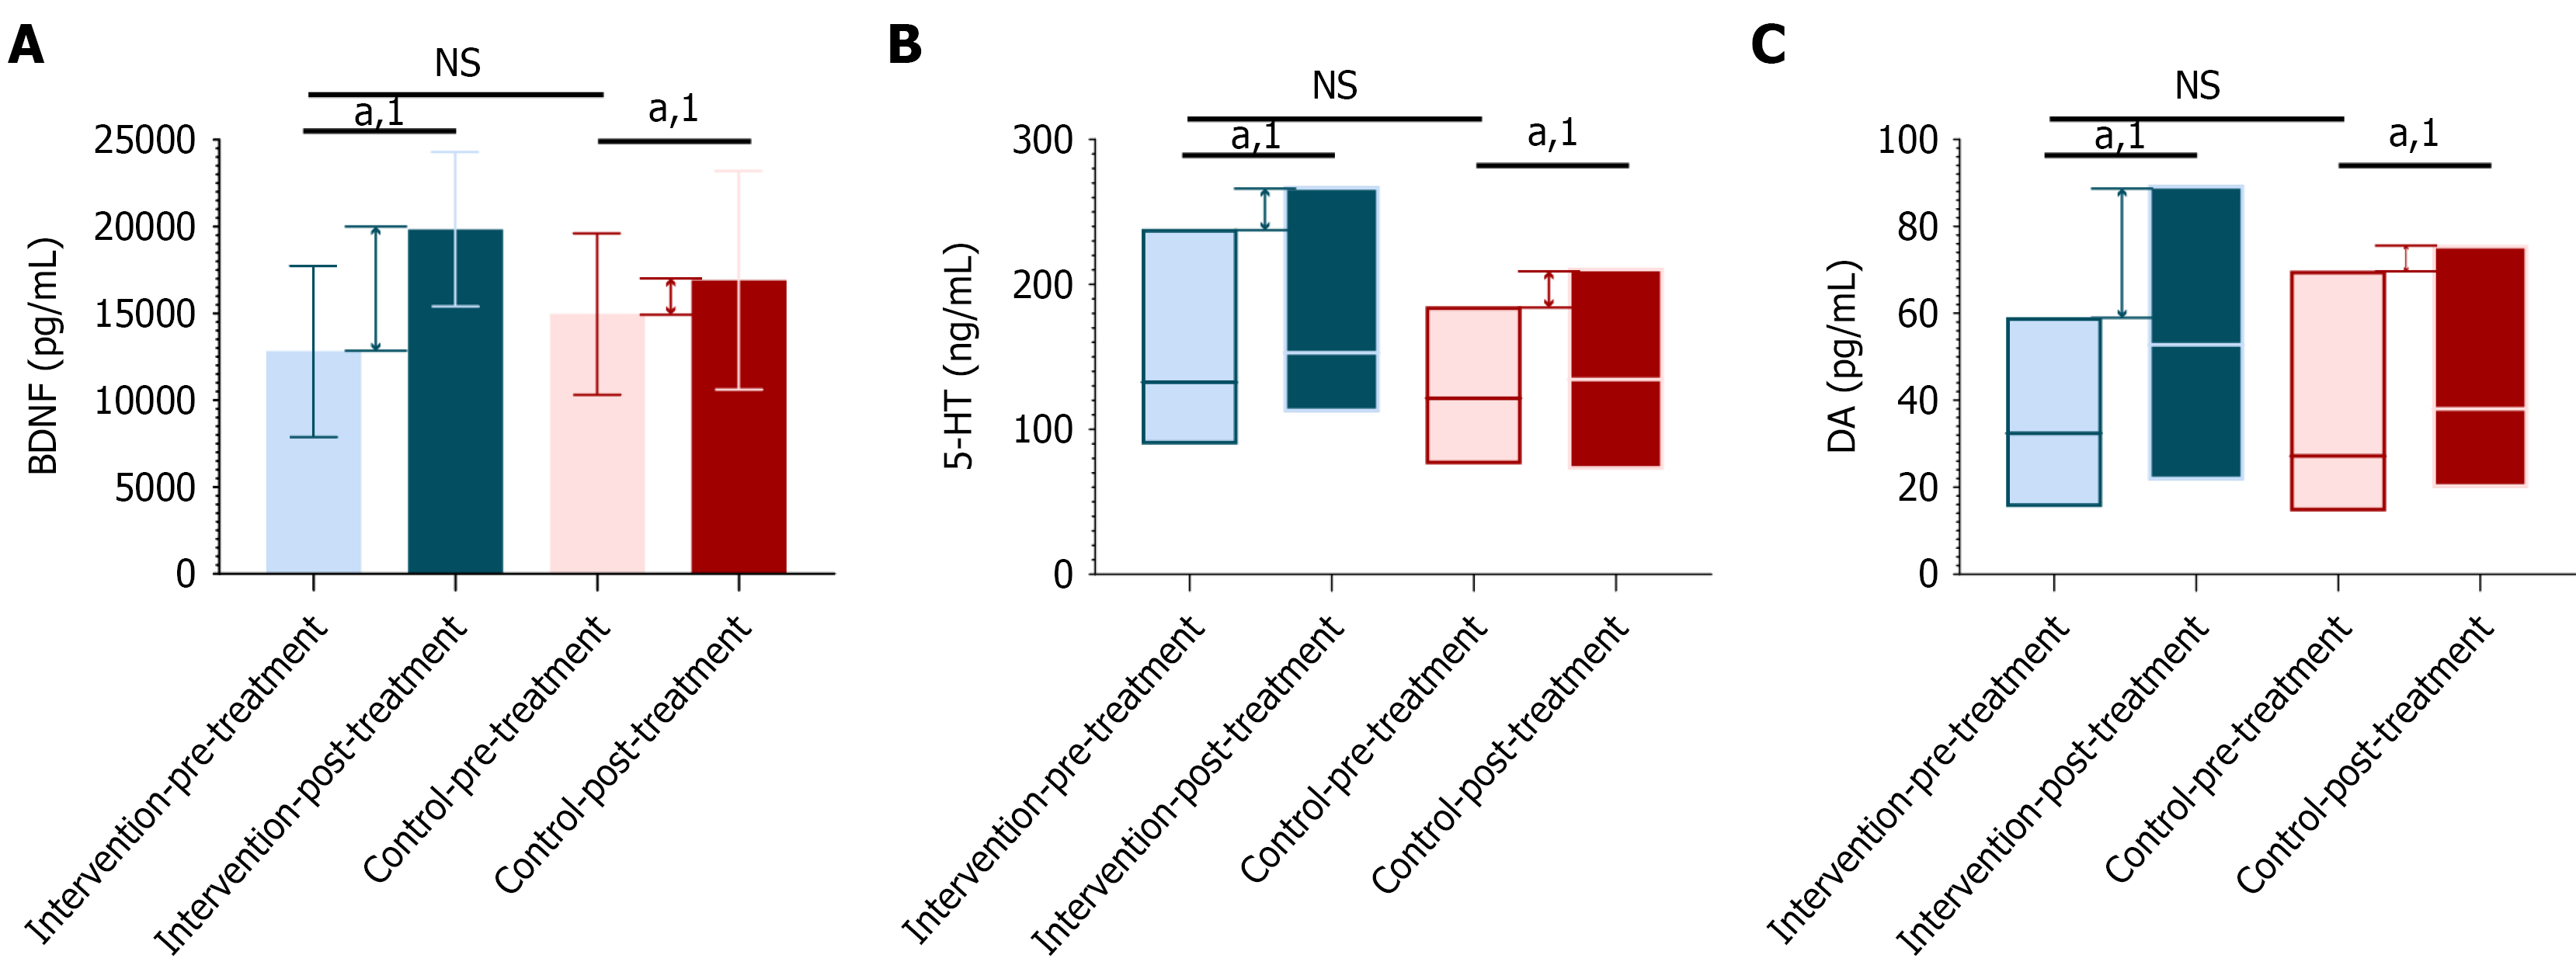
Figure 6 Analysis of changes in serum brain-derived neurotrophic factor, dopamine, and serotonin levels before and after treatment in schizophrenia patients.
A: Analysis of changes in serum brain-derived neurotrophic factor levels before and after treatment in schizophrenia patients; B: Analysis of changes in serum serotonin levels before and after treatment in schizophrenia patients; C: Analysis of changes in serum dopamine levels before and after treatment in schizophrenia patients (intervention group = 48 cases, control group = 49 cases). 1Indicates a significant difference before and after the intervention; aP < 0.05. NS: Not significance; BDNF: Brain-derived neurotrophic factor; 5-HT: Serotonin; DA: Dopamine.
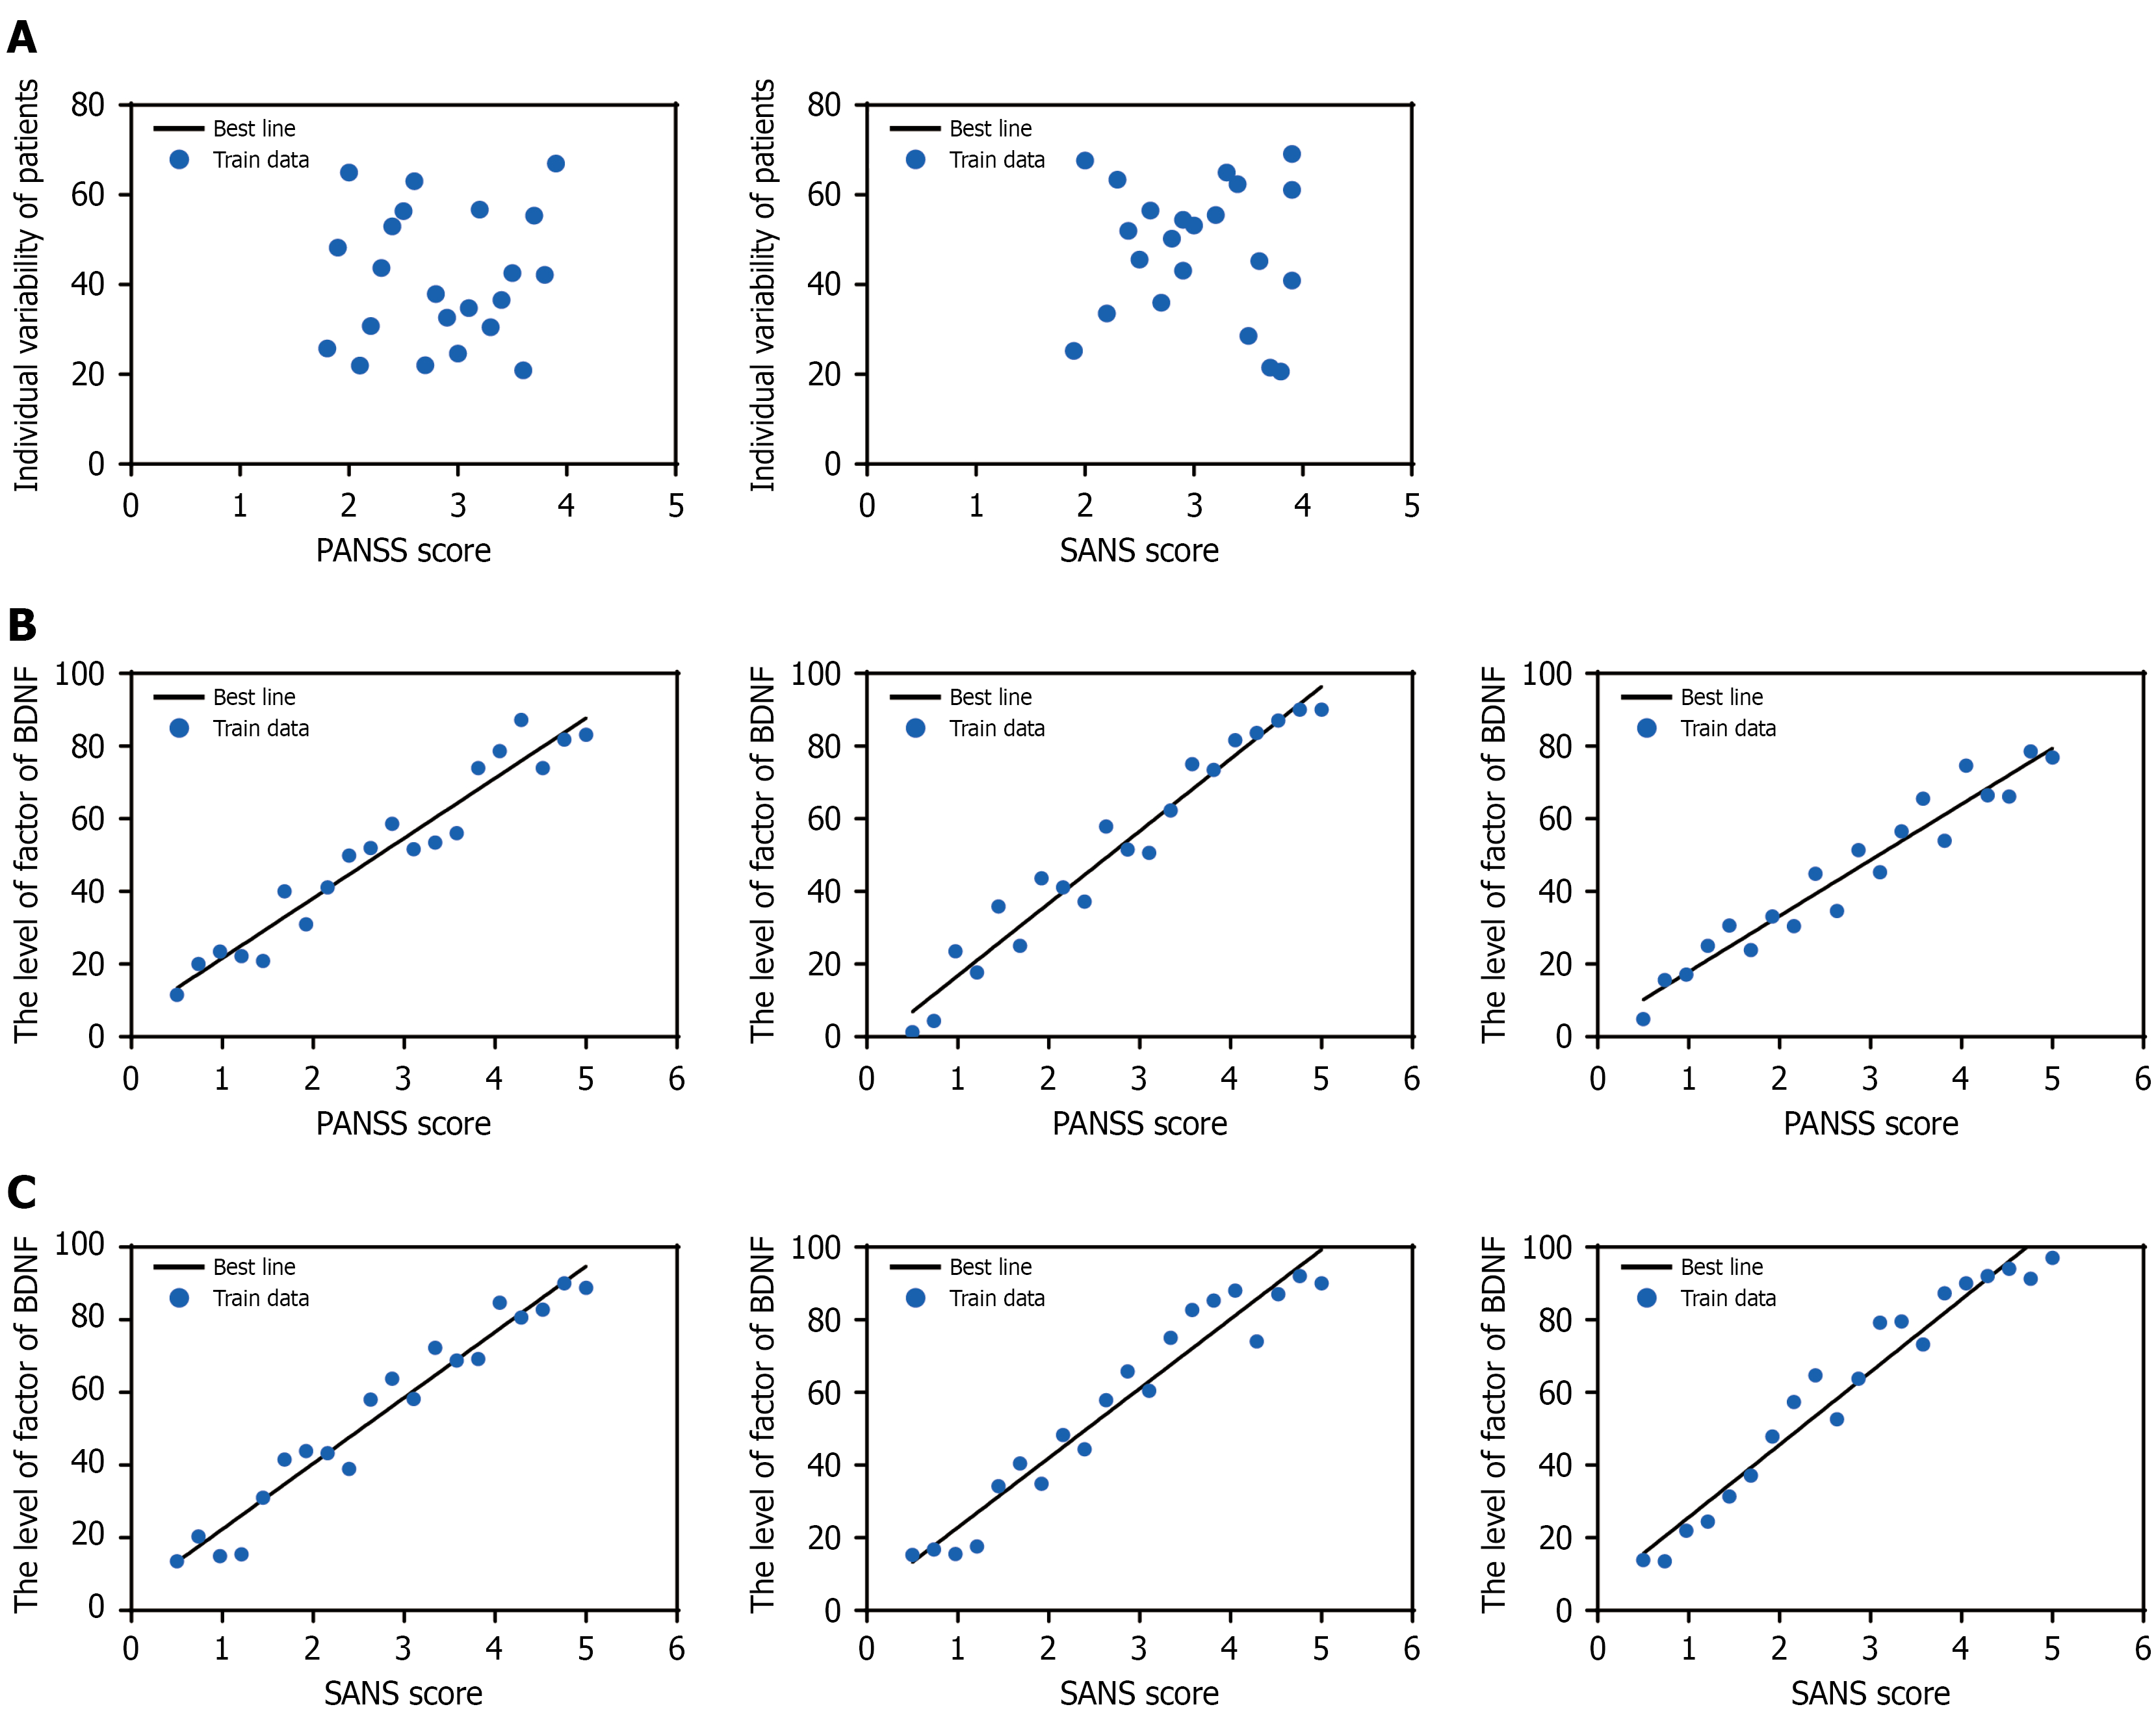
Figure 7 Correlation analysis between symptom improvement and individual variability as well as serum levels of brain-derived neurotrophic factor, dopamine, and serotonin.
A: Correlation between individual variability and positive and negative syndrome scale (PANSS)/scale for the assessment of negative symptoms (SANS) scores; B: Correlation between serum brain-derived neurotrophic factor (BDNF), serotonin (5-HT), and dopamine (DA) levels and PANSS scores; C: Correlation between serum BDNF, 5-HT, and DA levels and SANS scores. PANSS: Positive and negative syndrome scale; SANS: Scale for the assessment of negative symptoms; BDNF: Brain-derived neurotrophic factor; 5-HT: Serotonin; DA: Dopamine.
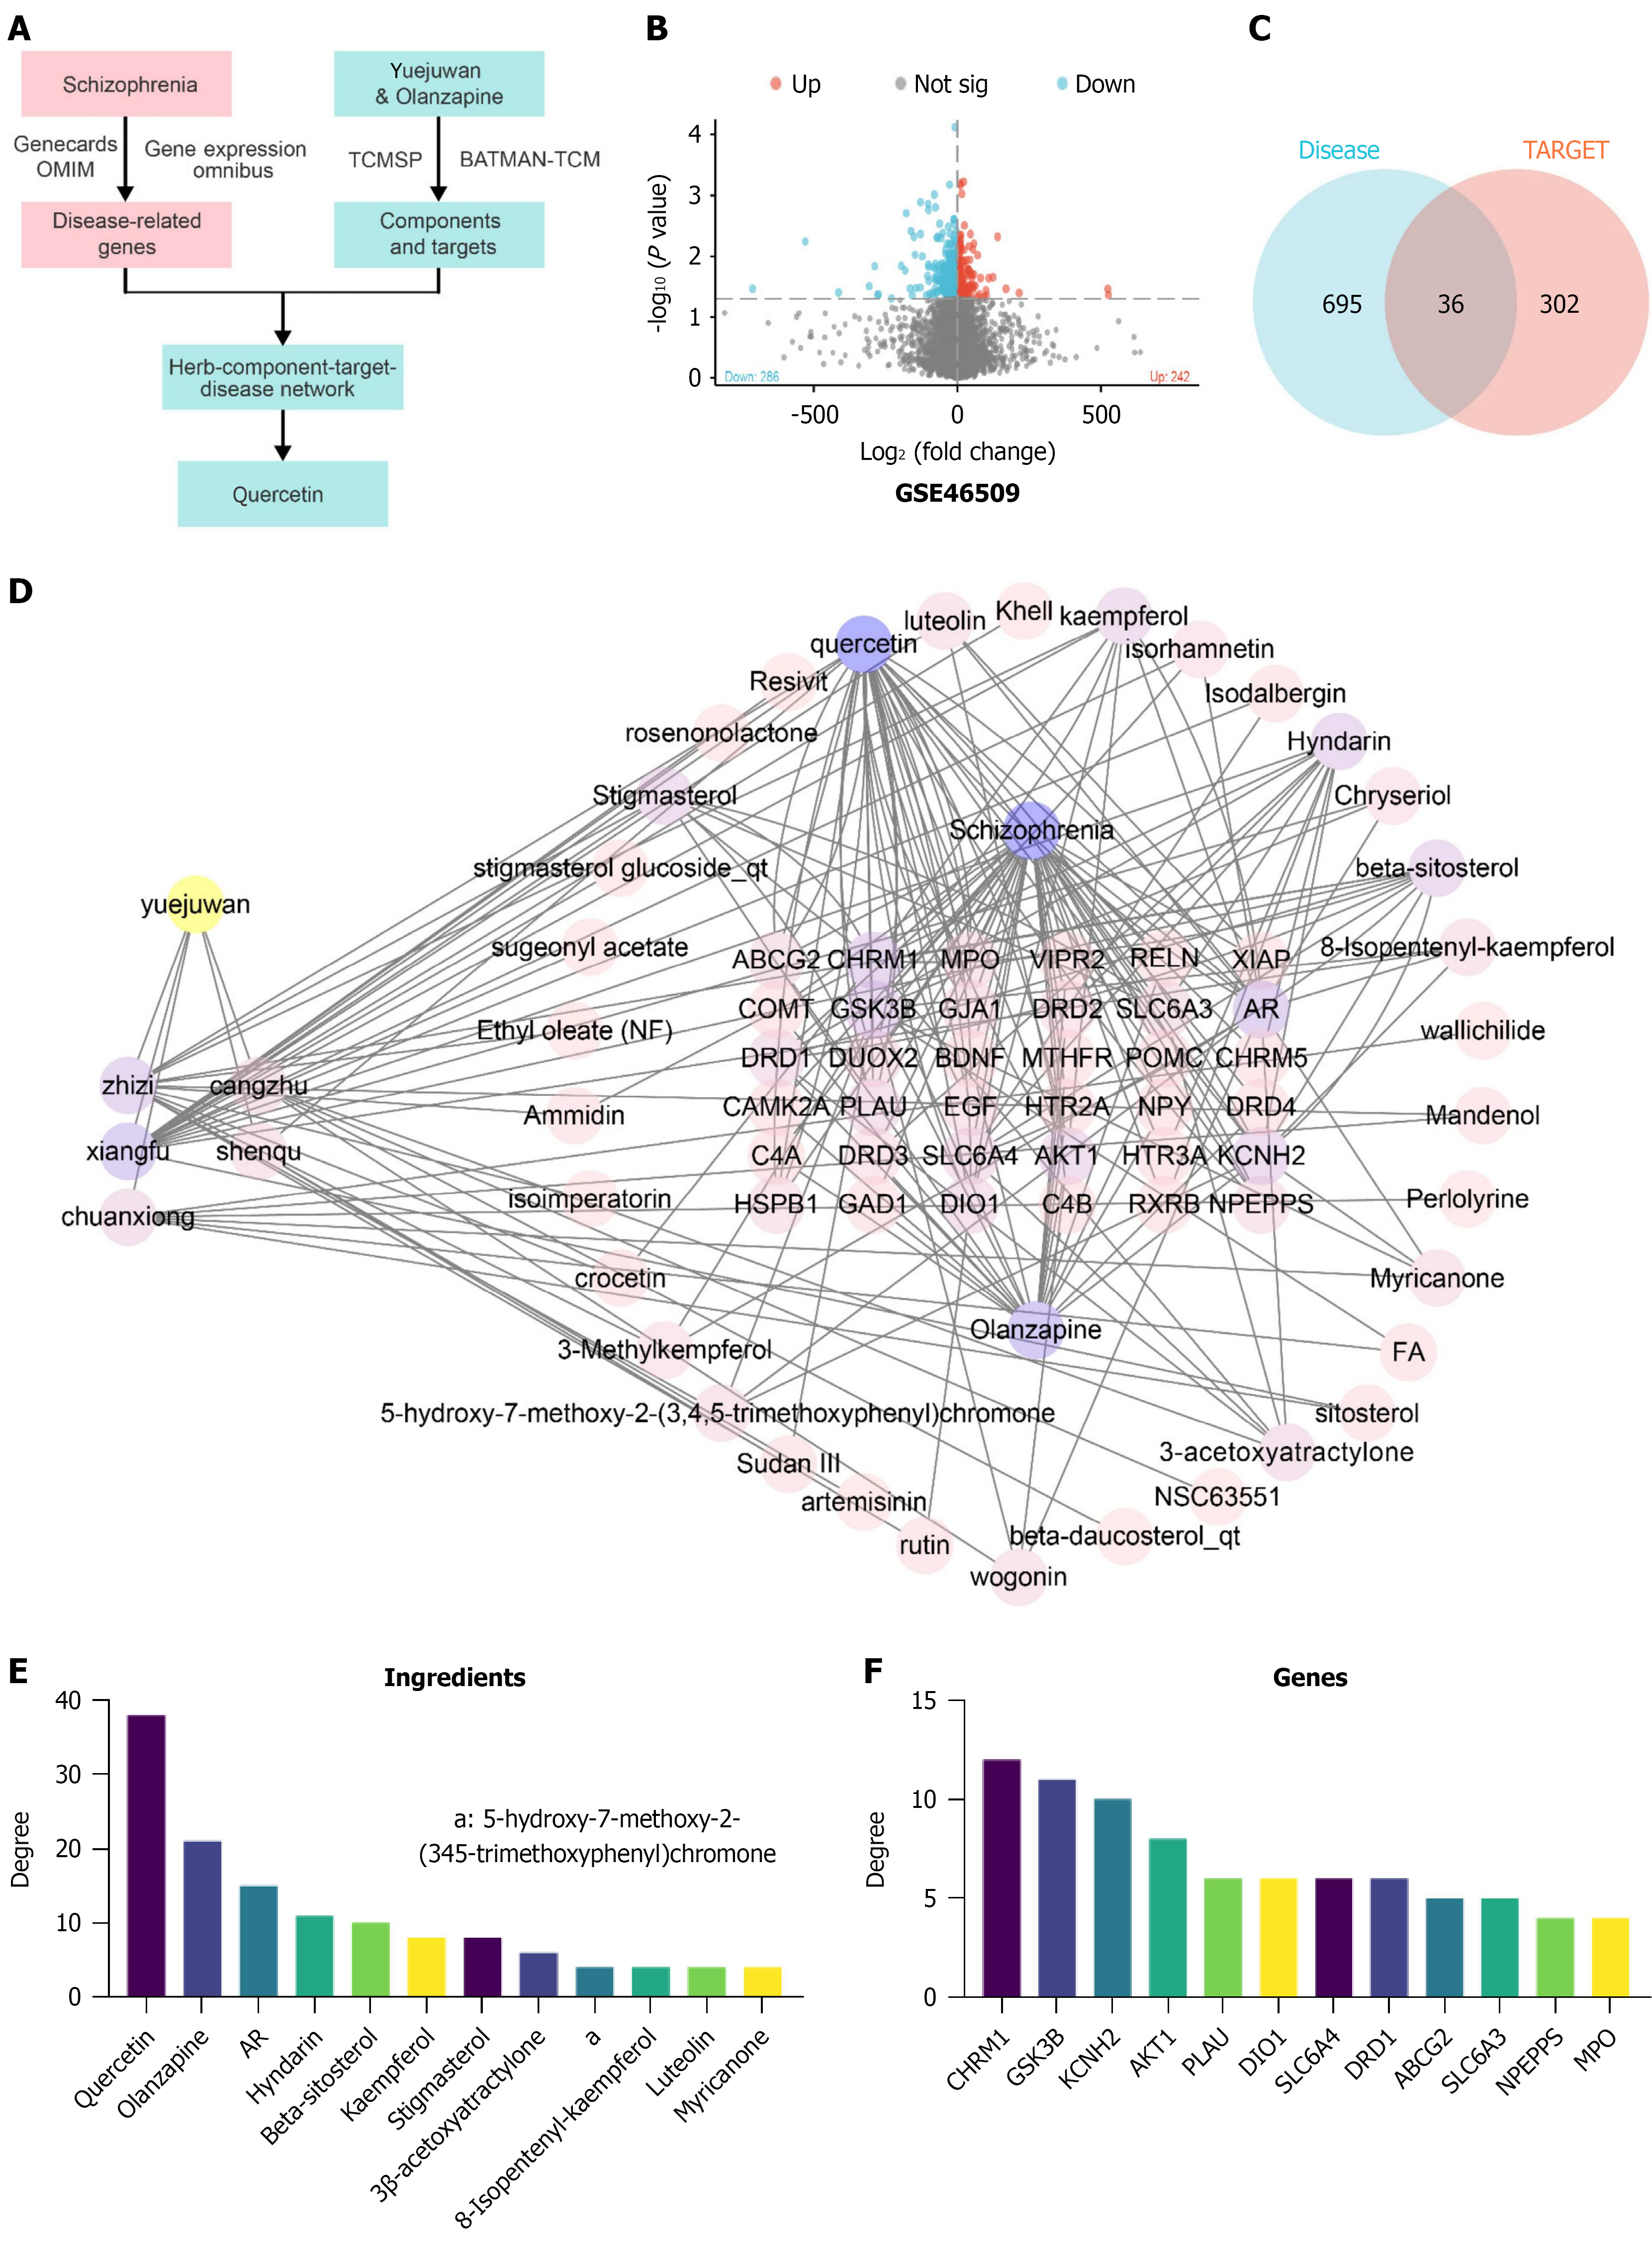
Figure 8 Identification of candidate genes and chemical components for schizophrenia relief via Yueju pill combined with olanzapine.
A: Flowchart of network pharmacology for identifying candidate genes and chemical components involved in schizophrenia relief via Yueju pill combined with olanzapine; B: Volcano plot based on differential expression analysis from GSE46509; C: Venn diagram showing the intersection of drug targets for effective chemical components of Yueju pill combined with olanzapine and disease targets related to schizophrenia; D: Network interaction map constructed using Cytoscape software for Yueju pill combined with olanzapine, effective components, targets, and disease, with Yueju pill combined with olanzapine on the left; the shared targets of the disease and drugs are shown in the central matrix area, and the effective components of Yueju pill combined with olanzapine are represented by circles. Node size and color intensity indicate the degree value; E: Top 12 active chemical components of Yueju pill combined with olanzapine ranked by degree value; F: Top 12 common targets shared by the disease and the drug components ranked by degree value. TCM: Traditional Chinese medicine.
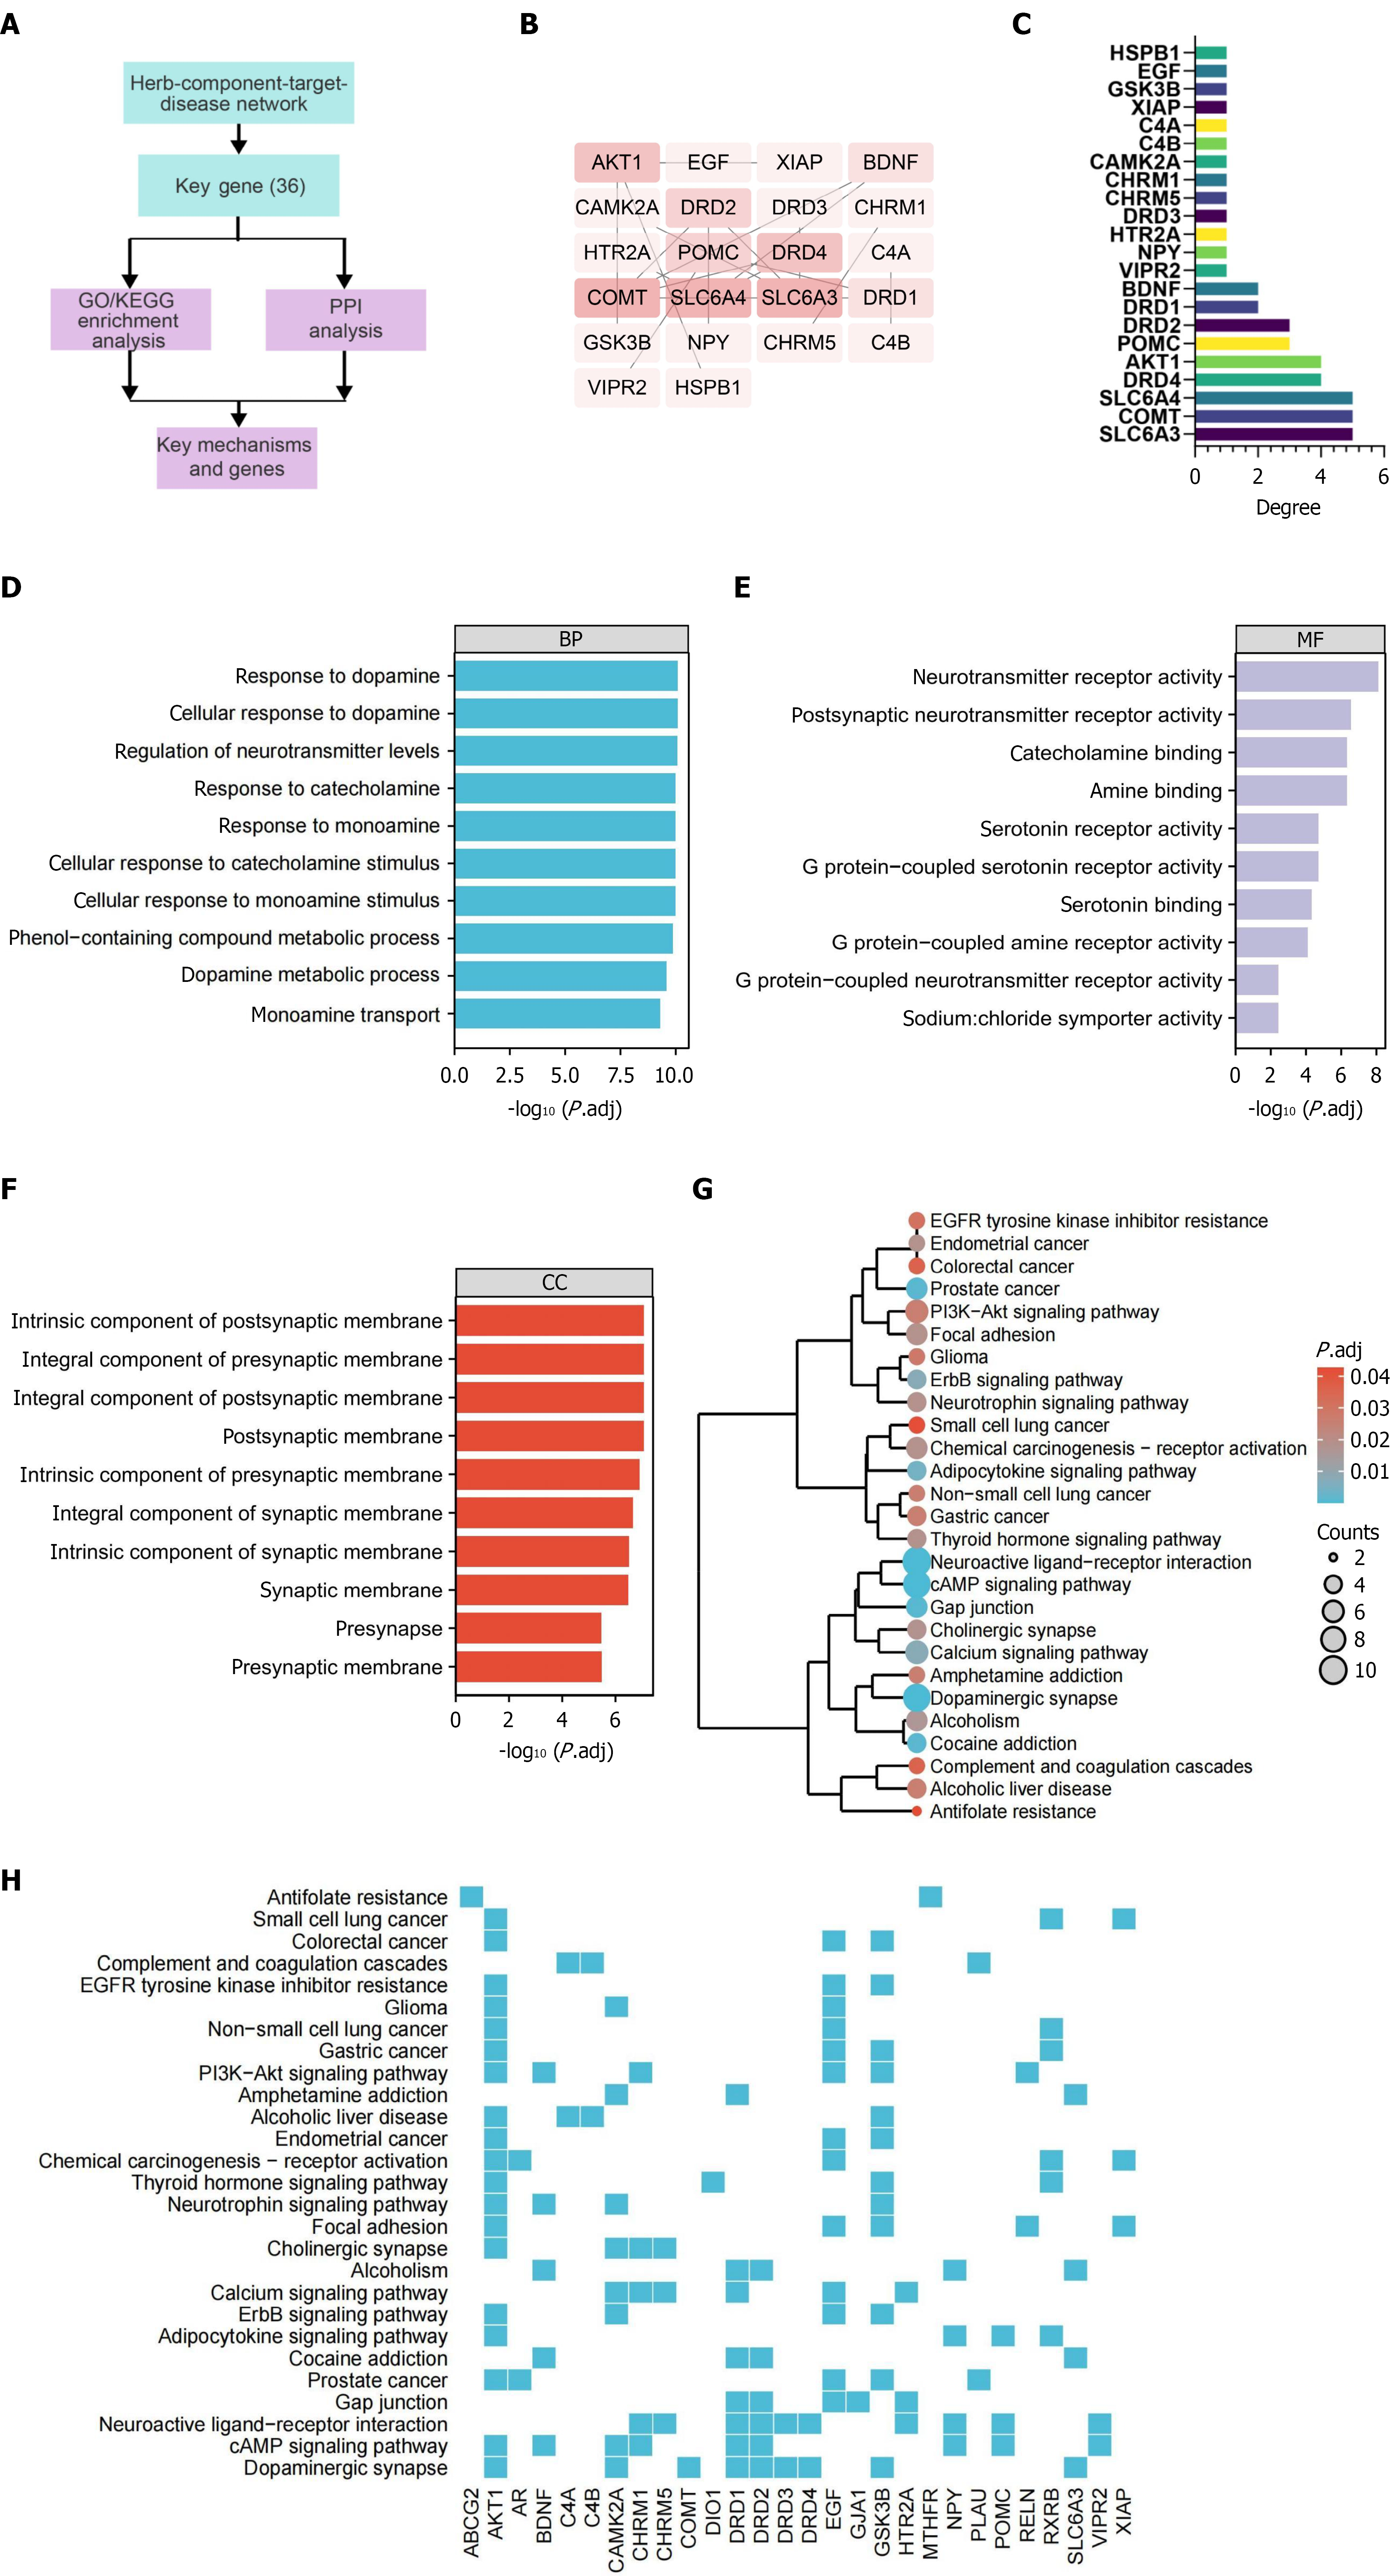
Figure 9 Bioinformatics analysis of key signaling pathways involved in schizophrenia relief via Yueju pill combined with olanzapine.
A: Simplified flowchart of the bioinformatics analysis for identifying key signaling pathways involved in schizophrenia relief via Yueju pill combined with olanzapine; B: Protein-protein interaction (PPI) network constructed using Cytoscape software based on 36 candidate genes regulated by Yueju pill combined with olanzapine, with larger text and darker background indicating higher degree values; C: Degree values within the PPI network; D-F: Partial results of Gene Ontology analysis for the 36 candidate genes regulated by Yueju pill combined with olanzapine, covering biological processes, molecular functions, and cellular components; G and H: Kyoto Encyclopedia of Genes and Genomes pathway analysis of the 36 candidate genes regulated by Yueju pill combined with olanzapine, presented as a hierarchical tree (G) and a gene heatmap (H), sorted by P adjust values. The size of the circles represents the number of selected genes, and the color indicates the enrichment analysis P value. GO: Gene Ontology; KEGG: Kyoto Encyclopedia of Genes and Genomes; PPI: Protein-protein interaction.
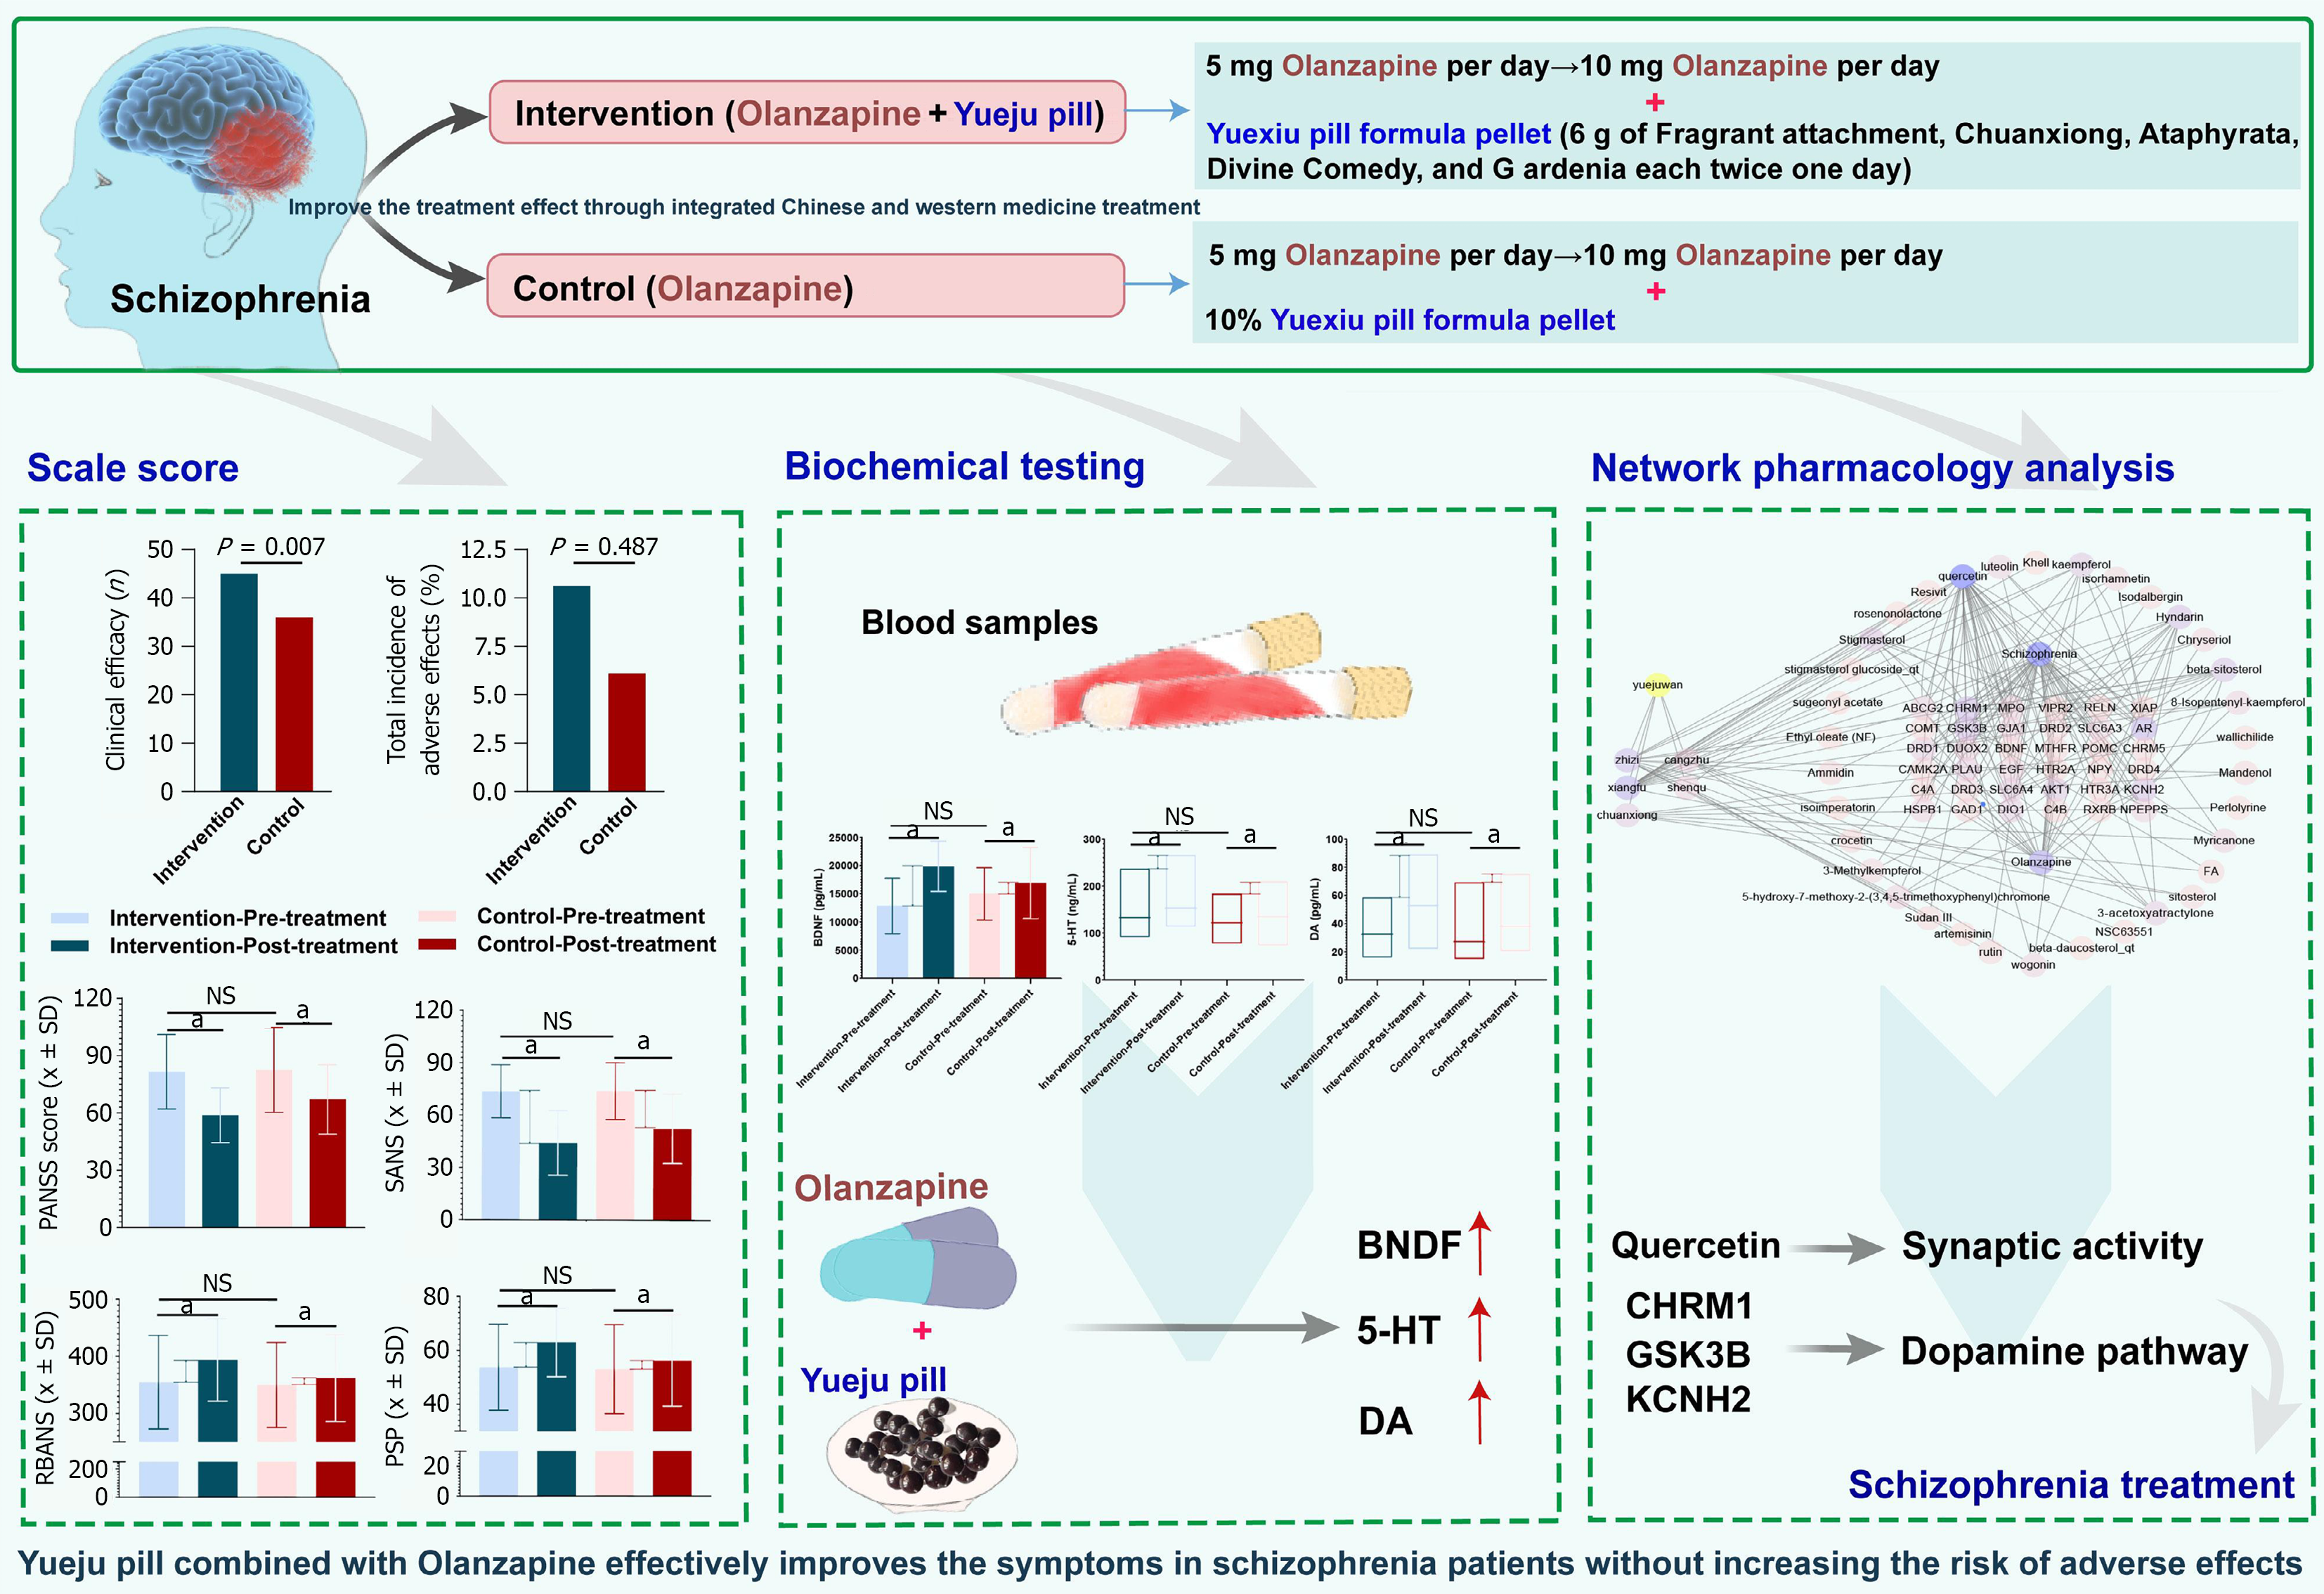
Figure 10 Yueju pill combined with olanzapine effectively improves the symptoms in schizophrenia patients without increasing the risk of adverse effects.
aP < 0.05. NS: Not significance; BDNF: Brain-derived neurotrophic factor; 5-HT: Serotonin; DA: Dopamine.
- Citation: Zhu DM, Lu Y, Xiao XD, Sun Y, Tao G, Long B, Zhao J. Enhancing schizophrenia treatment efficacy: The combined impact of Yueju pill and olanzapine through quercetin target modulation. World J Psychiatry 2025; 15(10): 101658
- URL: https://www.wjgnet.com/2220-3206/full/v15/i10/101658.htm
- DOI: https://dx.doi.org/10.5498/wjp.v15.i10.101658


