©The Author(s) 2021.
World J Crit Care Med. Sep 9, 2021; 10(5): 244-259
Published online Sep 9, 2021. doi: 10.5492/wjccm.v10.i5.244
Published online Sep 9, 2021. doi: 10.5492/wjccm.v10.i5.244
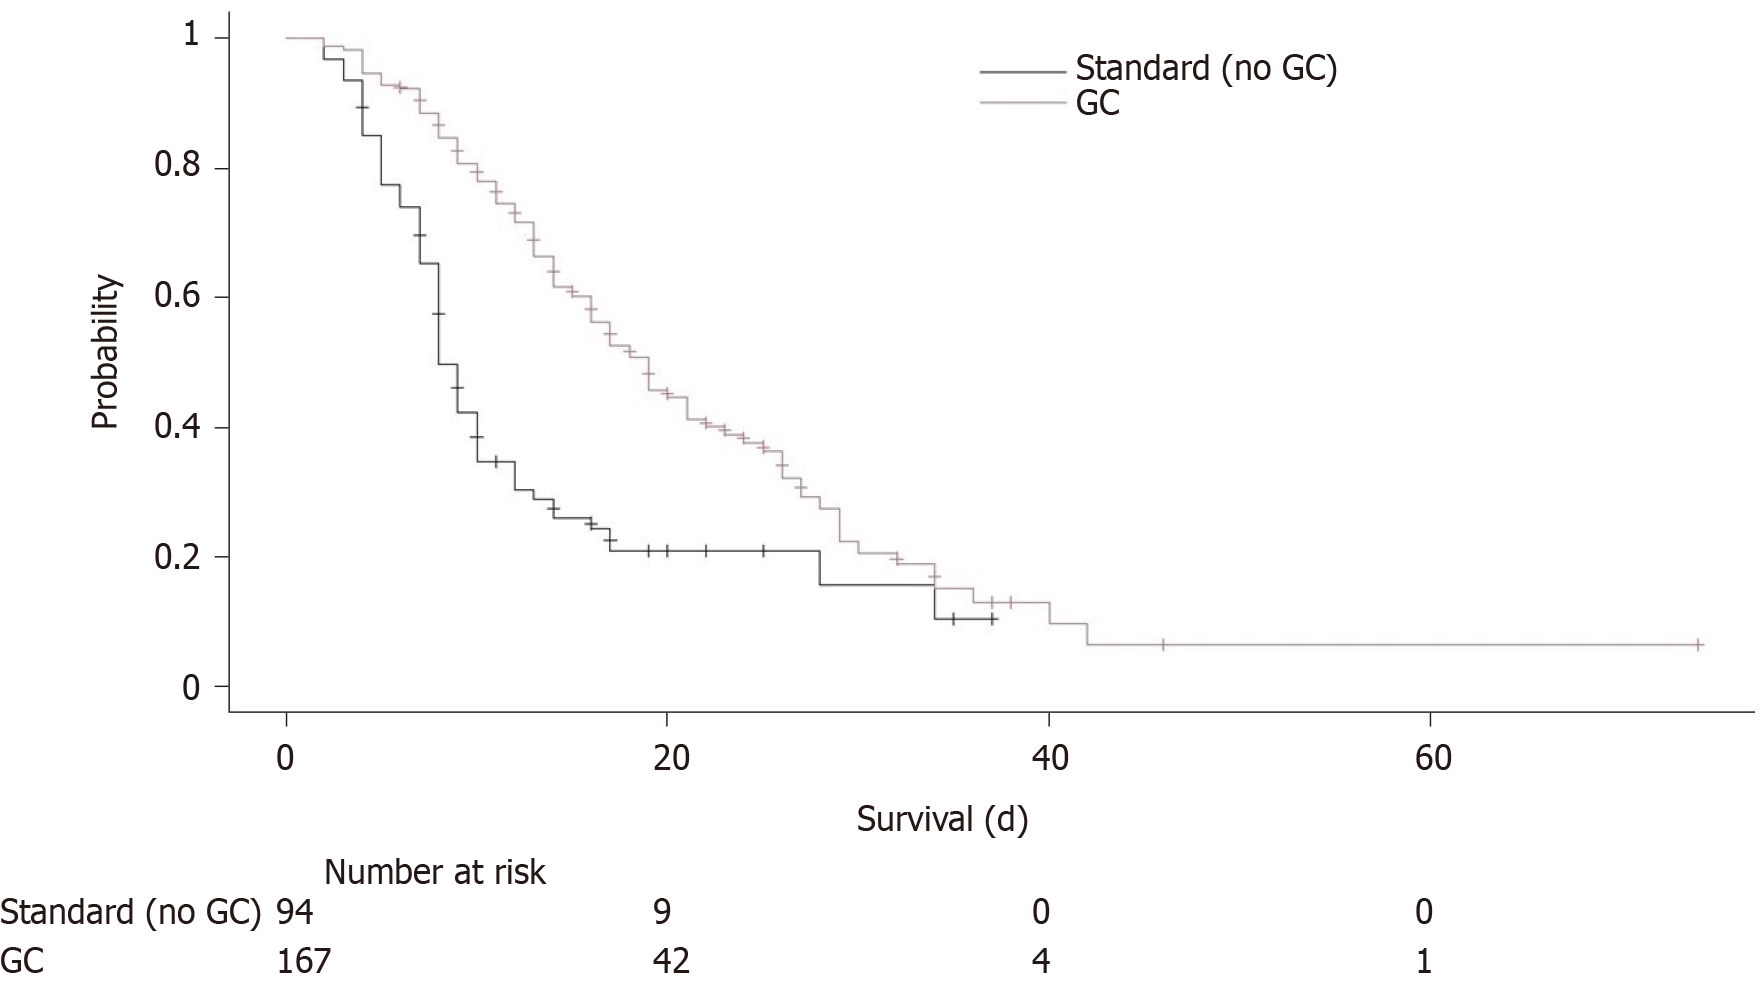
Figure 1 Kaplan Meier survival curve demonstrating increased survival in all patients who received glucocorticoid (red line) vs no glucocorticoid therapy (black line) log-rank test P < 0.
001.
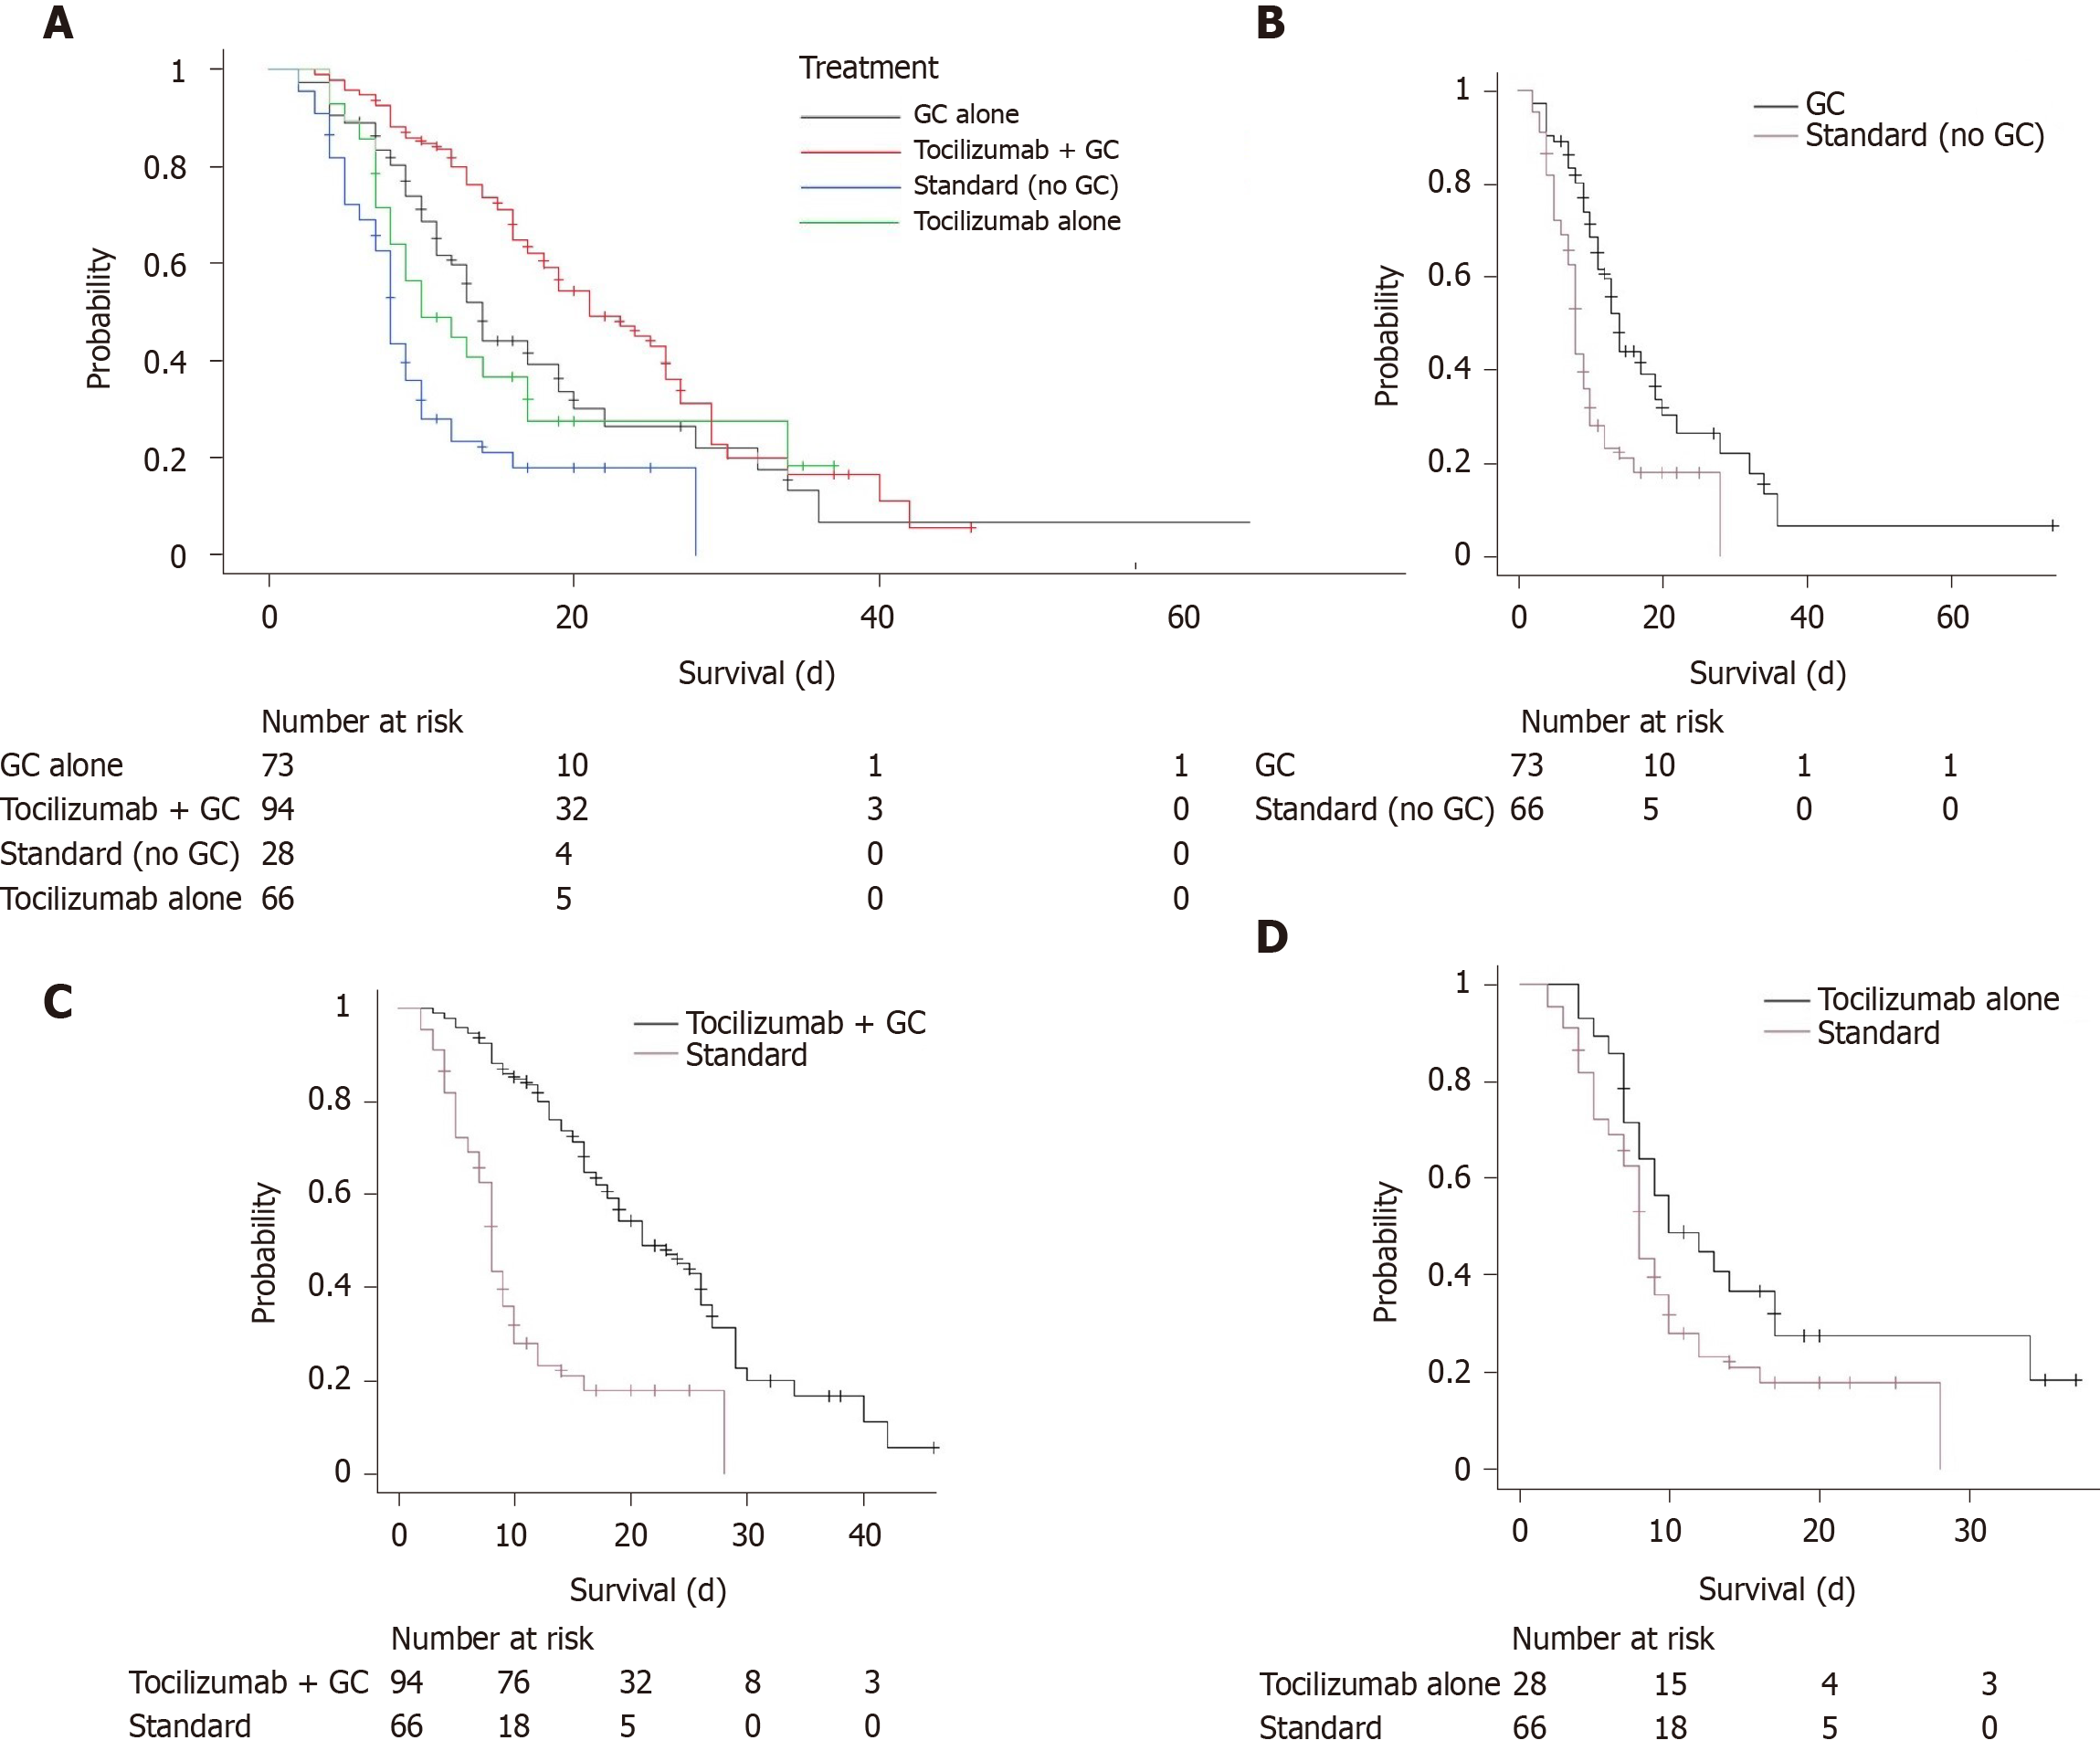
Figure 2 Kaplan Meier survival curve.
A: Kaplan Meier survival curve demonstrating increased survival differences in groups receiving tocilizimab + glucocorticoid (GC) (red line), GC alone (black line), tocilizumab alone (green line), and standard treatment (blue line), log rank test with Bonferroni adjustment, P < 0.001; B: Kaplan Meier survival curve comparing groups GC alone (black line), and standard treatment (red line) log rank test, P < 0.001; C: Kaplan Meier survival curve comparing groups tocilizumab + GC (black line), and standard treatment (red line) log rank test, P = 0.016; D: Kaplan Meier survival curve comparing groups tocilizumab (black line), and standard treatment (red line) log rank test, P = 0.062.
- Citation: Iglesias JI, Vassallo AV, Sullivan JB, Elbaga Y, Patel VV, Patel N, Ayad L, Benson P, Pittiglio M, Gobran E, Clark A, Khan W, Damalas K, Mohan R, Singh SP. Retrospective analysis of anti-inflammatory therapies during the first wave of COVID-19 at a community hospital. World J Crit Care Med 2021; 10(5): 244-259
- URL: https://www.wjgnet.com/2220-3141/full/v10/i5/244.htm
- DOI: https://dx.doi.org/10.5492/wjccm.v10.i5.244


