Copyright
©The Author(s) 2025.
World J Clin Pediatr. Dec 9, 2025; 14(4): 111641
Published online Dec 9, 2025. doi: 10.5409/wjcp.v14.i4.111641
Published online Dec 9, 2025. doi: 10.5409/wjcp.v14.i4.111641
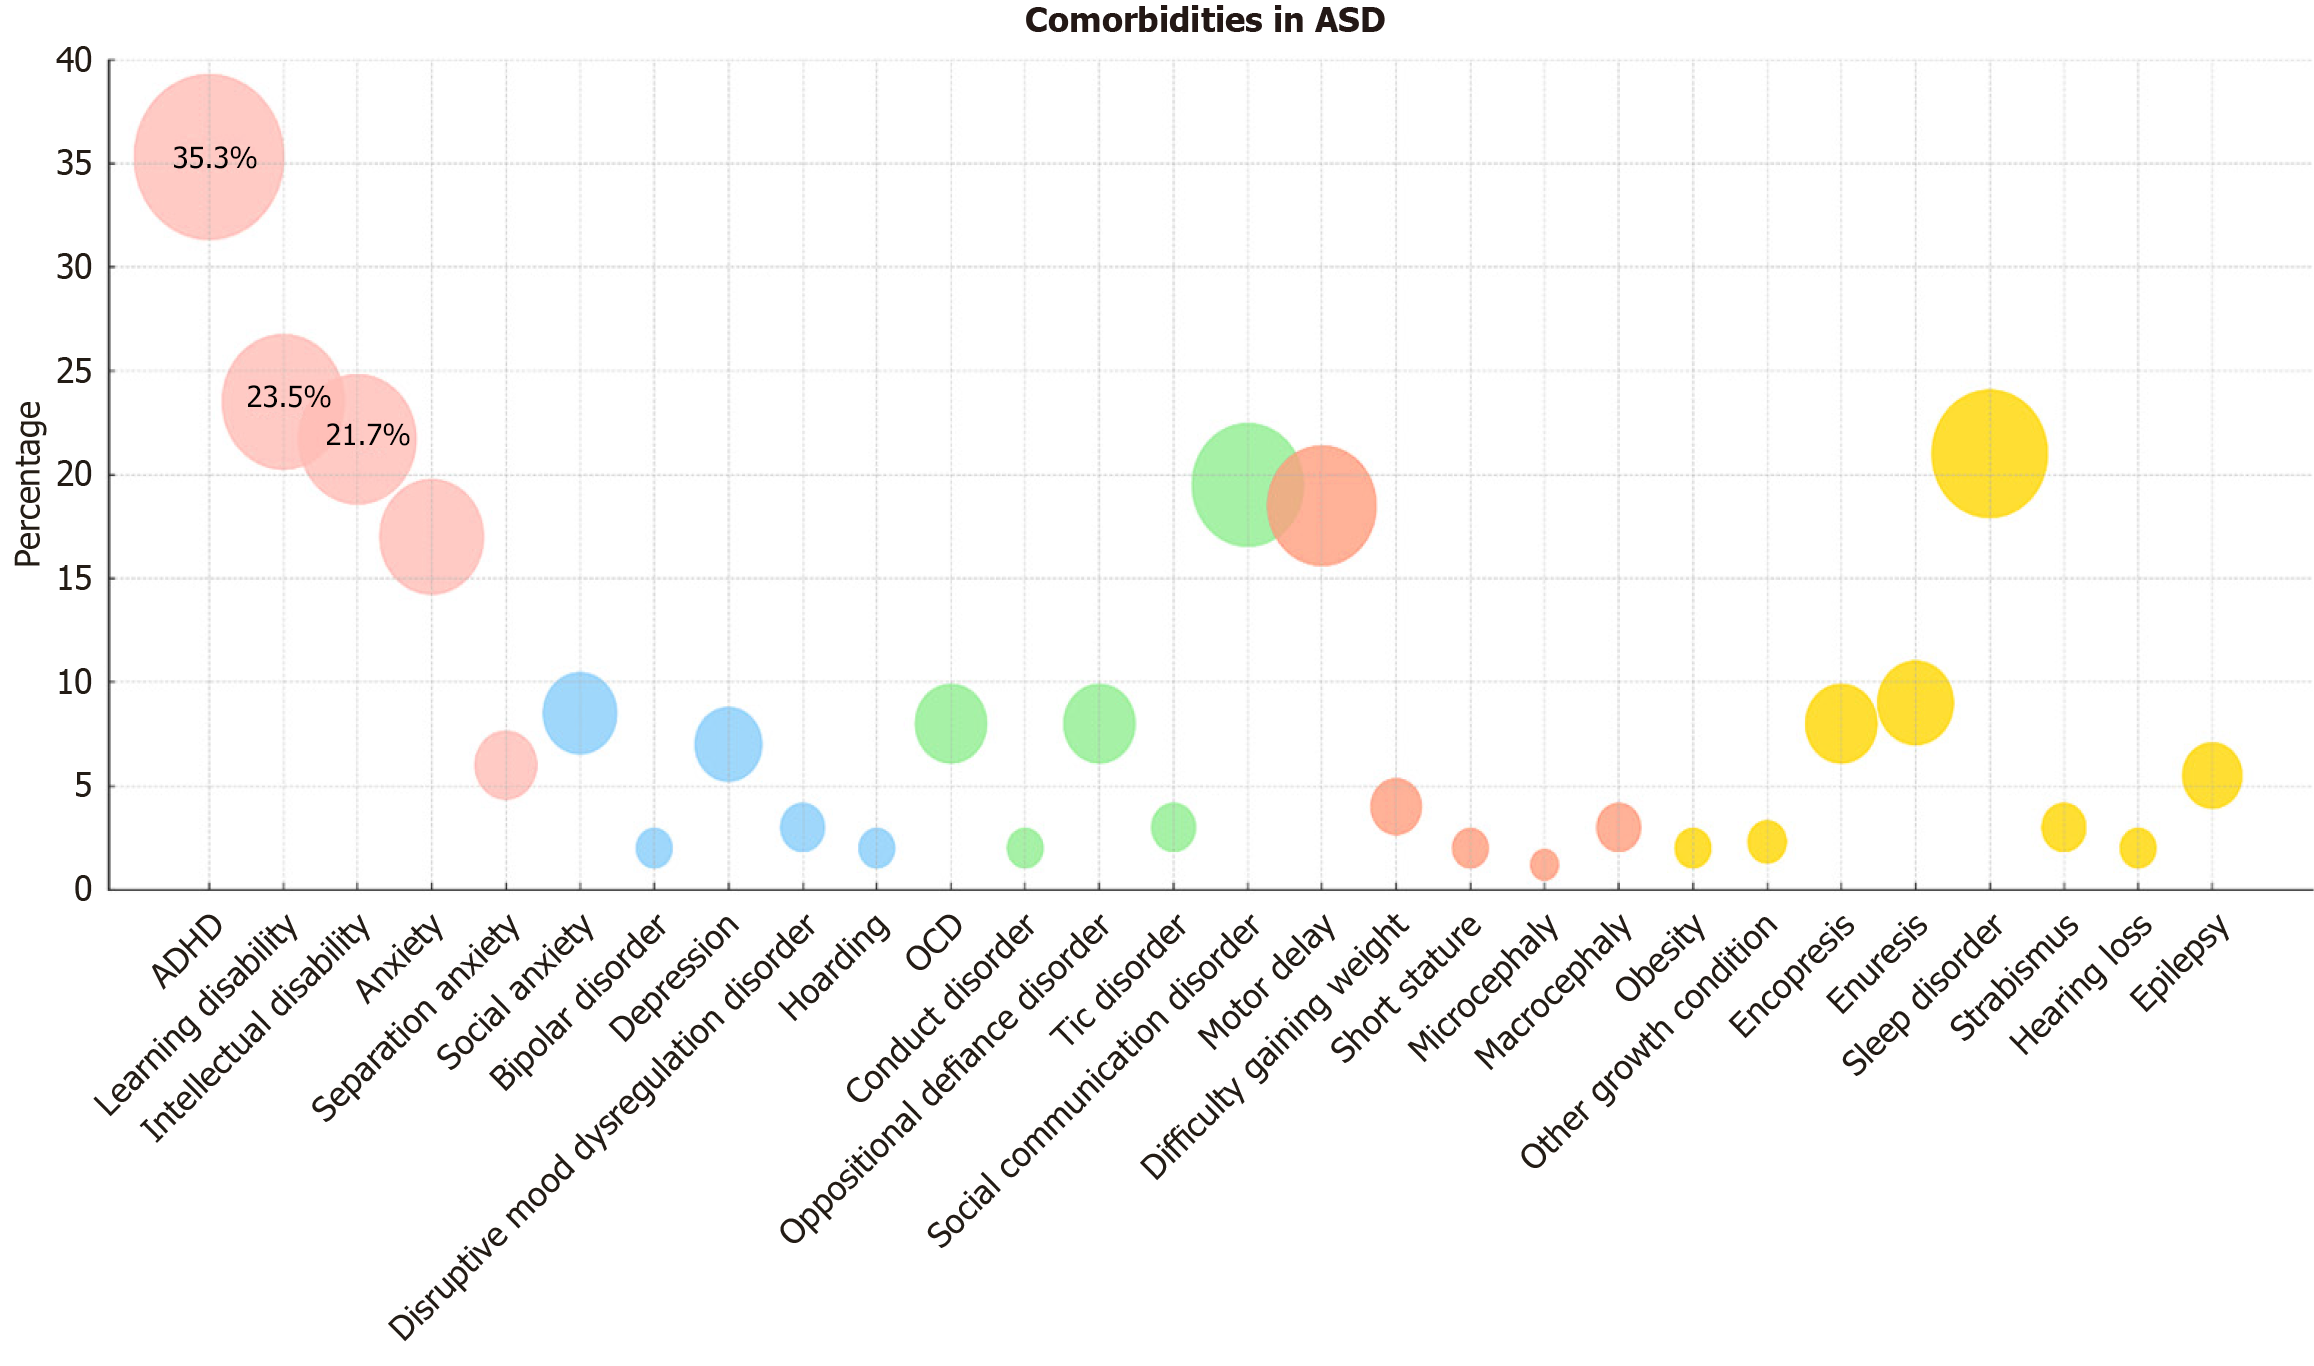
Figure 1 This visualization illustrates the distribution of co-occurring conditions in autism.
Attention deficit hyperactivity disorder is the most common co-occurring condition, affecting 35.3% of individuals, followed by learning disability at 23.5%, and intellectual disability at 21.7%. ADHD: Attention deficit hyperactivity disorder; OCD: Obsessive compulsive disorder; ASD: Autism spectrum disorder.
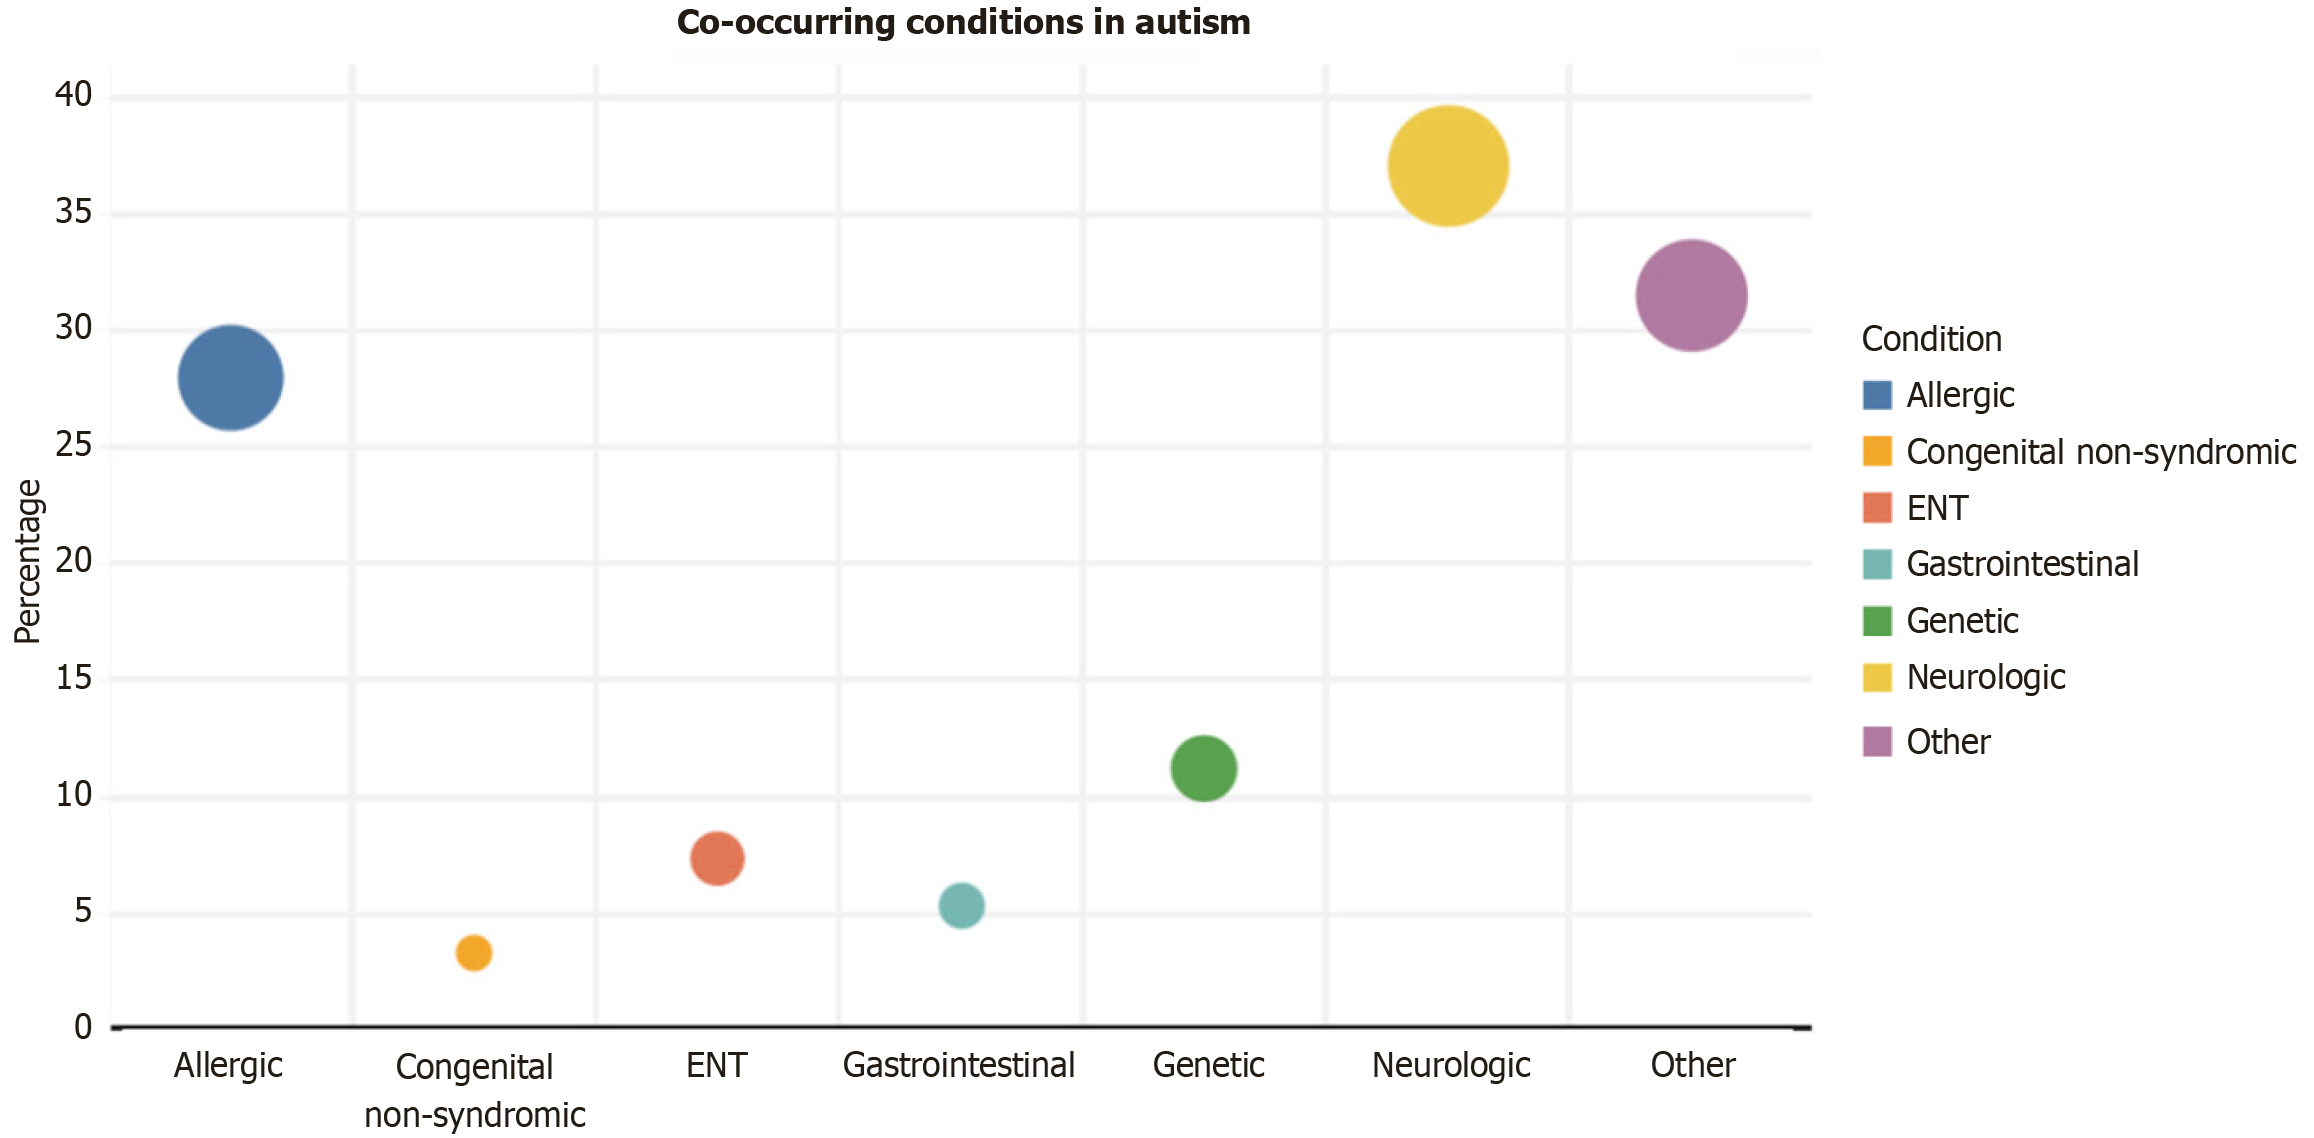
Figure 2 A retrospective analysis of medical records for 1858 children was conducted.
Neurological conditions were the most common, affecting 37% of children (seizures most common in 7.79%). Other conditions include refractory errors (7.05%), strabismus (5.94%), and plagiocephaly and/or torticollis (5.94%). ENT: Ear, nose, throat.
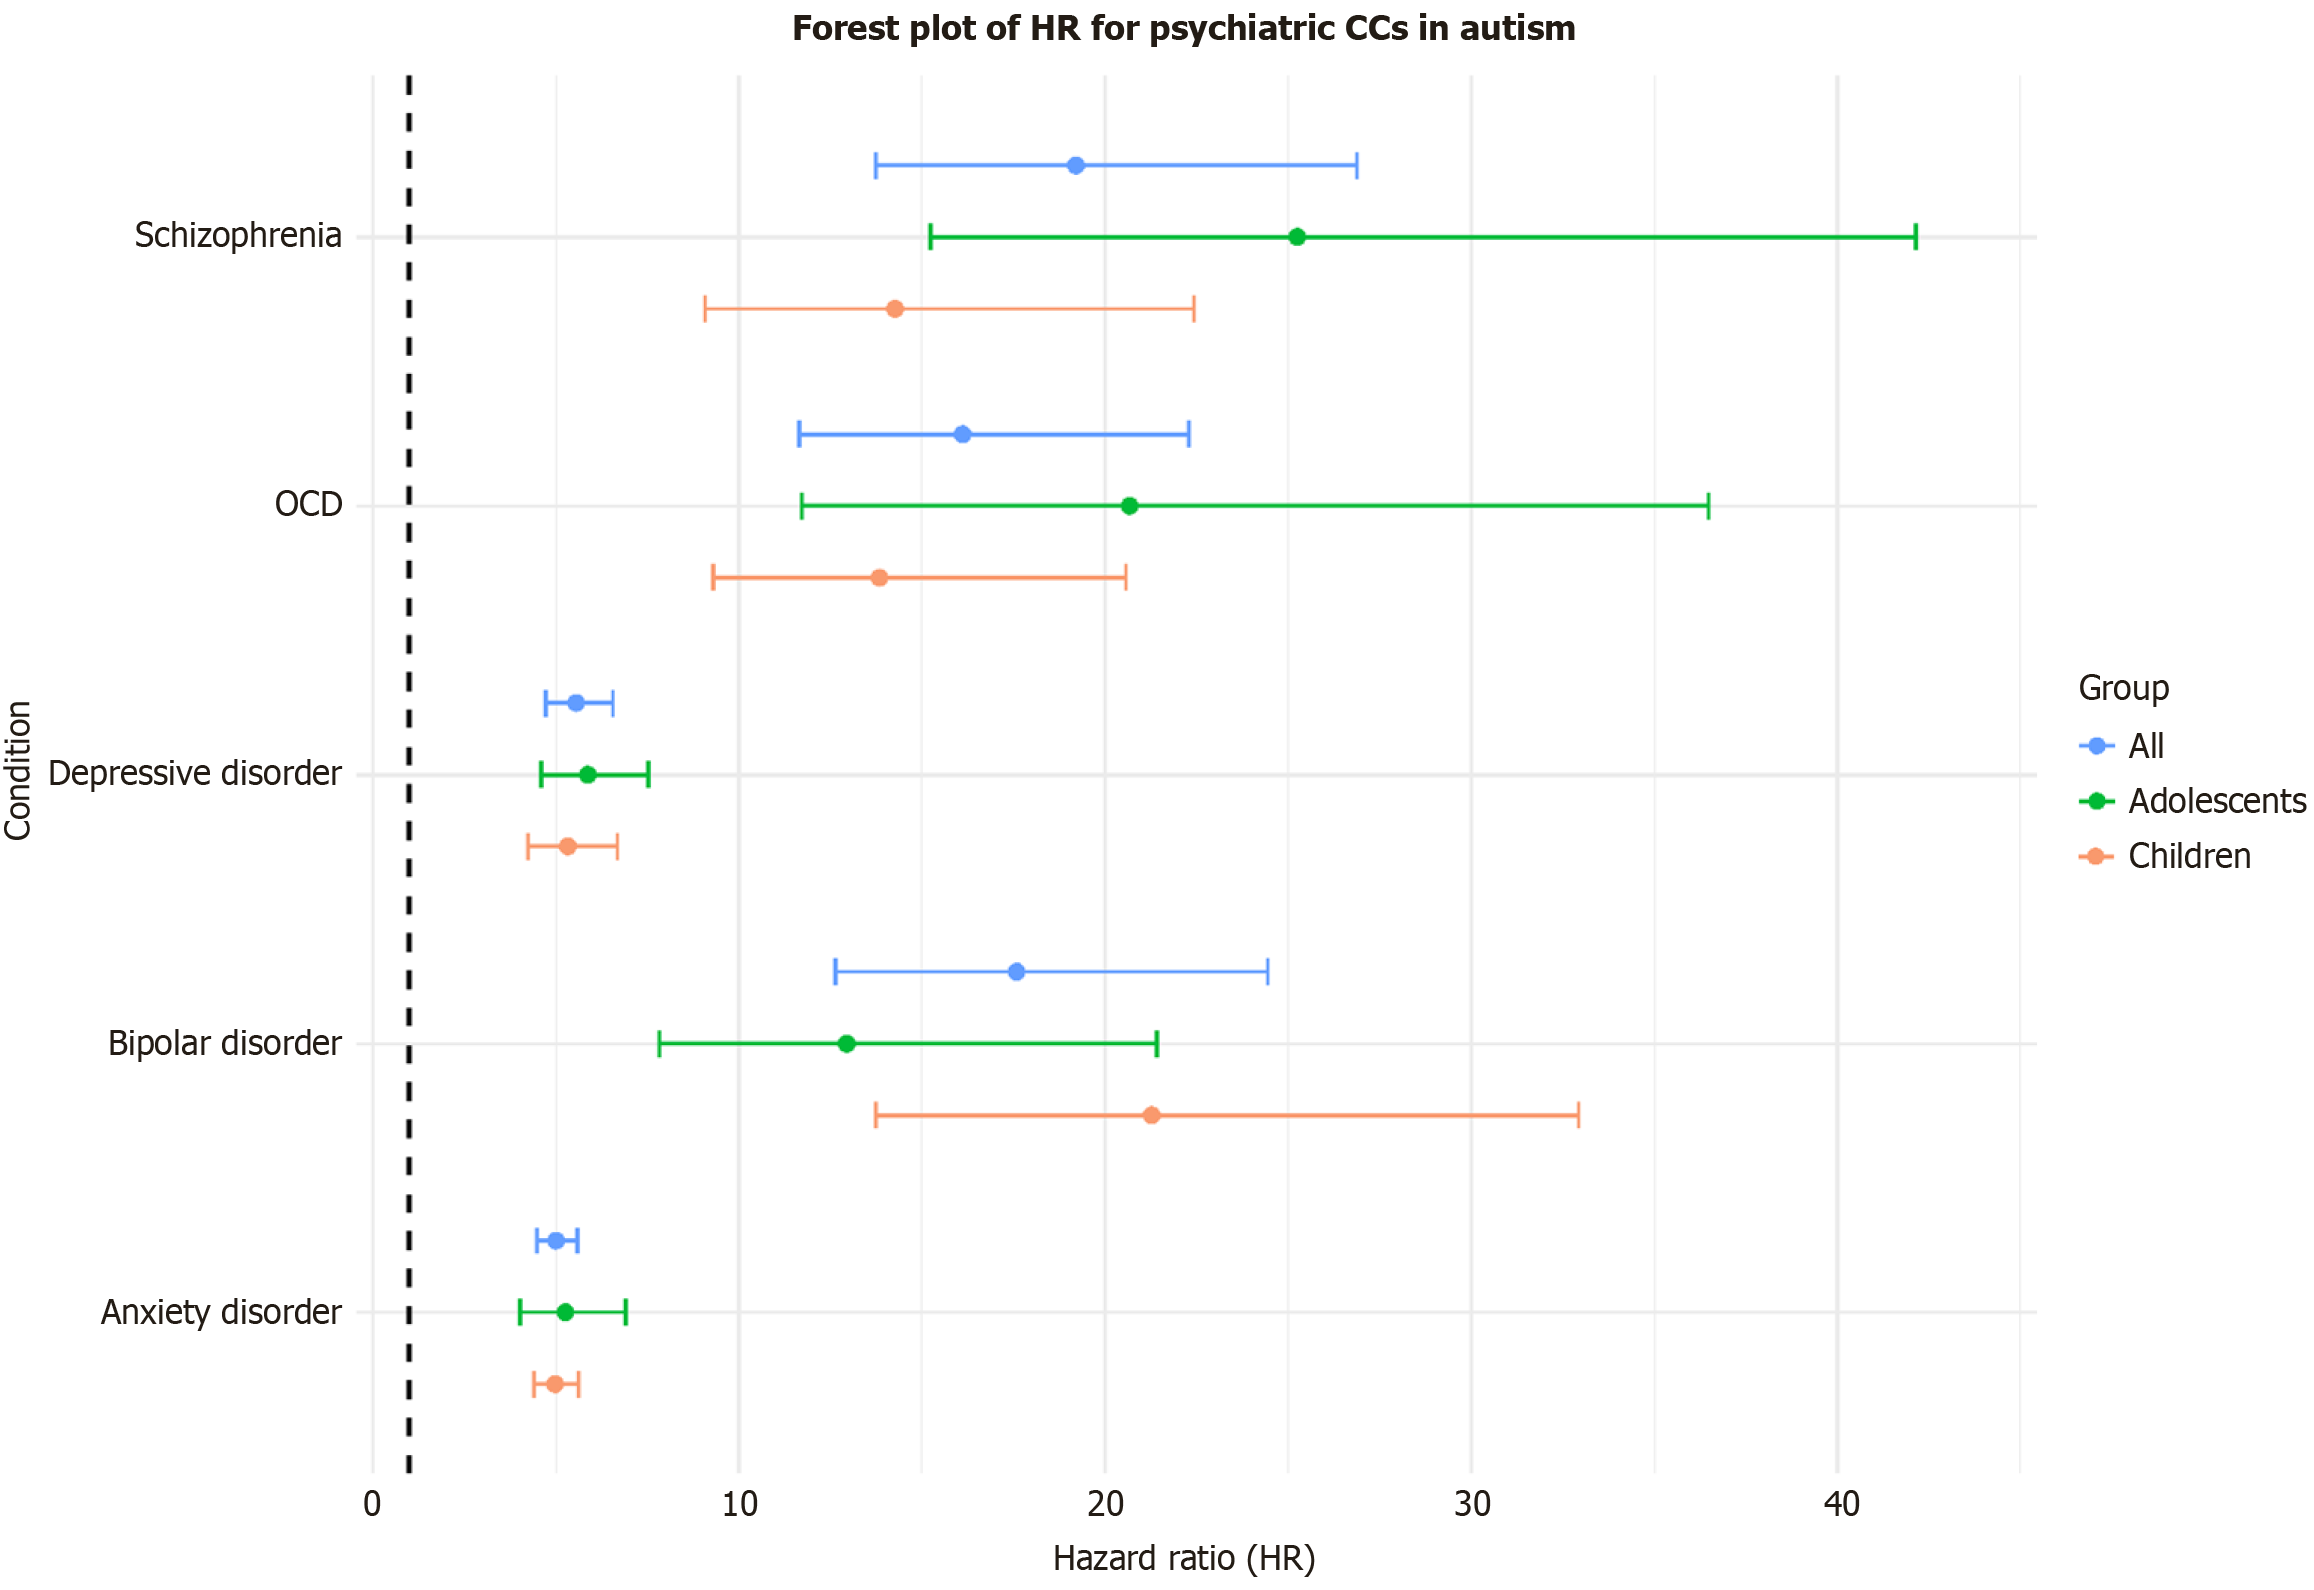
Figure 3 Forest plot of hazard ratios and 95%CIs for the risk of developing subsequent psychiatric co-occurring conditions in autism compared to neurotypical controls.
The plot includes estimates for children, adolescents, and the overall autism population across five psychiatric conditions: Anxiety disorder, obsessive-compulsive disorder, schizophrenia, bipolar disorder, and depressive disorder. Hazard ratios (HRs) greater than 1 indicate an increased risk of developing the disorder in the autism group compared to neurotypical controls. The dotted vertical line represents an HR of 1, indicating no difference in risk between autism and neurotypical controls. All results are statistically significant with a P < 0.05, indicating that the increased risks observed are unlikely due to chance. Error bars reflect the variability in the estimates, with wider intervals indicating greater uncertainty. CCs: Co-occurring condition; HR: Hazard ratio; OCD: Obsessive compulsive disorder.
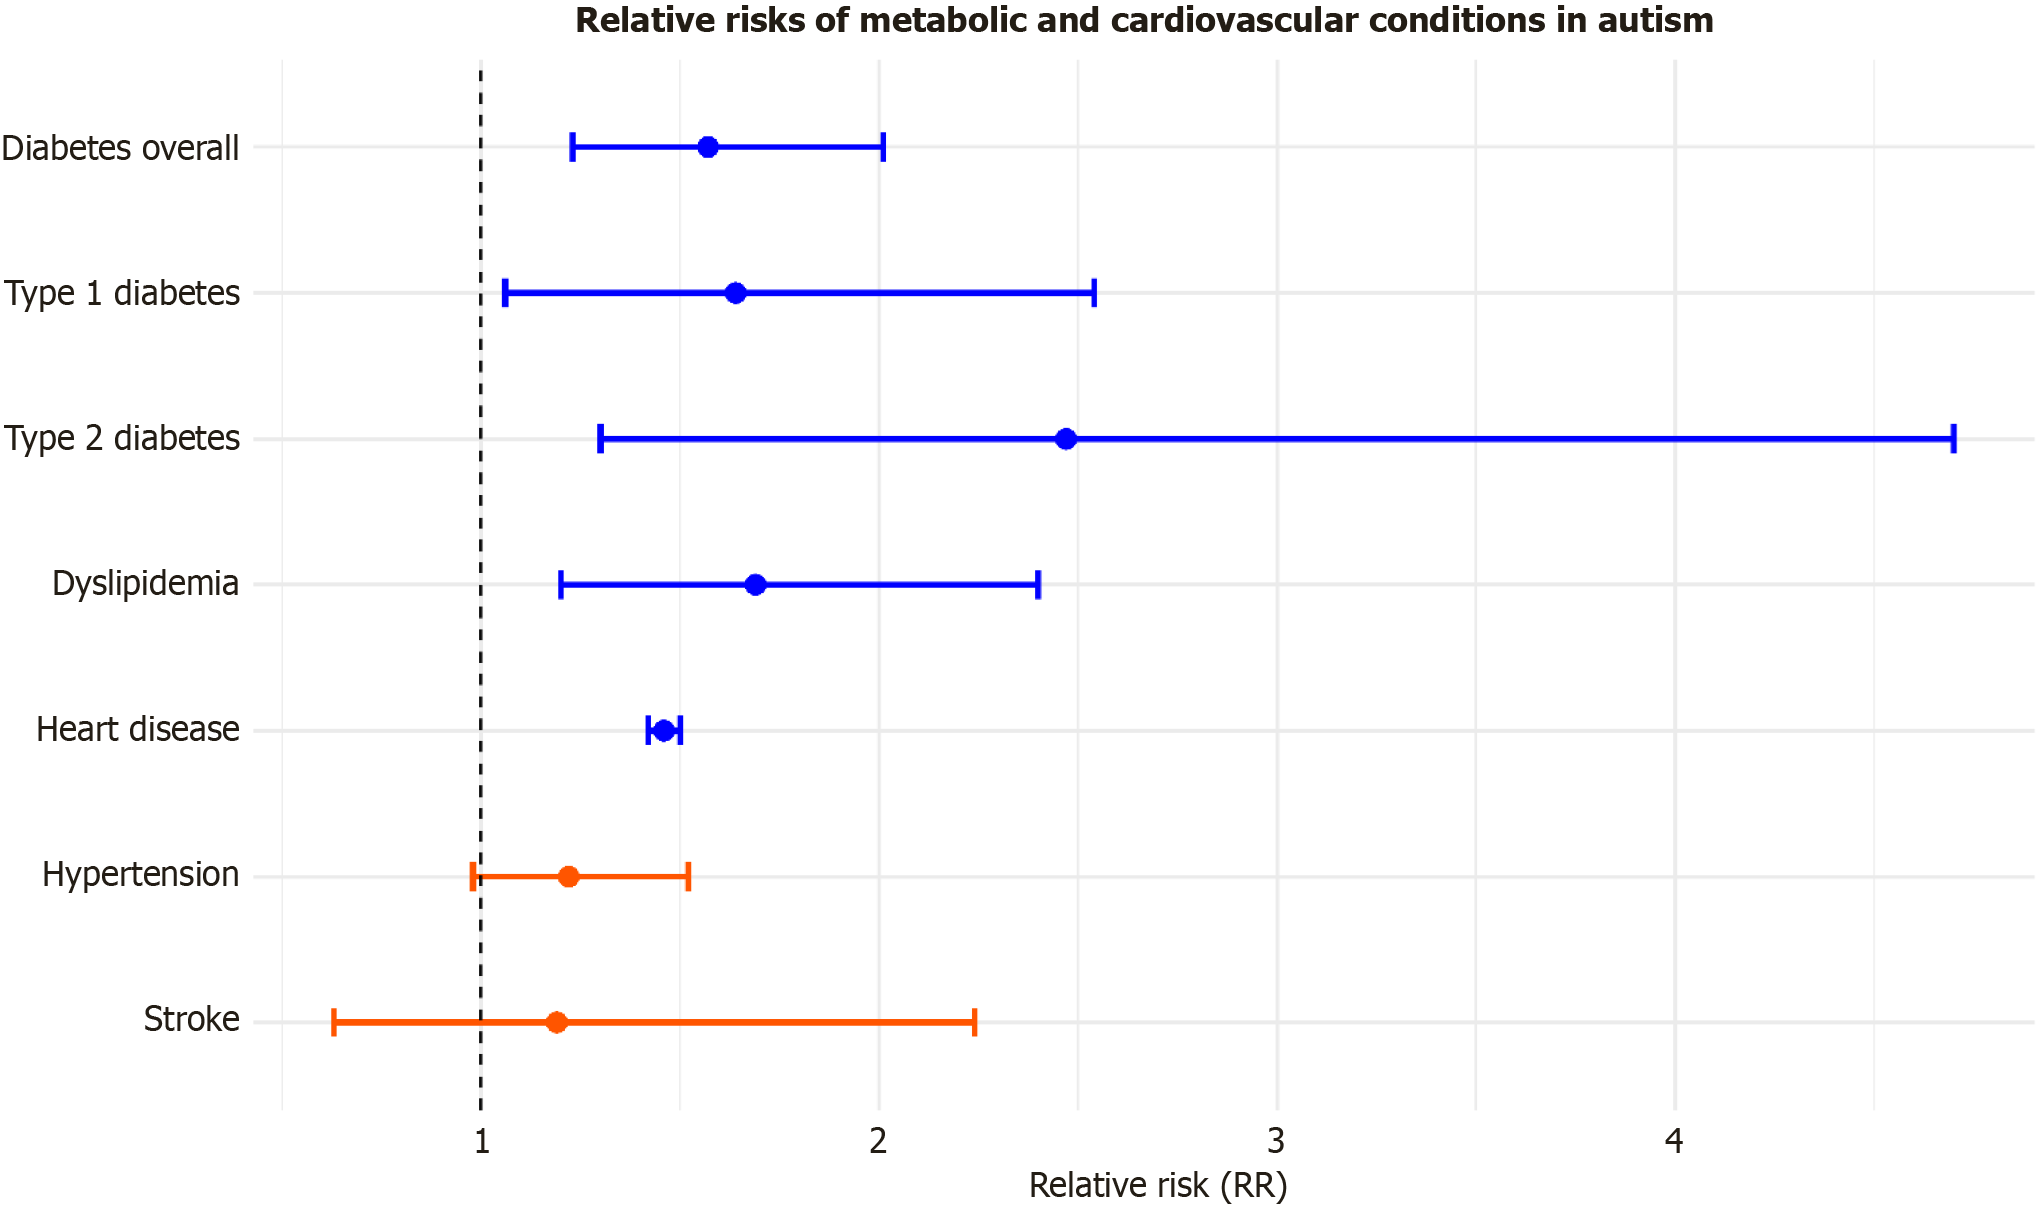
Figure 4 Forest plot of relative risks and 95%CIs for metabolic and cardiovascular conditions among autistic patients compared to neurotypical controls.
The plot presents pooled relative risk (RRs) from meta-analyses across multiple studies for various conditions: Diabetes overall, type 1 diabetes, type 2 diabetes, dyslipidemia, heart disease, hypertension, and stroke. Blue points indicate significant associations (P < 0.05), where the 95%CI does not cross the line of no effect (RR = 1), suggesting a higher risk of the condition in autistic individuals compared to controls. Red points represent non-significant results (P ≥ 0.05), where the 95%CI crosses the RR = 1 line, indicating no statistically significant difference in risk between autism and controls. The vertical dashed line at RR = 1 serves as a reference, representing no increased or decreased risk. Conditions such as type 2 diabetes and dyslipidemia show a notably higher risk in autism, while the risk differences for hypertension and stroke are not statistically significant.
- Citation: Hasan H, Hagerman R, Say DS, Nguyen AP, Babata K, Oyegbile-Chidi T, Herrera-Guerra A, Torrents C, Silver CE, Restrepo B. Parallel paths: A narrative review exploring autism and its co-occurring conditions. World J Clin Pediatr 2025; 14(4): 111641
- URL: https://www.wjgnet.com/2219-2808/full/v14/i4/111641.htm
- DOI: https://dx.doi.org/10.5409/wjcp.v14.i4.111641


